 Open Access Article
Creative Commons Attribution 3.0 Unported Licence
Enhancing growth-relevant metabolic pathways of Arthrospira platensis (CYA-1) with gamma irradiation from 60Co†
Jun Cheng *,
Hongxiang Lu
 ,
Ke Li,
Yanxia Zhu and
Junhu Zhou
State Key Laboratory of Clean Energy Utilization, Zhejiang University, Hangzhou 310027, China
First published on 8th May 2018
Abstract
The biomass yield of Arthrospira mutant ZJU9000 was 176% higher than that of wild type on day 4, and the results of transcriptome sequencing showed that processes related to cell growth were synergistically enhanced in this mutant. The amount of energy for biomass accumulation increased because the efficiency of the photoreaction was enhanced by the elevated levels of chlorophyll a and carotene. The increased biosynthesis rates of ribose phosphate, nucleotides and multiple vitamins increased the production of genetic materials for cell proliferation. Furthermore, the carbon concentration mechanism in mutant ZJU9000 was enhanced, indicating the increased utilization efficiency of CO2 at low concentration (0.04 vol% in air). The enhancement of these growth-relevant metabolic pathways contributed to the robust growth of Arthrospira mutant ZJU9000.
1. Introduction
Phytoplanktons, including cyanobacteria as a major group, are responsible for approximately 50% of photosynthesis worldwide, thereby dominating the global conversion of CO2.1 Arthrospira (Spirulina) is one of the fastest growing cyanobacteria. The taxonomic relationship between Arthrospira and Spirulina has been unclear for a long time.2 Spirulina was later found to be a prokaryotic cyanobacterium belonging to the genus Arthrospira,3 thus the name Arthrospira is adopted in this study (we used the term “Spirulina” in our previous studies). Improving Arthrospira's growth rate increases the amount of CO2 it can assimilate and alleviates the greenhouse effect. Moreover, its biomass can be used as food and feed supplements.4,5 Performing genetic analysis on Arthrospira can help us further understand the mechanisms underlying different growth phenotypes between strains. Two resources allowed us to investigate different Arthrospira phenotypes at the genetic level. Firstly, the genome sequence of Arthrospira sp. PCC9438 became available,6 and thus effective gene identification through high-throughput sequencing technology has become feasible.7 Secondly, the Kyoto Encyclopedia of Genes and Genomes (KEGG) resource (http://www.genome.jp/kegg/) provided a reference knowledge database for linking genomes to biological systems and the wiring diagrams of interaction networks and reaction networks (KEGG pathway). The continuous increase in the amount of genomic and molecular information has enabled researchers to understand higher order biological systems, such as cells and organisms, and their interactions with the environment.8The gene expression levels and metabolism of Arthrospira under various conditions were investigated in some studies, such as that of Badri et al., who irradiated Arthrospira sp. PCC8005 by 60Co gamma-ray irradiation at various dosages and analysed the differences in gene expression levels between wild type and irradiated strains at different healing times (0, 2 and 5 h). They found that the Arthrospira pathways, including the tricarboxylic acid (TCA) cycle and pentose phosphate pathway, changed significantly in response to abrupt and intense radiation.9 Panyakampol et al. showed that several heat shock proteins of Arthrospira platensis C1 exhibited rapidly increasing transcription levels in response to high temperature.10 Wang et al. analysed differentially expressed genes during protein coding and relevant metabolic pathways in Arthrospira under various temperatures and found that differentially expressed positive proteins were mainly involved in post-translational modification and energy metabolism.11 Esen and Ozturk Urek reported that the iron and ammonium nitrate concentrations for the optimum growth, pigment and metabolite levels and enzyme activities of Arthrospira cells were 50 × 10−6 mol L−1 and 10 × 10−3 mol L−1, respectively.12 However, only the gene expression levels of Arthrospira cells in response to various cultivate conditions were considered in these studies, and no mutant with hereditarily stable phenotypes were obtained. Abomohra et al. irradiated Arthrospira platensis with gamma rays and found that 2 and 2.5 kGy dosages inhibited its biomass production. They also investigated changes in the cellular components of these species under various radiation dosages. Their results indicated that carotenoid productivity greatly increased significantly after irradiation, whereas the contents of other major components, such as chlorophyll a and protein, decreased.13 Although Abomohra's study comprehensively investigated the influence of gamma radiation on Arthrospira cells, all the analyses were performed at the macro level and lacked the perspective view at the genetic-level.
ZJU9000 is a hereditarily stable Arthrospira mutant culture obtained after 9 kGy gamma irradiation exhibiting a robust growth in respect to the wild type.14 In the present study, the difference in gene expression levels between the wild type and mutant ZJU9000 were analysed. The purpose was to investigate the underlying cause of the mutant's robust growth. Transcriptome sequencing showed that many key genes of the mutant ZJU9000 cells were expressed at much higher levels than those of the wild type, such as the genes related to photosynthetic pigments synthesis, nucleotides synthesis, glycolysis and TCA cycle. Expressions of these genes provided the materials and energy basis for cell proliferation. Moreover, mutant ZJU9000 captured more CO2 at low concentrations than wild type Arthrospira owing to its improved carbon concentration capability. These results elucidated the robust growth of Arthrospira ZJU9000.
2. Materials and methods
2.1. Arthrospira strains and preparation of samples
Wild type Arthrospira (Spirulina) platensis (CYA-1) was obtained from Marine Biological Culture Collection Center, Institute of Oceanology, Chinese Academy of Sciences. Arthrospira mutant culture ZJU9000 was induced by gamma rays irradiation from 60Co, detailed gamma radiation-induced mutation method was demonstrated in our previous work.14 Wild type Arthrospira and mutant ZJU9000 were cultivated under continuous light source of 8000 Lux supplied at the surface of bioreactors using four cool white lights (Philips, TLD 36 W, 927982286574) and two warm lights (Philips, TLD 36 W, 927982283074). Microalgae cultures in the bioreactors were bubbled with air at a flow rate of 30 ml minute−1 (CO2 concentration = 0.038 vol%). Algae species were cultivated at 25 °C in column bioreactors (160 × 10−3 m height, 56 × 10−3 m inner diameter and 60 × 10−3 m outer diameter) with 300 ml working column in an artificial greenhouse. Specific growth rate μ of microalgae was calculated as follows:where m1 was the dry weight at time t1 and m0 was the dry weight at time t0, t1 is the day after t0.
On day 4, cultures of wild type Arthrospira and ZJU9000 were filtered, quick-frozen in liquid nitrogen, collected and stored at −80 °C before further analysis.
2.2. Pigments and photosynthetic efficiency measurement
Pigments and photosynthetic efficiency of wild type Arthrospira and mutant ZJU9000 were measured on the 4th day.Chlorophyll a and carotenoid content were measured by chemical method following Pruvost's protocol.15 1 ml microalgae culture was filtered and the pellet was extracted with 3 ml methanol (≥99.9%) for 30 min in the dark at 45 °C. Supernatant was filtered and absorption spectra were measured by spectrophotometer UV-3200B (Mapada instruments, Shanghai, China) at wavelength 480, 652 and 665 × 10−9 m (A480, A652 and A665). Chlorophyll a and carotenoid concentrations were calculated according to the equations of Lima16 (chlorophyll a) and Strickland and Parsons17 (carotenoid) as follows:
| chlorophyll a (μg ml−1) = 12.6 × A665 |
| carotenoid (μg ml−1) = 4 × A480 |
Photosynthetic efficiency was reflected by Fv/Fm value (FMS-2, Hansatech, UK) of microalgae culture. 2 ml microalgae sample was added into the test tube followed by a 10 min dark adaption. Then the microalgae sample was exposed to a saturation light pulse and F0 and Fm were measured. Fv/Fm value was calculated as follows:
| Fv/Fm = (Fm − F0)/Fm |
2.3. RNA extraction, library preparation and bioinformatics analysis
RNA was extracted from collected samples (in Section 2.1) of both wild type and mutant ZJU9000, followed by the library preparation and bioinformatics analysis. We followed manufacturer's protocol mirVana miRNA kit (Thermofisher) for RNA extraction, Truseq stranded mRNA LT sample prep kit (Illumina) for sequencing library preparation, and Bioanalyzer's High Sensitivity DNA kit (Agilent) for quality control of libraries. Specific procedures were described in the ESI.† The transcriptomes of wild type and mutant ZJU9000 were subsequently compared to each other.2.4. Figures of metabolic pathway and colours in figures
Kyoto Encyclopedia of Genes and Genomes (KEGG) mapping was used to characterise the metabolic pathways (http://www.genome.jp/kegg/pathway.html). The uncoloured pathway map was the original version which was manually drawn by the in-house software, KegSketch. In this study, organism-specific pathway was chosen and “Arthrospira platensis NIES-39” was selected in “reference pathway”. Specific genes and enzymes which belonged to Arthrospira automatically showed up as green on the map. Among these specific genes and enzymes, up-regulated and down-regulated differentially expressed genes (DEGs) were coloured with red and blue, respectively.3. Results and discussion
3.1. Difference in growth phenotype and general analysis of DEGs between wild type Arthrospira and ZJU9000
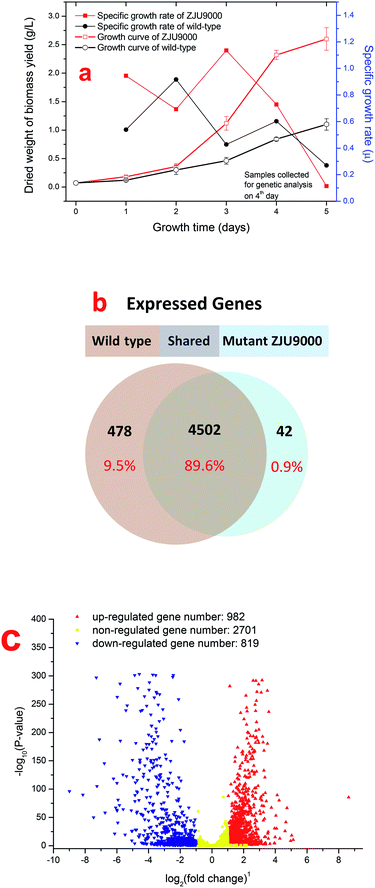
The growth curves and specific growth rates of wild type Arthrospira and mutant ZJU9000 were shown in Fig. 1a. The biomass yield and highest growth rate of the mutant ZJU9000 were both higher than those of the wild type. The peak specific growth rate of mutant ZJU9000 (1.13) was 23% higher than that of wild type (0.92). The growth curves of both strains in this study were different from our previous work14 because the inoculation stage of microalgae might have been different in diverse batches of cultivation. However, the biomass yield of ZJU9000 on day 4 was 176% higher than wild type, and the boosted biomass yield in ZJU9000 was consistent with the results in our previous work.High-throughput sequencing was used for the systematic analyses of the gene expressions of wild type Arthrospira and mutant ZJU9000 cells. The purpose was to identify the differences in metabolic pathways, especially those that led to the mutant's increased biomass yield. A total of 16![[thin space (1/6-em)]](https://www.rsc.org/images/entities/char_2009.gif) 923
923![[thin space (1/6-em)]](https://www.rsc.org/images/entities/char_2009.gif) 580 and 12
580 and 12![[thin space (1/6-em)]](https://www.rsc.org/images/entities/char_2009.gif) 718
718![[thin space (1/6-em)]](https://www.rsc.org/images/entities/char_2009.gif) 076 high-quality clean reads were identified from the wild type and mutant Arthrospira, respectively.
076 high-quality clean reads were identified from the wild type and mutant Arthrospira, respectively.
The correlation coefficient of gene expression level between the two samples represented their similarity. If the coefficient was closer to 1, then the similarity between them was higher.18 Samples belonging to biological replicates should have a coefficient higher than 0.92. However, the correlation coefficient between the wild type Arthrospira and ZJU9000 was only 0.34, indicating the dramatic variation between the two strains.
As shown in Fig. 1b, 4502 genes were expressed both before and after mutation. Among these shared genes, 1801 genes were differentially expressed, of which 982 were up-regulated and 819 were down-regulated (Fig. 1c). Particularly, the unique expressed genes in one strain (unexpressed genes in the other strain) were also counted as DEGs and were included in subsequent analyses.
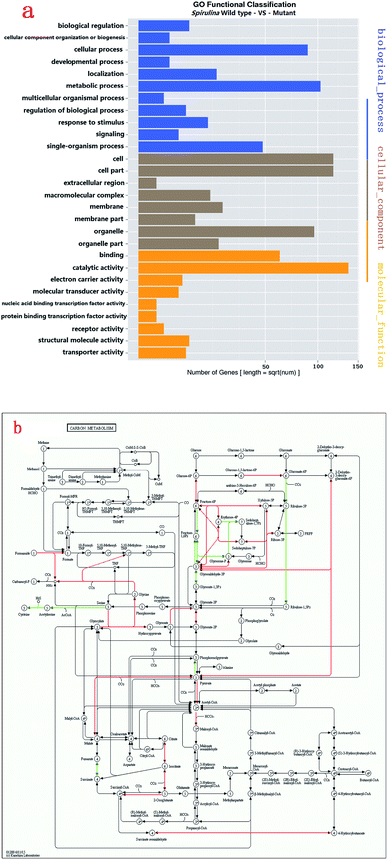
GO enrichment analysis was performed on 1801 DEGs on the basis of the GO database to further explore the biological function of DEGs derived by gamma radiation from 60Co. Catalytic activity had the highest number of DEGs, followed by cell/cell part and metabolic process (Fig. 2a). The results of the GO enrichment analysis showed that catalytic activities, cell part and metabolic process in ZJU9000 significantly changed, thereby affecting the growth phenotype and CO2 biofixation pathways of the mutant.
The KEGG analysis results on carbon metabolism (Fig. 2b) showed the overexpression of TCA cycle, glycolysis, pentose phosphate pathway, Calvin cycle and C4-dicarboxylic acid cycle genes. These pathways, such as energy provision in vivo, synthesis of genetic materials and carbon fixation, were associated with the cell growth and proliferation of Arthrospira. The up-regulation of these genes proved the enhancement of these growth relevant pathways.
3.2. Enhancing photosynthetic process by improving pigment synthesis in ZJU9000
Natural pigments, such as chlorophyll a and carotene, had important roles in the photosynthetic and pigmentation metabolism of microalgae.19,20 The maximum absorption wavelengths of chlorophyll a and carotene were 420–663 and 448 × 10−9 m, respectively. The different maximum absorption wavelengths of these pigments jointly contributed to the comprehensive utilization of light energy by cells.21–23Pigments synthesis was improved in ZJU9000 because the relevant genes were highly overexpressed (Fig. 3). The bchG and bchP genes, which jointly encoded chlorophyll synthase, the most important enzyme in chlorophyll biosynthesis (eqn (1)), had considerably higher expression levels than those in the wild type (Table 1).
| Chlorophyllide a + phytyl diphosphate → chlorophyll a + diphosphate | (1) |
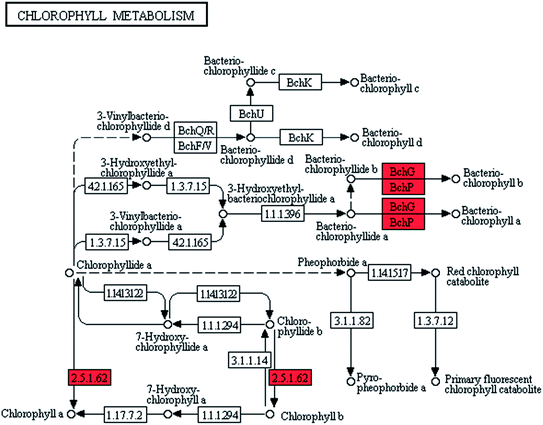 | ||
| Fig. 3 Transcript expression changes involved in chlorophyll metabolism of ZJU9000 (Coloured boxes are Arthrospira-specific enzymes based on references, red boxes represent up-regulated genes). | ||
| EC No.a | Relevant gene name | KOb_definition | Pathway involved | FPKMc | |
|---|---|---|---|---|---|
| Wild type | Mutant ZJU9000 | ||||
| a Enzyme commission number.b Kyoto Encyclopedia of Genes and Genomes (KEGG) orthology.c Fragments per kilobase of exon per million fragments mapped. | |||||
| 2.5.1.62 | bchG | Chlorophyll synthase | Chlorophyll metabolism | 132.1 | 323.28 |
| 1.3.1.83 | bchP | Geranylgeranyl reductase | Chlorophyll metabolism | 93.78 | 642.44 |
| 5.2.1.12 | z-iso | Zeta-carotene isomerase | Carotenoid biosynthesis | 108.31 | 631.62 |
| 5.2.1.13 | crtiso | Prolycopene isomerase | Carotenoid biosynthesis | 115.25 | 720.09 |
| 1.3.99.30 | al1 | Phytoene desaturase (3,4-didehydrolycopene-forming) | Carotenoid biosynthesis | 120.14 | 584.83 |
| 5.3.1.9 | gpi | Glucose-6-phosphate isomerase | Pentose phosphate; glycolysis | 122.58 | 407.67 |
| 2.2.1.1 | tkt | Transketolase | Pentose phosphate | 123.84 | 273.19 |
| 2.2.1.2 | tal | Transaldolase | Pentose phosphate | 118.65 | 527.4 |
| 2.7.1.15 | rbks | Ribokinase | Pentose phosphate | 148.99 | 582.56 |
| 2.7.4.8 | gmk | Guanylate kinase | Purine metabolism | 139.02 | 573.63 |
| 3.6.1.19 | itpa | Inosine triphosphate pyrophosphatase | Purine metabolism; pyrimidine metabolism | 91.76 | 464.34 |
| 2.4.2.10, 4.1.1.23 | umps | Uridine monophosphate synthetase | Pyrimidine metabolism | 94.04 | 245.88 |
| 2.4.1.13 | Sucrose synthase | Sucrose biosynthesis | 111.3 | 241.82 | |
| 3.2.1.21 | bglX | Beta-glucosidase | Sucrose biosynthesis | 144.08 | 343.15 |
| 2.7.1.4 | scrK | Fructokinase | Fructose biosynthesis | 100.31 | 237.94 |
| 1.8.1.4 | dld | Dihydrolipoamide dehydrogenase | Glycolysis; TCA cycle | 106.38 | 335.92 |
| 2.3.1.12 | dlat | Dihydrolipoamide acetyltransferase | Glycolysis; TCA cycle | 103.12 | 219.47 |
| 4.2.1.3 | aco | Aconitate hydratase | TCA cycle | 182 | 476.36 |
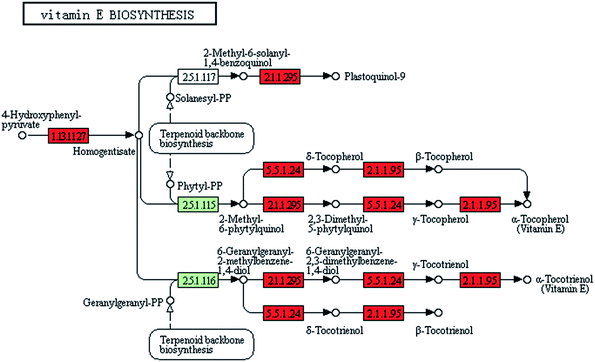
| 5.5.1.24 | vte1 | Tocopherol cyclase | Vitamin E biosynthesis | 122.67 | 327.11 |
| 2.1.1.295 | vte3 | MPBQ/MSBQ methyltransferase | Vitamin E biosynthesis | 99.16 | 216.1 |
| 2.1.1.95 | vte4 | Tocopherol O-methyltransferase | Vitamin E biosynthesis | 60.58 | 170.41 |
| 3.5.4.26, 1.1.1.193 | ribD | Diaminohydroxyphosphoribosylaminopyrimidine deaminase | Vitamin B2 biosynthesis | 90.63 | 380.67 |
| 2.3.1.47 | bioF | 8-Amino-7-oxononanoate synthase | Biotin biosynthesis | 174.37 | 2146.57 |
| 1.1.1.100 | fabG | 3-Oxoacyl-[acyl-carrier protein] reductase | Biotin biosynthesis | 175.55 | 734.8 |
| 2.1.1.163 | ubiE | Demethylmenaquinone methyltransferase | Vitamin K1, K2 biosynthesis | 95.06 | 196.79 |
| 1.1.1.39, 1.1.1.40 | maeB | Malate dehydrogenase | Carbon fixation | 88.19 | 193.95 |
The expression levels of z-iso, crtiso and al1 genes, which catalysed lycopene biosynthesis, were 4.83, 5.25 and 3.87 times higher in the mutant than in the wild type. Cellular lycopene and carotene increased because the former was the precursor of the latter. The up-regulation of the pigment-relevant genes promoted chlorophyll a and carotene synthesis in ZJU9000 and enhanced the efficiency of light utilization.
The pigment measurements showed that on the 4th day, the chlorophyll a and carotenoid contents in mutant ZJU9000 increased by 107.1% and 80.6%, respectively (Table 2). The photosynthetic efficiency test results also showed that the Fv/Fm value of the mutant ZJU9000 was 17.5% higher than the wild type (Table 2). These physiological results affirmed the results of the gene expression analysis on the improvement of pigments and light use efficiency.
| Measurements | Wild type | Mutant ZJU9000 |
|---|---|---|
| Chlorophyll a content (μg ml−1) | 39.2 | 81.2 |
| Carotenoid content (μg ml−1) | 25.0 | 45.2 |
| Fv/Fm value | 0.4575 | 0.5375 |
3.3. More energy was provided in ZJU9000
In ZJU9000, growth rate was positively correlated with energy demand during reproductive processes, such as DNA/RNA duplication and protein synthesis.24 Correspondingly, the expression levels of genes related to glycolysis, TCA cycle and carbohydrate synthesis in cells were much higher in ZJU9000 than in the wild type, indicating the higher energy supply/demand in the mutant.25| UDP-glucose + D-fructose → UDP + sucrose | (2) |
| D-glucoside + H2O → D-glucose + ROH | (3) |
| Pathway | Biological function | Number of up-regulated genes | Number of down-regulated genes | Number of genes both up-regulated and down-regulated | Ratio of up-regulated genes to the DEGsa (%) |
|---|---|---|---|---|---|
| a DEGs means differentially expressed genes. | |||||
| Chlorophyll metabolism | Substrate for photosynthesis | 6 | 0 | 0 | 100 |
| Pentose phosphate pathway | Provide ribose phosphate and NADPH | 9 | 2 | 0 | 82 |
| Purine metabolism | Synthesis of nucleotides: the genetic materials | 13 | 3 | 1 | 76 |
| Pyrimidine metabolism | Synthesis of nucleotides: the genetic materials | 9 | 1 | 2 | 75 |
| Starch and sucrose metabolism | Key steps in the control of carbon flux | 7 | 0 | 0 | 100 |
| Glycolysis | Generate energy (ATP) and NADH | 7 | 2 | 0 | 78 |
| TCA cycle | Provide large amount of energy (ATP) | 5 | 1 | 0 | 83 |
| Vitamin E biosynthesis | Improve photosynthetic efficiency and promote cell proliferation | 12 | 0 | 0 | 100 |
| Vitamin B2 metabolism | Improve photosynthetic efficiency and promote cell proliferation | 3 | 0 | 1 | 75 |
| Biotin metabolism | Improve photosynthetic efficiency and promote cell proliferation | 4 | 0 | 0 | 100 |
Moreover, the expression level of scrK gene, which catalysed fructose formation (eqn (4)), was 1.37 times higher in the mutant ZJU9000 than that in the wild type (Table 1).
| ADP + beta-D-fructose 6-phosphate → ATP + D-fructose | (4) |
The amount of substrates for the key steps in carbon flux and synthesis in the outer membrane and peptidoglycan layer of Arthrospira cells became sufficient when carbohydrate synthesis was improved.28,29
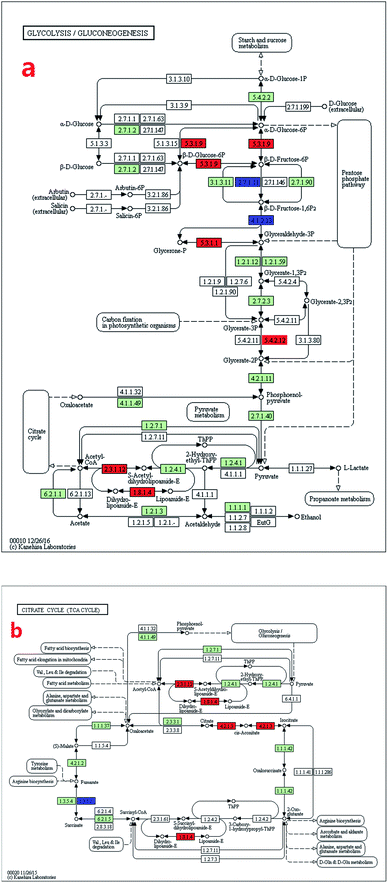
The glycolysis-related genes of the mutant cells had higher expression levels than that of the wild type (Fig. 4a). Eight genes were up-regulated, whereas two genes were down-regulated (Table 3). The expression level of gpi gene, which catalysed the key step of glucose conversion into fructose (eqn (5)), increased by 232% (Table 1) and enhanced the glycolytic reactions, thereby providing more energy for the cells.
| α/β D-glucose 6-phosphate → beta-D-fructose 6-phosphate | (5) |
The expression level of dld gene increased by 216%, and this increase promoted H+ synthesis (eqn (6)).
| enzyme N6-(dihydrolipoyl)lysine + NAD+ → enzyme N6-(lipoyl)lysine + NADH + H+ | (6) |
The expression levels of TCA cycle genes were higher in mutant cells than in wild type cells (Fig. 4b). The expressions of dlat and dld genes, which jointly catalysed pyruvate into acetyl-CoA (the substrate of TCA cycle), increased by 113% and 216%, respectively (Table 1). In the second step of the TCA cycle, citrate was turned into isocitrate under aconitase hydratase (aco) catalysis (eqn (7)). As the expression level of aco gene increased by 162%, second step of the TCA cycle was enhanced and TCA cycle was driven cycling to generate more substrate for ATP synthesis, providing more energy for cell activities.
| Citrate → isocitrate | (7) |
3.4. The amount of synthesized genetic materials for cell proliferation increased in ZJU9000
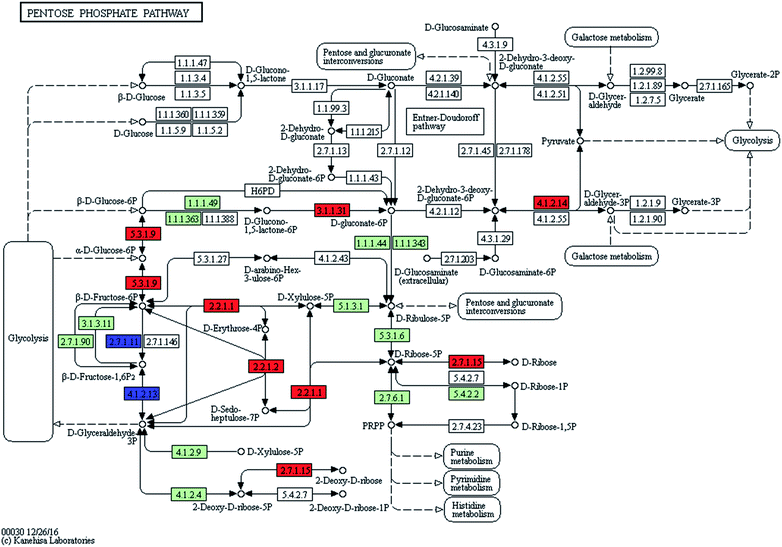
The biomass yield of ZJU9000 was 176% higher than the wild type on the 4th day, and the rate of cell proliferation in the former increased, thereby increasing the amount of substrates of genetic materials, such as nucleotides and ribose 5-phosphate. This improvement was verified by the increased expression levels of genes related to ribose 5-phosphate, purine and pyrimidine nucleotides biosynthesis.| ATP + D-ribose → ADP + D-ribose 5-phosphate | (8) |
The increased ribose 5-phosphate levels in ZJU9000 facilitated the formation of phosphoribosyl pyrophosphate, which is an activated compound used in the biosynthesis of histidine and purine or pyrimidine nucleotides.
The amount of synthesized genetic materials increased in individual mutant cells after 60Co gamma-ray irradiation, and these genetic materials provided the material foundation for rapid cell proliferation.
3.5. More vitamins were synthesized in ZJU9000
The gamma-ray irradiation extensively induced the overexpression of vitamin synthesis-related genes in ZJU9000. Of the 14 known genes related to vitamin E synthesis, 12 were up regulated, such as vte1, vte3 and vte4 (Fig. 6), which eventually exhibited enhanced light use efficiency and reproductive performance.35–37 The expression levels of ribD, bioF and fabG genes, which catalysed vitamin B2 and biotin biosynthesis, increased by 320%, 1131% and 164%, respectively (Table 1). These improvements promoted vitamin B2 and biotin formation and enhanced the final cell density.38Phylloquinone (vitamin K1) was a ubiquitous photosynthetic plant compound and functioned as a photosystem I-mediated electron transport cofactor. Menaquinone (vitamin K2) was an obligatory electron-transfer pathway component in bacteria.39 In ZJU9000, the expression level of the ubiE gene, which catalyses vitamin K1 and K2 synthesis (eqn (9) and (10)), increased by 107%. Thus, the mutant had increased the amount of synthesized vitamin K1 and K2 and exhibited an improved electron transport in its photosynthetic processes.
| 2-Phytyl-1,4-naphthoquinone + S-adenosyl-L-methionine → vitamin K1 + S-adenosyl-L-homocysteine | (9) |
| 2-Demethylmenaquinone + S-adenosyl-L-methionine → vitamin K2 + S-adenosyl-L-homocysteine | (10) |
Vitamins were important in the cellular activities of microalgae. Transcriptome sequencing proved that in our study, 60Co gamma-ray irradiation enhanced the synthesis of numerous vitamins in mutant cells, improved the photosynthetic efficiency and promoted cell proliferation.
3.6. Enhancing carbon concentration mechanism (CCM) in ZJU9000
Low CO2 concentrations impeded photosynthesis in most plants,40 and carbon concentration mechanism was vital in photosynthesis and facilitated carbon assimilation via the Calvin cycle.41As the experiment conditions were air bubbling (with 0.038 vol% CO2), CCM in the C4 pathway was activated. The carbon utilization efficiency of Arthrospira depended on the capacity of CCM. The expression of maeB gene, which catalysed the release of concentrated CO2 for cell usage (eqn (11)), increased by 120% in the carbon fixation pathway of ZJU9000 (Table 1). Gamma-ray irradiation enhanced CCM in ZJU9000, thus efficiently providing concentrated CO2 for cells and promoting CO2 biofixation.
| Malate + NAD(P)+ → pyruvate + CO2 + NAD(P)H + H+ | (11) |
4. Conclusions
High-throughput sequencing was used for the systematic analysis of pathway expression levels in wild type Arthrospira and ZJU9000. The purpose was to elucidate the improved growth phenotype of the mutant. The enhanced synthesis of key pigments and vitamins in ZJU9000 improved the photosynthesis of cells and accelerated cell growth. The increase in the amount of generated nucleotides and ATP provided genetic material and an energetic basis for rapid cell proliferation. The enhancement of CCM improved the utilization of CO2 at a low concentration (0.038 vol% in air). All factors jointly contributed to the robust growth of ZJU9000.Conflicts of interest
There are no conflicts to declare.Acknowledgements
This study is supported by National key R&D program-China (2016YFB0601003), National Natural Science Foundation–China (51476141).References
- A. Dufresne, M. Salanoubat, F. Partensky, F. Artiguenave, I. M. Axmann, V. Barbe, S. Duprat, M. Y. Galperin, E. V Koonin, F. Le Gall, K. S. Makarova, M. Ostrowski, S. Oztas, C. Robert, I. B. Rogozin, D. J. Scanlan, N. Tandeau de Marsac, J. Weissenbach, P. Wincker, Y. I. Wolf and W. R. Hess, Proc. Natl. Acad. Sci. U. S. A., 2003, 100, 10020–10025 CrossRef CAS PubMed.
- X. Zhang, X. Zhang, Y. Shiraiwa, Y. Mao, Z. Sui and J. Liu, Mar. Biotechnol., 2005, 7, 287–296 CrossRef CAS PubMed.
- M. G. De Morais, B. D. S. Vaz, E. G. De Morais and J. A. V. Costa, BioMed Res. Int., 2014, 762705, 1–9 Search PubMed.
- A. Vonshak, S. Laorawat, B. Bunnag and M. Tanticharoen, J. Appl. Phycol., 2014, 26, 1309–1315 CrossRef CAS.
- M. A. Borowitzka and A. Vonshak, Eur. J. Phycol., 2017, 52, 407–418 CrossRef CAS.
- A. Klanchui, C. Khannapho, A. Phodee, S. Cheevadhanarak and A. Meechai, BMC Syst. Biol., 2012, 6, 71 CrossRef CAS PubMed.
- J. Ying, J. Wang, H. Ji, C. Lin, R. Pan, L. Zhou, Y. Song, E. Zhang, P. Ren, J. Chen, Q. Liu, T. Xu, H. Yi, J. Li, Q. Bao, Y. Hu and P. Li, Gene, 2016, 585, 58–64 CrossRef CAS PubMed.
- M. Kanehisa, S. Goto, M. Hattori, K. Aoki-Kinoshita, M. Itoh, S. Kawashima, T. Katayama, M. Araki and M. Hirakawa, Nucleic Acids Res., 2006, 34, 354–357 CrossRef PubMed.
- H. Badri, P. Monsieurs, I. Coninx, R. Nauts, R. Wattiez and N. Leys, PLoS One, 2015, 10, 1–29 Search PubMed.
- J. Panyakampol, S. Cheevadhanarak, S. Sutheeworapong, J. Chaijaruwanich, J. Senachak, W. Siangdung, W. Jeamton, M. Tanticharoen and K. Paithoonrangsarid, Plant Cell Physiol., 2015, 56, 481–496 CrossRef CAS PubMed.
- H. Wang, X. Zhao, M. Lin, D. A. Randy, W. Chen, J. Zhou, C. Xu, C. Jin, Y. Xu, X. Wang, L. Ding and Q. Bao, PLoS One, 2013, 8, 1–23 CrossRef CAS.
- M. Esen and R. Ozturk Urek, Biotechnol. Appl. Biochem., 2015, 62, 275–286 CrossRef CAS PubMed.
- A. E.-F. Abomohra, W. El-Shouny, M. Sharaf and M. Abo-Eleneen, Braz. Arch. Biol. Technol., 2016, 59, 1–12 Search PubMed.
- J. Cheng, H. Lu, X. He, W. Yang, J. Zhou and K. Cen, Bioresour. Technol., 2017, 238, 650–656 CrossRef CAS PubMed.
- J. Pruvost, G. Van Vooren, B. Le Gouic, A. Couzinet-Mossion and J. Legrand, Bioresour. Technol., 2011, 102, 150–158 CrossRef CAS PubMed.
- G. M. Lima, P. C. N. Teixeira, C. M. L. L. Teixeira, D. Filócomo and C. L. S. Lage, Algal Res., 2018, 31, 157–166 CrossRef.
- J. D. H. Strickland and T. R. Parsons, A Practical Handbook of Seawater Analysis: Pigment analysis, Bulletin of Fisheries Research Board of Canada, 2nd edn, 1972, vol. 167 Search PubMed.
- H. H. Abdi, Encyclopedia of Measurement and Statistics, 2007, vol. 1, pp. 1–9 Search PubMed.
- A. C. Guedes, H. M. Amaro and F. X. Malcata, Mar. Drugs, 2011, 9, 625–644 CrossRef CAS PubMed.
- R. Pangestuti and S. K. Kim, J. Funct. Foods, 2011, 3, 255–266 CrossRef CAS.
- G. Mackinney, J. Biol. Chem., 1941, 140, 315–322 CAS.
- G. P. Gibson and R. J. Taylor, Analyst, 1945, 70, 449–457 RSC.
- E. E. Jacobs and A. S. Holt, J. Chem. Phys., 1954, 22, 142 Search PubMed.
- E. M. Torres, T. Sokolsky, C. M. Tucker, L. Y. Chan, M. Boselli, M. J. Dunham and A. Amon, Science, 2007, 317, 916–924 CrossRef CAS PubMed.
- Z. Ding, Y. Zhang, Y. Xiao, F. Liu, M. Wang, X. Zhu, P. Liu, Q. Sun, W. Wang, M. Peng, T. Brutnell and P. Li, Sci. Rep., 2016, 6, 31673 CrossRef CAS PubMed.
- B. Buchanan, W. Gruissem and R. Jones, Biochemistry and Molecular Biology of Plants, American Society of Plant Biologists, Wiley Blackwell, Rockville, MD, 2nd edn., 2015 Search PubMed.
- R. E. Paull, N. J. Chen, R. Ming, C. M. Wai, N. Shirley, J. Schwerdt and V. Bulone, Trop. Plant Biol., 2016, 9, 200–213 CrossRef CAS.
- D. Ultrastruktur and M. Jost, Arch. Microbiol., 1965, 50, 211–245 Search PubMed.
- G. Weise, G. Drews, B. Jann and K. Jann, Arch. Mikrobiol., 1970, 71, 89–98 CAS.
- J. F. Turner and D. H. Turner, Biochem. Plants, 1980, 2, 279–316 CAS.
- A. R. Fernie, F. Carrari and L. J. Sweetlove, Curr. Opin. Plant Biol., 2004, 7, 254–261 CrossRef CAS PubMed.
- H. David and H. Nigel, Instant Notes in Biochemistry, BIOS scientific, oxford, 3rd edn, 2005 Search PubMed.
- M. M. C. Wamelink, E. A. Struys, J. H. J. Huck, B. Roos, M. S. Van Der Knaap, C. Jakobs and N. M. Verhoeven, J. Chromatogr. B: Anal. Technol. Biomed. Life Sci., 2005, 823, 18–25 CrossRef CAS PubMed.
- R. L. Berens, E. C. Krug and J. J. Marr, Biochem. Mol. Biol. Parasites, 1995, 89–117 CAS.
- Y. Durmaz, Aquaculture, 2007, 272, 717–722 CrossRef CAS.
- E. C. Carballo-Cardenas, P. M. Tuan, M. Janssen and R. H. Wijffels, Biomol. Eng., 2003, 20, 139–147 CrossRef CAS PubMed.
- A. Azzi and A. Stocker, Prog. Lipid Res., 2000, 39, 231–255 CrossRef CAS PubMed.
- K. Kaewpintong, A. Shotipruk, S. Powtongsook and P. Pavasant, Bioresour. Technol., 2007, 98, 288–295 CrossRef CAS PubMed.
- M. Kurosu and E. Begari, Molecules, 2010, 15, 1531–1553 CrossRef CAS PubMed.
- N. Jungnick, Y. Ma, B. Mukherjee, J. C. Cronan, D. J. Speed, S. M. Laborde, D. J. Longstreth and J. V. Moroney, Photosynth. Res., 2014, 121, 159–173 CrossRef CAS PubMed.
- R. Ramanan, N. Vinayagamoorthy, S. D. Sivanesan, K. Kannan and T. Chakrabarti, Algae, 2012, 27, 295–301 CrossRef CAS.
Footnote |
| † Electronic supplementary information (ESI) available. See DOI: 10.1039/c8ra01626g |
| This journal is © The Royal Society of Chemistry 2018 |


