 Open Access Article
Dinuclear molecular magnets with unblocked magnetic connectivity: magnetocaloric effect†
Magdalena Fitta *a,
Robert Pełkaa,
Wojciech Sasab,
Dawid Pinkowicz
 c and
Barbara Siekluckac
aInstitute of Nuclear Physics Polish Academy of Sciences, 31-342 Kraków, Poland
bAGH University of Science and Technology, Faculty of Physics and Applied Computer Science, Department of Solid State Physics, al. A. Mickiewicza 30, Krakow 30-059, Poland
cFaculty of Chemistry, Jagiellonian University, 30-060 Kraków, Poland. E-mail: Magdalena.Fitta@ifj.edu.pl
First published on 18th April 2018
Abstract
A detailed study of the magnetocaloric effect in two isostructural bimetallic compounds {[MII(H2O)2]2[NbIV(CN)8]·4H2O}n (M = Mn, Fe) is presented. The substances show sharp phase transitions to the long-range magnetically ordered state with ferromagnetic coupling between M and Nb sublattices in the case of the Fe-based sample (FeNb, Tc = 43 K) and antiferromagnetic coupling for the Mn-based sample (MnNb, Tc = 50 K). The magnetic entropy change was found to reach 5.07 J mol−1 K−1 (9.09 J kg−1 K−1) for MnNb and 4.82 J mol−1 K−1 (8.65 J kg−1 K−1) for FeNb under the applied magnetic field change of 5 T. Isothermal entropy changes corresponding to different field changes are demonstrated to collapse on a single master curve, which confirms the magnetic transitions in FeNb and MnNb to be of the second order. The results obtained for FeNb and MnNb are discussed in the context of MCE tunability by un/blocking of magnetic connectivity through dis/reconnection of spatially extended ligands.
Introduction
In the last few years, there has been a significant interest in the study of magnetocaloric effect (MCE) motivated by a possibility of applying this effect in magnetic refrigeration.1–3 MCE is defined as heating or cooling of a material due to the application or the removal of a magnetic field. A measure of MCE is the isothermal entropy change ΔS or/and the adiabatic temperature change ΔTad on applying or withdrawing the magnetic field ΔH. Among conventional magnets, systems like Gd5(Si,Ge)4,4 MnFe(P,As) alloys5 or La[Fe(Si,Al)]13 family6 are regarded as the most suitable candidates for magnetic refrigeration in the room temperature range. On the other hand, in the field of molecular magnetism, one finds high-spin molecular clusters as promising materials for refrigeration at the ultra-low temperature range7–11 or, as the very recent developments show, one tries to make use of intrinsic magnetic anisotropy of some compounds to obtain a substantial rotating magnetocaloric effect (RMCE) offering certain technological improvements.12–15 The study of MCE in molecular magnets showing a phase transition to the long-range magnetically ordered state are relatively less explored mainly because of unremarkable values of magnetic entropy change. However, the investigation of MCE is also important from the fundamental point of view, as its dependence on temperature and magnetic field change represents the unique characteristic of a material correlated with its critical behaviour.The first studies of MCE driven by the transition to the long-range magnetically ordered phase dealt with Prussian blue analogues.16–18 Recently, we have presented several examples of the MCE studies for the compounds based on octacyanidometalates, where a special attention was paid to the family of ferrimagnets Mn2–L–[Nb(CN)8] (L = ligand: pyrazole, pyridazine, imidazole).19–21 Depending on the bridging ligand or the influence of external stimuli such as external pressure or hydration/dehydration process, these compounds show ordering temperatures within the broad Tc range: 24–98 K. Comparing the maximum entropy change |ΔS|max against the ordering temperature for this compound series we proved its Tc−2/3 dependence. Because MCE is an intrinsic thermodynamic property, its magnitude and dependence on the magnetic field should be related to other magnetic characteristics of the material. In ref. 22 the MCE data were used to investigate the critical behaviour of ferro- and ferrimagnetic molecular materials.
Herein, we report a successive study of MCE in two isostructural bimetallic compounds {[MII(H2O)2]2[NbIV(CN)8]·4H2O}n (M = Mn, Fe). The trials to synthesize their analogues with M = Co and Ni were all unsuccessful resulting repeatedly in samples unstable under ambient conditions. {[MnII(H2O)2]2[NbIV(CN)8]·4H2O}n (MnNb) and {[FeII(H2O)2]2[NbIV(CN)8]·4H2O}n (FeNb) crystallize in the same tetragonal space group I4/m. In both compounds, octacyanoniobate(IV) anions are connected via CN− ligands with the MII cations, forming a 3D coordination framework (Fig. 1). Each Nb centre is connected to four MII and each MII is connected to four Nb centres. Despite the same structure these compounds show different magnetic properties. FeNb is a soft ferromagnet with Tc = 43 K, while the Mn-based compound orders ferrimagnetically below 50 K.
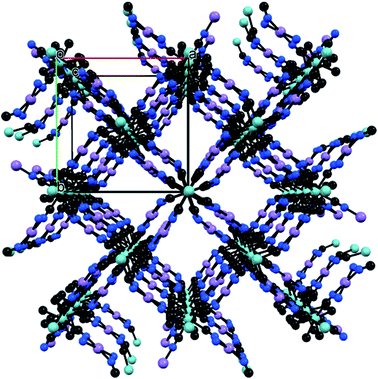 | ||
| Fig. 1 Three-dimensional NbIV–CN–MII coordination framework topology of MnNb and FeNb. NbIV – cyan, MII – pink, C – black, N – blue. O and H atoms are omitted for the sake of clarity. | ||
Experimental details
Synthesis of {[MII(H2O)2]2[NbIV(CN)8]·4H2O}n (M = Mn, Fe) and the structural data have been already reported elsewhere.23,24 Magnetic measurements were carried out with the MPMS magnetometer. Isothermal magnetization curves recorded up to 5 T were measured at temperatures ranging from 30 K up to 65 K.Results and discussion
Magnetic properties
The temperature dependence of the real component of the AC susceptibility χac(T) of MnNb and FeNb was measured with the frequency of 125 Hz and the amplitude of the oscillating field was equal to 3 Oe. For both compounds χac(T) shows sharp peaks upon cooling, which indicates the transition to the long-range ordered state. The critical temperatures determined from the minimum of the derivative are Tc = 43 K and 50 K for FeNb and MnNb respectively Fig. 2(a).
The magnetization measured for MnNb at T = 2 K increases rapidly and reaches the saturation value of 9 μB at 5 T. The expected value of magnetization of saturation for the compound with two MnII ions (S = 5/2, g = 2) and one NbIV ion (S = 1/2, g = 2) coupled antiferromagnetically is 9 μB. This confirms that MnNb is a ferrimagnet with the magnetic moment of the Nb ion oriented antiparallel to the moments of the two Mn ions.
In the case of the FeNb sample the magnetization does dot saturate attaining the value of 8.5 μB at 5 T. The estimated value of magnetization at saturation (=9.46 μB) was calculated from the limit of the M = f(H−1) function as H−1 tends to zero (see Fig. S5†). The expected value of Msat for two FeII ions (S = 2, g = 2.2) and one NbIV ion (S = 1/2, g = 2) coupled ferromagnetically is 9.8 μB, which corroborates the ferromagnetic character of the NbIV–FeII coupling. The hysteresis loop is observed only for FeNb with coercive field HC = 145 Oe (Fig. 2(b))
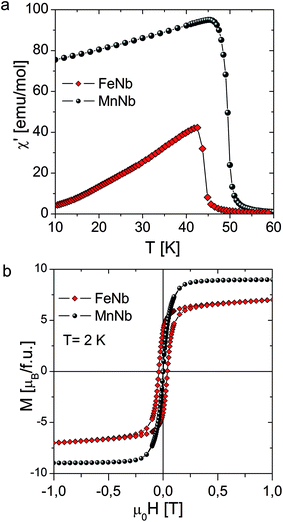 | ||
| Fig. 2 (a) Temperature dependence of the in-phase ac susceptibility for FeNb and MnNb. (b) Magnetization vs. field measured at 2 K for FeNb and MnNb. | ||
Magnetocaloric effect
To evaluate the magnetocaloric effect (MCE) of a magnetic material displaying the second-order phase transition the isothermal magnetic entropy change (ΔSM) can reliably be calculated via the Maxwell relation:
 | (1) |
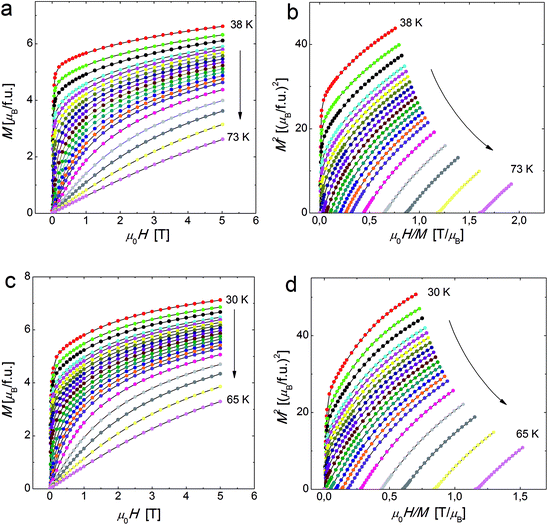 | ||
| Fig. 3 Magnetization versus field isotherm measured at temperatures in the vicinity of Tc for MnNb (a) and FeNb (c). The Arrott plots (M2 vs. H/M) at the vicinity of Tc for MnNb (b) and FeNb (d). | ||
The temperature dependence of |ΔS| for magnetic field change from 0.5 to 5 T are presented in Fig. 4a and b. It can be observed that the magnitude of ΔS increases with an increase in the applied magnetic field and the magnetic entropy change reaches maximal value near Tc: 45 K for FeNb and 50 K for MnNb. The maximum values of |ΔS| are found to be 4.82 J mol−1 K−1 (8.65 J kg−1 K−1) and 5.07 J mol−1 K−1 (9.09 J kg−1 K−1) for the field change of 0–5 T for FeNb and MnNb, respectively.
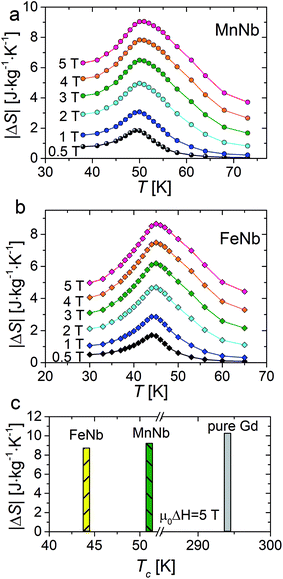 | ||
| Fig. 4 The temperature dependence of magnetic entropy change recorded in various magnetic fields (0.5 – 5 T) for MnNb (a) and FeNb (b). Comparative histograms of |ΔS| values obtained for FeNb, MnNb and pure gadolinium25 in the applied field of 5 T (c). | ||
The magnitude of magnetocaloric effect in a magnetic system depends on type of magnetic interaction, presence of magnetic anisotropy, magnetic density and constituent spin values. Therefore, through the control of these parameters in a given structure one can tune the magnitude of magnetic entropy change. The replacement of Fe by Mn in the {[MII(H2O)2]2[NbIV(CN)8]·4H2O}n structure brings about the increase in |ΔS|max as well as in the temperature where the maximum value of the entropy change occurs. Slightly higher values of |ΔS|max observed for MnNb is may be related to the spin value of the MnII ion (SMn = 5/2) being higher than that of the FeII ion (SFe = 2). Besides, the MnII ion is devoid of any intrinsic magnetic anisotropy, which corresponds to the half-full filling of the 3d orbital (3d5 electronic configuration) preventing any orbital contribution in its ground state. At the same time, the orbital contribution may not be fully quenched by the crystal field in the case of the FeII ion (3d6 electronic configuration) leading to a material magnetocrystalline anisotropy.
Much larger differences in the values of |ΔS|max were observed for the isostructural series of {[MII(pyrazole)4]2[NbIV(CN)8]·4H2O}n, where M = Mn, Fe, and pyrazole is the 5-membered C3H4N2 ring ligand.22,26 The exchange coupling in both compounds is of antiferromagnetic character triggering off transitions to long-range ferrimagnetically ordered phases at 23.8 K and 7.8 K for M = Mn and Fe, respectively. In this case the value of |ΔS|max = 4.9 J mol−1 K−1 (4.8 J kg−1 K−1) detected for the Fe-based compound is again apparently lower than that observed for the Mn-based sample 6.7 J mol−1 K−1 (6.5 J kg−1 K−1) Table 1Link as table 1. The presence of the pyrazole ligand in this family of molecular magnets works as a steric factor blocking the magnetic connectivity of the constituent ions. They crystallize in the tetragonal space group I41/a with the structure consisting of a 3D skeleton, where each NbIV center is linked through the cyanido bridges NbIV–CN–MII to four MII ions, whereas each MII center is bridged to only two NbIV ions. The remaining part of the six-membered coordination sphere of FeII is filled with pyrazole molecules, while the NbIV ion coordinates further four terminal CN− ligands. It is the removal of the pyrazole ligand from the synthetic procedure that leads to the crystallization of the studied compounds with the number of the MII–NC–NbIV linkages twice as large as in the pyrazole containing analogues. This substantial enhancement of magnetic connectivity gives rise to two effects. Firstly, the transition points of the studied samples are considerably shifted toward higher temperatures (by 25–35 K). Secondly, the magnitude of MCE (ΔS in J kg−1 K−1) of the pyrazole-free compounds is significantly higher than that of their pyrazole containing counterparts, which is related to the increased magnetic density of the compounds with unblocked magnetic connectivity, see Fig. 5. Let us note that at the same time the molar MCE quantities (ΔS in J mol−1 K−1) display the reverse order with smaller differences: 5.07 J mol−1 K−1 against 6.7 J mol−1 K−1 for the Mn-based compounds, and 4.82 J mol−1 K−1 against 4.9 J mol−1 K−1 for the Fe-based compounds. This can be understood by remembering that for the same number of M2Nb (M = Mn, Fe) units the magnitude of ΔS is expected to be attenuated with increasing temperature.
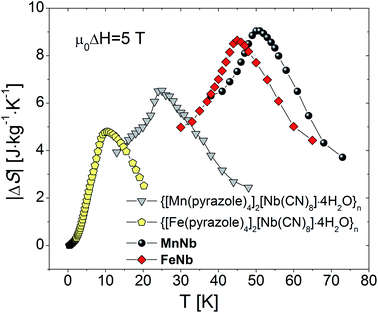 | ||
| Fig. 5 Magnetic entropy change of MnNb, FeNb and {[MII(pyrazole)4]2[NbIV(CN)8]·4H2O}n (M = Mn, Fe) determined for magnetic field change from 0 to 5 T. | ||
The value of |ΔS|max determined for MnNb matches quite well the trend displayed by the recently published results of MCE obtained for the ligand-tuned ferrimagnetic Mn2–L–[Nb(CN)8] (L = ligand) networks. Depending on the bridging ligand as well as external stimuli such as dehydration or external pressure, the critical temperature of the compound changes from 24 K to 98 K. As it was predicted by Oesterreicher and Parker for the compounds with the same spin content and different critical temperatures, the decrease in |ΔS|max (in J mol−1 K−1) should be consistent with |ΔS|max ∼ Tc−2/3 for increasing Tc.27 Fig. S6† shows the comparison of MCE data obtained for MnNb and other Mn2–L–[Nb(CN)8] compounds where Tc−2/3 dependence of the maximum entropy change has been confirmed for this series.
A useful parameter which quantifies the efficiency of a magnetocaloric material is the relative cooling power (RCP). RCP corresponds to the amount of heat that can be transferred between the cold and hot reservoirs in one ideal thermodynamic cycle. It can be calculated by integrating the |ΔS|(T) curve over the full width at half maximum:
 | (2) |
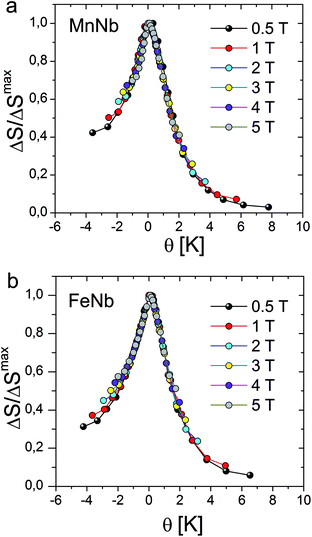
Recently, the universal curve of magnetic entropy change has been developed and successfully applied to determine an order of phase transition in some materials.28,29 For materials undergoing the second-order phase transition, ΔS(T) curves measured with different applied fields were argued to collapse into a single master curve. The phenomenological universal curve can be constructed by normalizing all the ΔS(T) curves using their maximum value ΔSmax and, subsequently, re-scaling the temperature axis independently below and above the critical temperature. The new reduced temperature variable θ is defined by the following expression:
 | (3) |
Let us note, see Fig. 6, that all the rescaled ΔS(T) curves neatly collapse on one master curve in a wide temperature range, corroborating the second order magnetic phase transition in the ferromagnetic FeNb as well as in the ferrimagnetic MnNb. The order of the magnetic phase transition can be also tested by an analysis of the Arrott plots. According to the Banerjee criterion,30 a positive slope of the M2 versus H/M curves indicates a magnetic phase transition to be of the second order, while a negative slope corresponds to the first order phase transition. The positive slope of the curves presented in Fig. 3b and d is consistent with the universal scaling of the ΔS(T) curves.
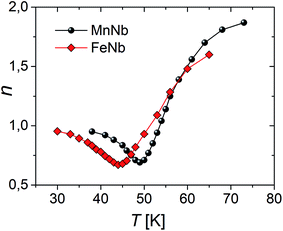
Concerning the magnetic-field dependence of the magnetic entropy changes it has been found that this dependence can be expressed by a power law |ΔS|(T,H)∝Hn where n is related to the magnetic state of a sample. Fig. 7 shows the temperature dependence of the field-averaged exponent n for the studied compounds estimated on the basis of the data in Fig. 4a and b. The power law relation, proposed in the literature28 for materials with the second order phase transition in general anticipates n = 1 and n = 2 for temperatures quite far below and above Tc. For both compounds the minimum of n is observed at T = Tc and is equal to 0.67 for FeNb and 0.69 for MnNb.
 ; |ΔS|max-maximum of magnetic entropy change determined for μ0ΔH = 5 T; nTc – critical exponent describing field dependence of ΔS at T = Tc
Summary and conclusion
In this work, we have carried out the comprehensive study of magnetocaloric effect in two structure related molecular magnets {[MII(H2O)2]2[NbIV(CN)8]·4H2O}n (M = Mn, Fe), where the Fe-based compound is a soft ferromagnet with Tc = 43 K, while the Mn-based sample orders ferrimagnetically below Tc = 50 K.The magnetocaloric effect was determined from the measurements of the field dependence of the magnetization at different temperatures. It was demonstrated that the replacement of Fe by Mn in {[MII(H2O)2]2[NbIV(CN)8]·4H2O}n brings about the increase in the |ΔS|max value as well as in the temperature where the maximum value of the entropy change occurs. The maximum values of the magnetic entropy change were found to amount to 4.82 J mol−1 K−1 and 5.07 J mol−1 K−1 at μ0ΔH = 5 T for FeNb and MnNb, respectively. Any significant differences were not noticed in the analysis of ΔS(T) master curves. For both compounds correct universal curves, typical for the magnetic transition of the second order, were obtained. The favourable influence of unblocking the magnetic connectivity on MCE was demonstrated through the comparison of the studied samples to the ligand containing compounds {[MII(pyrazole)4]2[NbIV(CN)8]·4H2O}n with M = Mn, Fe.
In summary, the relatively large values of the magnetocaloric effect and the values of RCP observed in the studied molecular magnets encourage to consider them as efficient refrigerants working in the low temperature regime.
Conflicts of interest
There are no conflicts to declare.Acknowledgements
This work was supported by the Polish National Science Centre within the frame of Project No. UMO-2011/03/D/ST5/05400.References
- J. Romero Gómez, R. Ferreiro Garcia, A. De Miguel Catoira and M. Romero Gómez, Renewable and Sustainable Energy Reviews, 2013, 17, 74 CrossRef.
- V. K. Pecharsky and K. A. Gschneidner Jr, J. Magn. Magn. Mater., 1999, 200, 44 CrossRef CAS.
- V. Franco, J. S. Blázquez, B. Ingale and A. Conde, Annu. Rev. Mater. Res., 2012, 42, 305 CrossRef CAS.
- V. K. Pecharsky and K. A. Gschneidner Jr, Phys. Rev. Lett., 1997, 78, 4494 CrossRef CAS.
- O. Tegus, E. Bruck, K. H. J. Buschow and F. R. de Boer, Nature, 2002, 415, 150 CrossRef CAS PubMed.
- B. G. Shen, J. R. Sun, F. X. Hu, H. W. Zhang and Z. H. Cheng, Adv. Mater., 2009, 21, 4545 CrossRef CAS.
- R. Sessoli, Angew. Chem., Int. Ed., 2012, 51, 43 CrossRef CAS PubMed.
- M. Evangelisti and E. K. Brechin, Dalton Trans., 2010, 39, 4672 RSC.
- J. W. Sharples, D. Collison, E. J. L. McInnes, J. Schnack, E. Palacios and M. Evangelisti, Nat. Commun., 2014, 5, 5321 CrossRef CAS PubMed.
- M. Gajewski, R. Pełka, M. Fitta, Y. Miyazaki, Y. Nakazawa, M. Bałanda, M. Reczyński, B. Nowicka and B. Sieklucka, J. Magn. Magn. Mater., 2016, 414, 25 CrossRef CAS.
- J. P. Zhao, R. Zhao, Q. Yang, B. W. Hu, F. Ch. Liu and X. H. Bu, Dalton Trans., 2013, 42, 14509 RSC.
- G. Lorusso, O. Roubeau and M. Evangelisti, Angew. Chem., Int. Ed., 2016, 55, 3360 CrossRef CAS PubMed.
- P. Konieczny, S. Chorąży, R. Pełka, K. Bednarek, T. Wasiutyński, S. Baran, B. Sieklucka and R. Podgajny, Inorg. Chem., 2017, 56, 7089 CrossRef CAS PubMed.
- P. Konieczny, Ł. Michalski, R. Podgajny, S. Chorąży, R. Pełka, D. Czernia, S. Buda, J. Mlynarski, B. Sieklucka and T. Wasiutyński, Inorg. Chem., 2017, 56, 2777 CrossRef CAS PubMed.
- P. Konieczny, R. Pełka, D. Czernia and R. Podgajny, Inorg. Chem., 2017, 56, 11971 CrossRef CAS PubMed.
- E. Manuel, M. Evangelisti, M. Affronte, M. Okubo, C. Train and M. Verdaguer, Phys. Rev. B: Condens. Matter Mater. Phys., 2006, 73, 172406 CrossRef.
- M. Evangelisti, E. Manuel, M. Affronte, M. Okubo, C. Train and M. Verdaguer, J. Magn. Magn. Mater., 2007, 316, e569 CrossRef CAS.
- S. M. Yusuf, A. Kumar and J. V. Yakhmi, Appl. Phys. Lett., 2009, 95, 182506 CrossRef.
- M. Fitta, R. Pełka, M. Gajewski, M. Mihalik, M. Zentkova, D. Pinkowicz, B. Sieklucka and M. Bałanda, J. Magn. Magn. Mater., 2015, 396, 1 CrossRef CAS.
- M. Fitta, M. Bałanda, R. Pełka, P. Konieczny, D. Pinkowicz and B. Sieklucka, J. Phys.: Condens. Matter, 2013, 25, 496012 CrossRef PubMed.
- M. Fitta, R. Pełka, M. Bałanda, M. Czapla, M. Mihalik, D. Pinkowicz, B. Sieklucka, T. Wasiutyński and M. Zentkova, Eur. J. Inorg. Chem., 2012, 3830 CrossRef CAS.
- M. Fitta, M. Bałanda, M. Mihalik, R. Pełka, D. Pinkowicz, B. Sieklucka and M. Zentkova, J. Phys.: Condens. Matter, 2012, 24, 506002 CrossRef PubMed.
- D. Pinkowicz, R. Podgajny, R. Pelka, W. Nitek, M. Balanda, M. Makarewicz, M. Czapla, J. Zukrowski, Cz. Kapusta, D. Zajac and B. Sieklucka, Dalton Trans., 2009, 7771 RSC.
- J. M. Herrera, P. Franz, R. Podgajny, M. Pilkington, M. Biner, S. Decurtins, H. Stoeckli-Evans, A. Neels, R. Garde, Y. Dromźee, M. Julve, B. Sieklucka, K. Hashimoto, S. Okhoshi and M. Verdaguer, C. R. Chim., 2008, 11, 1192 CrossRef CAS.
- K. A. Gschneidner, V. K. Pecharsky and A. O. Tsokol, Rep. Prog. Phys., 2005, 68, 1479 CrossRef CAS.
- R. Pełka, P. Konieczny, P. M. Zieliński, T. Wasiutyński, Y. Miyazaki, A. Inaba, D. Pinkowicz and B. Sieklucka, J. Magn. Magn. Mater., 2014, 354, 359 CrossRef.
- H. Oesterreicher and F. T. Parker, J. Appl. Phys., 1984, 55, 4334 CrossRef CAS.
- V. Franco, J. S. Bĺazquez and A. Conde, Appl. Phys. Lett., 2006, 89, 222512 CrossRef.
- V. Franco, A. Conde, J. M. Romero-Enrique and J. S. Bĺazquez, J. Phys.: Condens. Matter, 2008, 20, 285207 CrossRef.
- S. K. Banerjee, Phys. Lett., 1964, 12, 16 CrossRef.
Footnote |
| † Electronic supplementary information (ESI) available. See DOI: 10.1039/c8ra01609g |
| This journal is © The Royal Society of Chemistry 2018 |

