
 Open Access Article
 This Open Access Article is licensed under a Creative Commons Attribution-Non Commercial 3.0 Unported Licence
Molecular dynamics and the translational–rotational coupling of an ionically conducting glass-former: amlodipine besylate†
Safna Hussan K. P *a,
Mohamed Shahin Thayyila,
S. K. Deshpandeb,
Jinitha T. Vc,
Manoj Kd and
K. L. Ngaie
*a,
Mohamed Shahin Thayyila,
S. K. Deshpandeb,
Jinitha T. Vc,
Manoj Kd and
K. L. Ngaie
aDepartment of Physics, University of Calicut, Malappuram-673635, Kerala, India. E-mail: safna_dop@uoc.ac.in; safnahussain2@gmail.com
bUGC-DAE Consortium for Scientific Research, Mumbai Centre, BARC, Mumbai, 40085, India
cDepartment of Chemistry, University of Calicut, Malappuram-673635, Kerala, India
dCollege of Pharmaceutical Sciences, Govt. Medical College, Kozhikode-673008, Kerala, India
eCNR-IPCF, Largo Bruno Pontecorvo 3, I-56127, Pisa, Italy
First published on 6th June 2018
Abstract
We studied the conductivity relaxation originating from a glass-former composed of cations and anions, and the relation to the structural α-relaxation at temperatures above and below the glass transition temperature. The material chosen was amorphous amlodipine besylate (AMB), which is also a pharmaceutical with a complex chemical structure. Measurements were made using differential scanning calorimetry (DSC), broadband dielectric spectroscopy (BDS) and X-ray diffraction, and the characterization was assisted using density functional theory (DFT). The X-ray diffraction pattern confirms the amorphous nature of vitrified AMB. Both the ionic and dipolar aspects of the dynamics of AMB were examined using these measurements and were used to probe the nature of the secondary conductivity and dipolar relaxations and their relation to the conductivity α-relaxation and the structural α-relaxation. The coupling model predictions and quantum mechanical simulations were used side by side to reveal the properties and nature of the secondary conductivity relaxation and the secondary dipolar relaxation. Remarkably, the two secondary relaxations have the same relaxation times, and are one and the same process performing dual roles in conductivity and dipolar relaxations. This is caused by the translation–rotation coupling of the AMB molecule. Thus, AMB has both conductivity α- and β-relaxations, and application of the coupling model shows that these two relaxations are related in the same way as the structural α-relaxation and the Johari–Goldstein β-relaxation are. This important result has an impact on the fundamental understanding of the dynamics of ionic conductivity.
I. Introduction
The dynamics of glass-forming liquids and glass transition is currently considered to be an important unsolved problem in condensed matter physics and physical chemistry. Experimental and theoretical efforts in the past few decades have made some advances but a solution to the problem is still needed. Part of the difficulty encountered in solving the problem is the existence of a variety of glass-formers with widely different chemical composition and physical structures, which give rise to diverse thermodynamic and dynamic properties to be reckoned with. However, these diverse properties are beneficial in practical applications in many areas including ionic liquids, amorphous pharmaceuticals, biomolecules, biopolymers, metallic glasses, colloids etc. The synergy between basic research and research into the applications of glass-formers propels further studies of novel materials, and the research reported in this paper is such an example. The glass-former studied is an ionically conducting material as well as a pharmaceutical.The molecular dynamics of glass-forming materials composed of cations and anions are interesting because of the presence of not only the structural relaxation responsible for glass transition and viscous flow, but also the ionic conductivity relaxation.1–6 The properties of the two kinds of relaxation are of current interest to the two corresponding research communities. If found, any relation between the two relaxations would considerably enrich the fundamental understanding of the dynamics. With this in mind, we studied an ionically conducting glass-former, amlodipine besylate (AMB), which is also a pharmaceutical for the treatment of hypertension in a similar way to nifedipine.7,8
In pharmaceutical applications9 of amorphous AMB, an important concern is crystallization. We have already reported the recrystallization tendencies of amorphous AMB in neat form during one month of storage at room temperature. Improved physical stability was achieved via the preparation of a binary formulation of AMB with the biocompatible excipient PVP K30.10 Notwithstanding, the present study of the molecular and ionic mobility in amorphous AMB will have a benefit in identifying the factors that govern devitrification in both the supercooled and glassy states. Thus our present study also is of interest to the pharmaceutical research community.
Even though the molecular relaxations responsible for crystallization vary from case to case, the molecular motion responsible for β-relaxation11–13 is one of the governing factors for recrystallization in many amorphous pharmaceuticals.14 Hence the study of the secondary dipolar and secondary ionic conductivity relaxations, and their connection to the primary relaxations, is relevant and important to several research communities.
The aim of the present work is to gain a better insight into the molecular and ionic dynamics of AMB with the use of various experimental methods. These include differential scanning calorimetry (DSC) and broadband dielectric spectroscopy (BDS) in the glassy and the supercooled liquid states. The measurements enable us to assess the glass-forming abilities and dynamic properties (such as fragility and non-exponentiality) of the primary α-relaxation and the secondary dipolar and conductivity relaxations, as well as the relation between the structural relaxation and ionic conductivity relaxation in their properties. Computational calculations were also carried out to gain a better understanding of the relaxation processes in AMB. The results are of interest to the conductivity relaxation and glass transition communities because novel properties are encountered in this study.
II. Experimental section
Materials
Amlodipine besylate, a white crystalline powder with a diamond shape and a molecular weight of 567.1 g mol−1, was purchased from Alfa Aesar with 99.8% purity. It is a calcium antagonist and is chemically known as 3-ethyl-5-methyl-(4RS)-2-[(2-aminoethoxy) methyl]-4-(2-chlorophenyl)-6-methyl-1,4-dihydropyridine-3,5-dicarboxylate benzene sulphonate. It was used without further purification.Methods
III. Results and discussion
Geometry
The distinctly complex structure of AMB was optimised using density functional theory with the B3LYP/6311-G++ level of theory. The quantum computational calculations predicted the stable structure of AMB and revealed its polar nature due to the presence of electropositive amlodipine cations with electronegative besylate anions. The optimised geometry, along with the electron densities in the molecular electrostatic potential map, is shown in Fig. 1 (ref. 18) as has been reported for other ionic liquids.17,20,21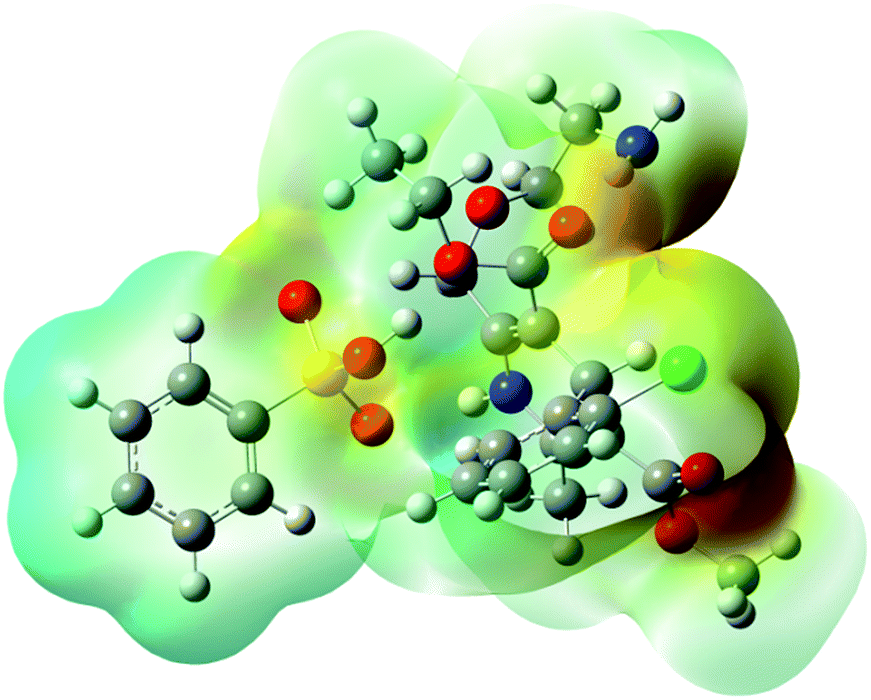 | ||
| Fig. 1 The chemical three-dimensional structure of amlodipine besylate. Electron densities are presented to allow for comparison of the sizes of the ions. The red colour indicates the electronegative area while the blue colour indicates the electropositive region of AMB. | ||
XRD pattern
As can be seen from the X-ray diffraction patterns in Fig. 2, the crystalline structure of pure AMB reported previously in the patent of Ettema22 et al. is confirmed via the prominent characteristic peaks at diffraction angles of 5.8, 11.6, and 13.0° (2θ) corresponding to the (002), (004), and (023) planes respectively. Meanwhile, the patterns of the AMB forms prepared via quench cooling exhibited a characteristic “amorphous halo” devoid of any sharp diffraction peaks.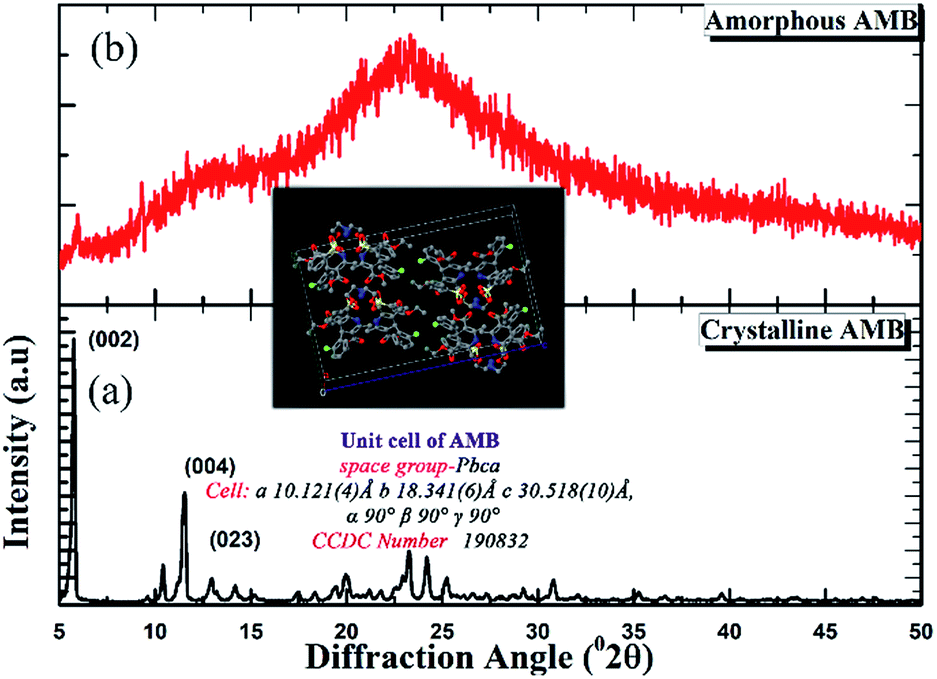 | ||
| Fig. 2 XRD patterns of (a) pure crystalline AMB and (b) vitrified AMB after quench cooling. | ||
Thermal properties
The DSC thermogram of crystalline AMB upon heating (10 K min−1), as depicted in Fig. 3, shows an endothermic peak at 477 K corresponding to the melting of the sample, whereas amorphous AMB prepared via quench cooling presents its glass transition at 318 K.1,21,23–25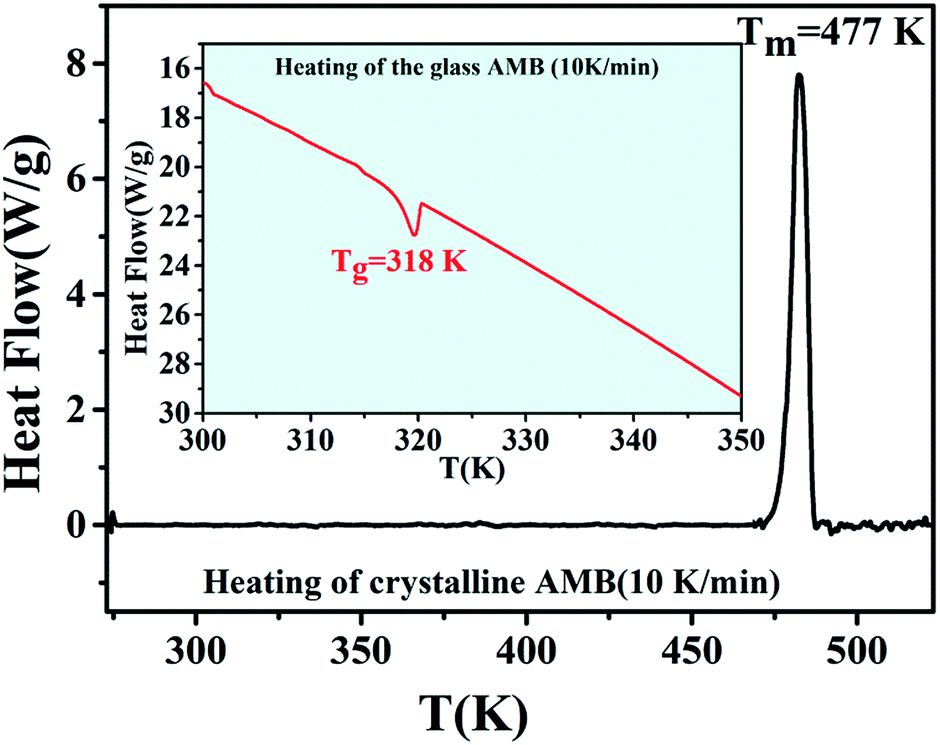 | ||
| Fig. 3 DSC thermogram of AMB obtained during the melting of the crystalline form (heating rate 10 K min−1). The inset shows the glass transition temperature of amorphous AMB. | ||
Molecular dynamics
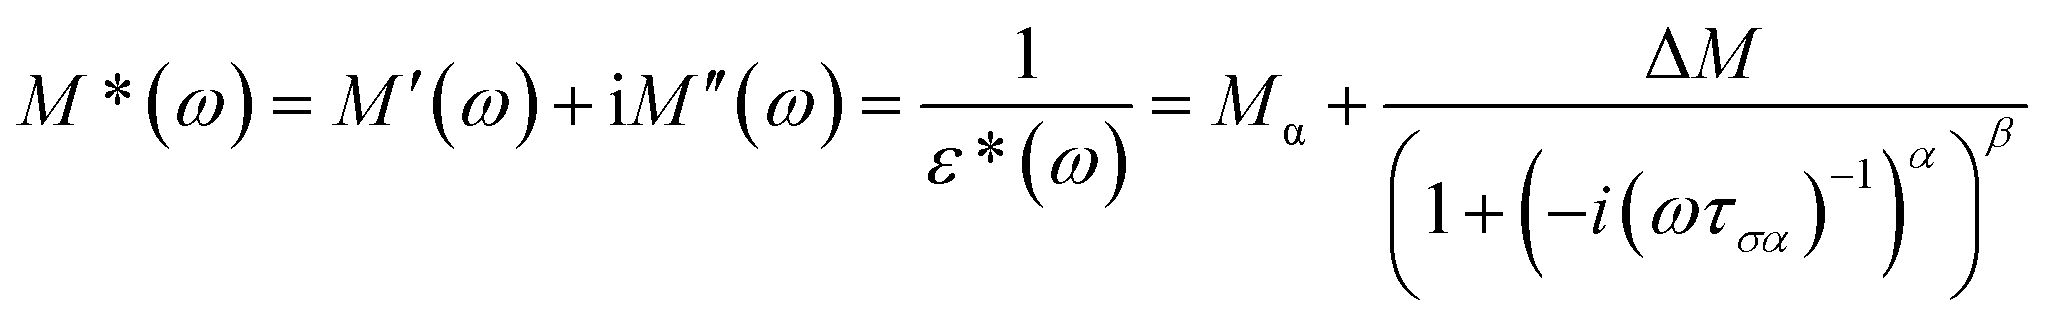
The molecular mobility of AMB in the glassy and supercooled states was studied using BDS to provide detailed experimental evidence of the dynamics of glass transition beyond DSC. The isothermal dielectric measurements of AMB at ambient pressure were obtained from the temperature of the deep glassy state (203 K) to temperatures near the melting point (473 K) in a wide frequency window from 10−1 to 107 Hz. The dielectric loss of AMB over wide temperatures from the deep glassy to supercooled liquid states is shown in Fig. S1.† It was found that the spectra for all temperatures were dominated by ion conductivity relaxation due to the hopping of ions, especially the amlodipine cation and the besylate anion in AMB, making it impossible to observe the structural relaxation in the dielectric susceptibility. Even though the dielectric measurements can be represented by different frequency dependent complex quantities like the permittivity, ε*(f) = ε′(f) − iε′′(f), the conductivity, σ*(f) = σ′(f) + iσ′′(f), and the electric modulus, M*(f) ≡ 1/ε*(f) = M′(f) + iM′′(f), all of them are equivalent.26,27 Following standard practice and in a similar way to what has been done before for ionic liquids, we considered data in the electric modulus representation, as shown in Fig. 4.1,26,28–38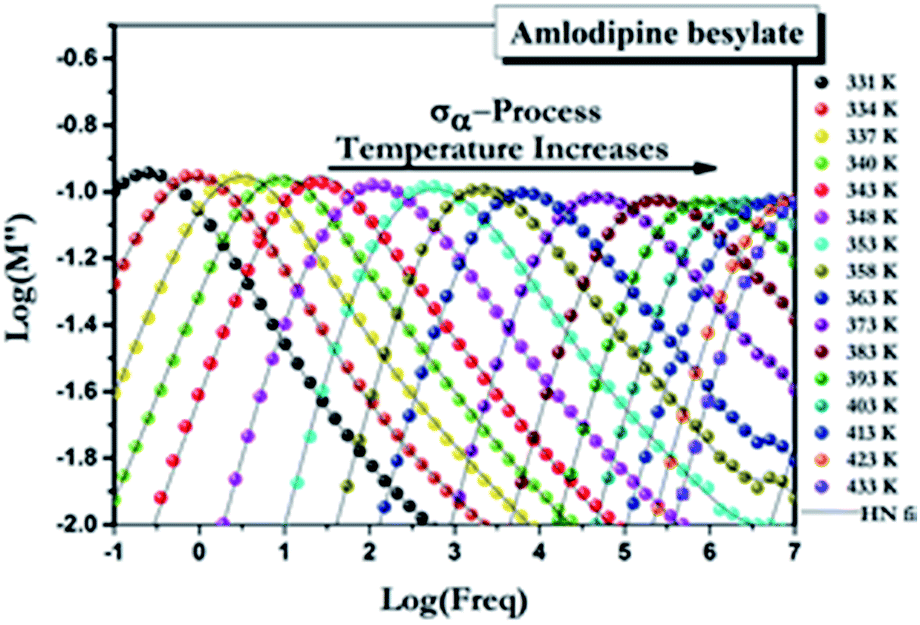 | ||
| Fig. 4 Electric modulus spectra for AMB at ambient pressure collected at temperatures above the glass transition temperature. | ||
The temperature dependence of the α-conductivity relaxation time, the dispersion parameters, and the dc conductivity term at various temperatures were obtained from the fit of the experimental M′′(f) data using the Havriliak–Negami function.6
 | (1) |
In order to study the dependence of the α-conductivity loss peak shape on temperature, the data taken at various temperatures from 337 K to 473 K were shifted to overlap with 343 K after normalizing the peak heights to unity,1,26,29–36 and are shown in Fig. S2.† The trend of the decrease of the full-width at half-maximum (FWHM) of the M′′(f) loss peak with an increase in temperature is evident.
To characterize the nonexponential character of the conductivity relaxation, the M′′(f) loss peaks were fitted using the one-sided Fourier transform of the Kohlrausch–Williams–Watts (KWW)1,25,26,29–36 function,
 | (2) |
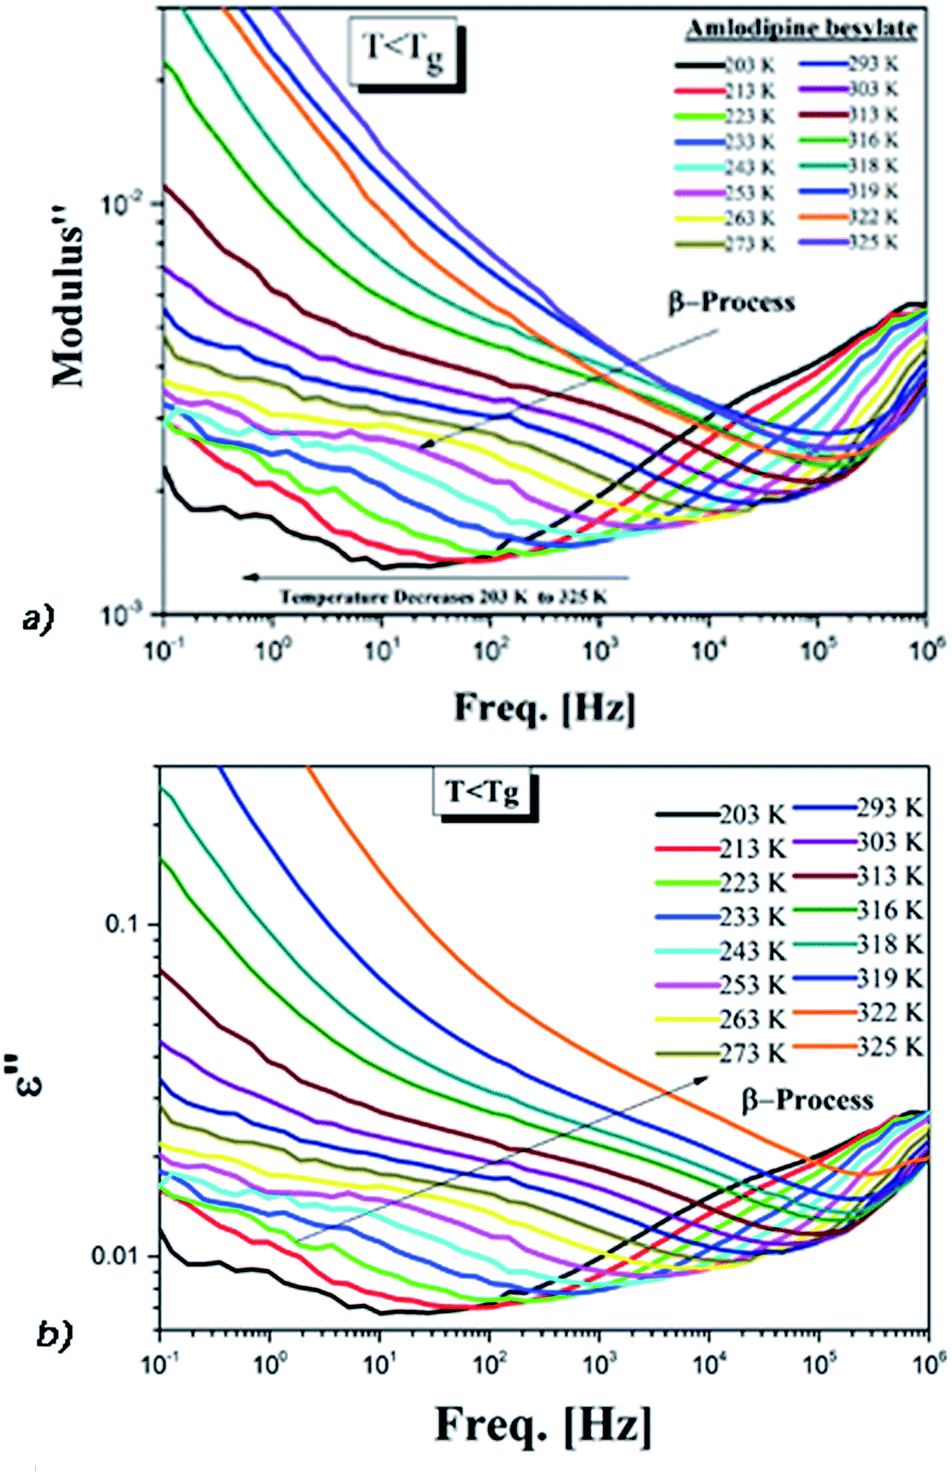 | ||
| Fig. 5 (a) Secondary conductivity relaxation of AMB in the electric modulus. (b) The dielectric spectra of AMB below Tg for the same temperatures. | ||
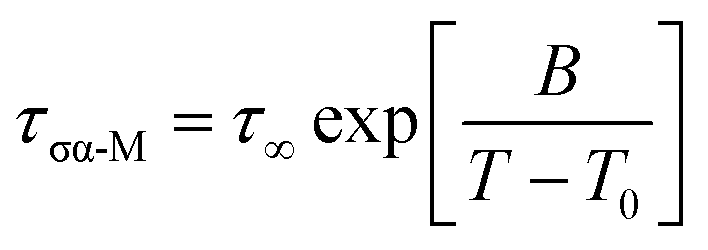
The dependence of the α-conductivity relaxation time on temperature for neat AMB follows the time honoured Vogel–Fulcher–Tammann (VFT) expression,
 | (3) |
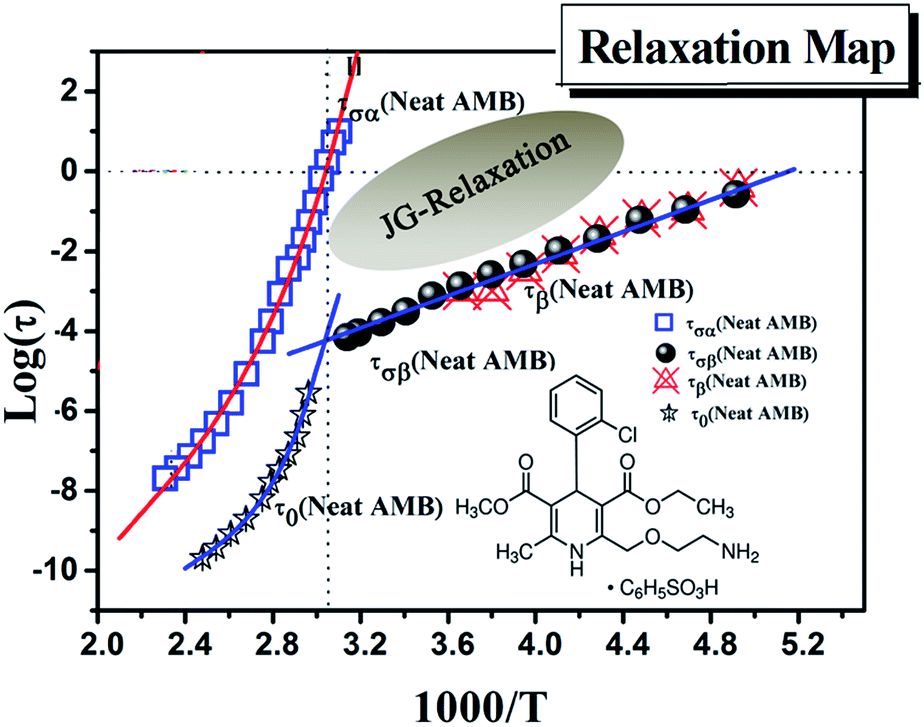 | ||
| Fig. 6 Relaxation map obtained for neat AMB. All three processes including the α-conductivity relaxation and the secondary relaxation are indicated together with the calculated primitive relaxation times obtained from the coupling model prediction. | ||
The temperature dependence of the relaxation time of the β-process can be described using the Arrhenius equation
 | (4) |
Only one well resolved secondary relaxation is observed below the glass transition temperature, which is detected either as a dipolar rotation in dielectric susceptibility or as an ion conductivity relaxation in the electric modulus. Interestingly, the secondary dipolar and conductivity relaxation times calculated in both scenarios superimpose perfectly, as is clearly seen in Fig. 6. These properties suggest the presence of a strong translation–rotation coupling of the molecules, leading to equivalent secondary conductivity and dipolar relaxation times. The latter can be considered as the Johari–Goldstein (JG) β-relaxation relating to the dipolar structural α-relaxation, which is supposed to be a universal feature of glass-forming systems of all kinds.38,44 While the secondary conductivity relaxation is the precursor of the conductivity α-relaxation, an analogue of the relation of the JG β-relaxation to the structural α-relaxation has been found before in an ionic liquid.39 The fitting parameters of the VFT and the value of Tg obtained from BDS, as well as from DSC, have already been reported by Safna et al.10 Here, we focus more on the origin of the secondary relaxation found in AMB, and so the fitting parameters of the Arrhenius equations are tabulated in Table 1. In passing, it is worth pointing out that the translation–rotation coupling has been found before from the fact that the same α-conductivity relaxation and α-dipolar relaxation have the same relaxation time and frequency dispersion in two ionic liquids, which was studied using light scattering and dielectric spectroscopy by Pabst et al.45
| Sample | β-Process, Arrhenius | ||
|---|---|---|---|
| log(ta) | Ea (kJ mol−1) | Ea (barrier) (kJ mol−1) | |
| AMB | 10.41 ± 0.2 | 38.9 ± 0.05 | 33.0 ± 5.0 |
However, the possibility of an intramolecular secondary relaxation due to the presence of a dihedral side chain with amine groups cannot be excluded. To resolve the issue and confirm the presence of the secondary conductivity relaxation, we used the Coupling Model (CM).15,25,26,36,46 Originally, the CM was applied to secondary relaxations having properties strongly connected to the structural α-relaxation. The existence and universal presence of this kind of secondary relaxation, called the Johari–Goldstein (JG) β-relaxation, was suggested by its analogy to the primitive relaxation of the CM, which started in a paper47 in 1998, and has since been extensively developed.25,48–53 The CM54 has the following exact relation between the primitive relaxation time τ0 and the α-relaxation time τα,
| τα = (tc−nτ0)1−n | (5) |
The CM equation is generally applicable to relaxation and diffusion in all interacting systems,54 including not only structural relaxation but also ion conductivity relaxation because the molecules or ions are densely populated and interacting in both cases. For this reason, the CM also has long since been applied successfully to the ion conductivity relaxation of crystalline, glassy and molten ionic conductors.15,25,26,36,46 There is also the CM equation relating the conductivity α-relaxation time τσα(T) to the conductivity primitive relaxation time τσ0(T), which is
| τσα = (tc−nστσ0)1−nσ | (6) |
We have determined the τσβ(T) of AMB at temperatures below Tg from the electric modulus data in Fig. 5a and the plot is shown in Fig. 6, together with the line fitting the Arrhenius temperature dependence. Also shown in Fig. 6 are the values of τσ0(T) calculated from the experimental values of τσα(T) above Tg using the CM equation, and the line is the fit to the temperature dependence of τσ0(T) using the Vogel–Fulcher law. By extrapolating the Arrhenius dependence of τσβ(T) and the Vogel–Fulcher dependence of τσ0(T) both towards Tg, as done in Fig. 6, we verify the approximate agreement between τσ0(Tg) and τσβ(Tg), and thus confirm that the conductivity β-relaxation present is in accord with the CM prediction as found before in other ionic conductors.15,25,26,36,46
From the good agreement of the secondary conductivity relaxation and the secondary dipolar relaxation times shown in Fig. 6, we have concluded that there is translation–rotation coupling. In principle, this can be confirmed by comparing the values of τσα(T) with the structural relaxation times τα(T). However, unfortunately this cannot be done because the dielectric loss peaks of AMB are masked by the dc-conductivity that arises from the hopping of ions, as shown in Fig. S1.† In order to achieve this we may have to perform experiments at elevated pressure.
This provides strong support for identifying this secondary relaxation as the conductivity β-relaxation of AMB, acting as the precursor of the conductivity α-relaxation, as reported before for other ionic conducting pharmaceuticals, viz., procainamide HCl,26,31 lidocaine HCl,30 procaine HCl,26 chlorpromazine HCl15 and an ionic liquid.39
In order not to exclude the occurrence of an intramolecular secondary relaxation, we have pursued computer simulation studies of an AMB molecule by incorporating all possible side-chain rotations about various dihedral angles. Among them (the detailed report is shown in the ESI†), the rotation around the third oxygen atom, as shown in Fig. 7, has a barrier energy of 33 kJ mol−1, which is comparable to the experimental activation energy of 38.9 ± 0.05 kJ mol−1 for the secondary relaxation.
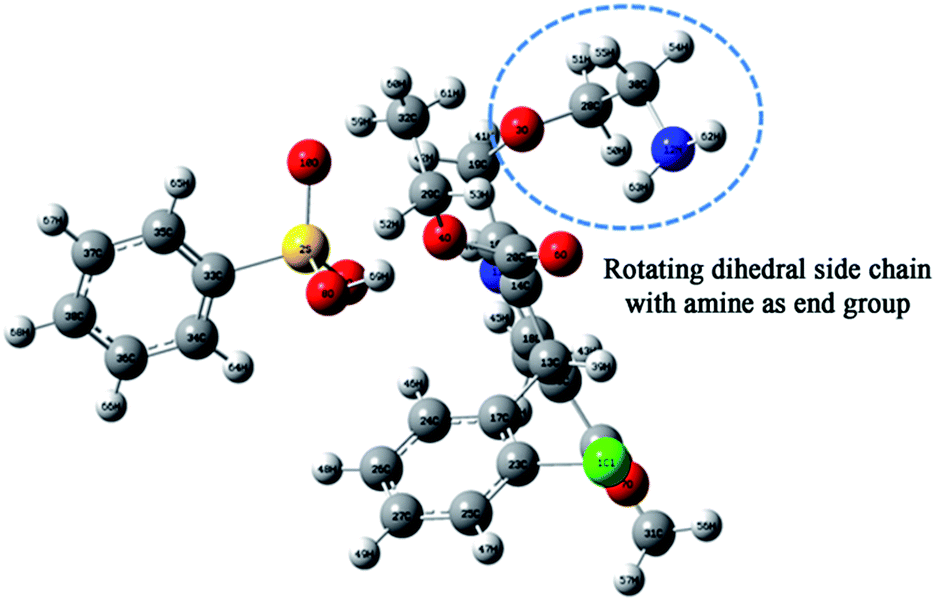 | ||
| Fig. 7 Atomic arrangement of the amlodipine besylate C20H25CIN2O5·C6H6O3S structure. The rotating group is marked. | ||
The energy conformation is plotted for each dihedral angle in Fig. S4.† The calculated value of the activation energy may be slightly lower than that of the observed experimental values since we considered only a single molecule for the simulation. Even so, the obtained results are quite comparable within a tolerance of a few kJ mol−1.15 Thus it is possible that the side-chain rotation is the origin of the secondary dipolar relaxation observed in ε′′(f), as shown in Fig. 5b. Despite this possibility, the origin of the observed secondary dipolar relaxation cannot be the dipolar JG process because the latter involves the motion of the entire AMB molecule and not a side group.42
IV. Summary and conclusion
In this paper, the molecular dynamics of the neat amorphous drug AMB were investigated by means of various experimental techniques such as DSC, BDS, and XRD. Not only is AMB a good glass-former, but it is also an ionic conductor because of the amlodipine cations and the besylate anions. The molecular and ionic dynamics present in AMB offer an opportunity to study both the conductivity relaxations and structural relaxations and their precursors in the liquid and glassy states.Crystallization is an important concern in the application of amorphous pharmaceuticals. Our experimental studies and characterization of the glassy state revealed that amorphous AMB does not have any re-crystallization tendencies on heating and cooling, but during storage it showed re-crystallisation tendencies. This result is relevant for the use of AMB as an active pharmaceutical ingredient in terms of suppressing crystallization tendencies initiated from the secondary relaxation.
On the other hand, the study of the conductivity relaxation and the analysis of the data using electric modulus representation enables the observation and characterization of the conductivity α-relaxation responsible for d.c. conductivity in the liquid state above Tg, and a conductivity β-relaxation in the glassy state. This identification is supported by the approximate agreement between its relaxation time τσβ and the primitive relaxation time τσ0 of the CM calculated from eqn (6). By confirming the presence of the conductivity β-relaxation and having its relaxation time τσβ bear a non-trivial relation to τσα similar to τσ0, we have found further evidence of the evolution of the ion conductivity dynamics with time starting from the primitive relaxation or β-relaxation and terminating in the many-ion α-relaxation.39,41 Thus, the conductivity α-relaxation originates from the β-relaxation, and that means no ionic conductivity theory is complete and fundamental without taking into consideration the relation between the two relaxations.
Incidentally, analysis of the same data in the dielectric susceptibility representation yields evidence of the presence of a secondary dipolar relaxation with a comparable relaxation time and activation energy in the glassy state. Translation–rotation coupling of AMB possibly explains the dual conductivity and dipolar nature of the secondary relaxation.
Notwithstanding, from the molecular dynamics simulation of the side chain rotation of AMB, we found that the activation energy of one of the dihedral side chains with an amine group as one end is in good agreement with the experimental value of the activation energy of the secondary dipolar relaxation. Although this can be coincidental, the possibility of the observed secondary dipolar relaxation being an intramolecular secondary relaxation of the cation cannot be excluded at this time. One possible way to resolve this problem is to take measurements at elevated pressure in the future to investigate the pressure dependence of the secondary dipolar relaxation. If its relaxation time is pressure sensitive, then the possibility of it being the side chain rotation can be eliminated. In that case, due to the translation–rotation coupling, the secondary dipolar relaxation must be the Johari–Goldstein β-relaxation of the structural α-relaxation.
Conflicts of interest
There are no conflicts to declare.Acknowledgements
The authors thankfully acknowledge the fruitful discussions held with Raj Suryanarayanan (Department of Pharmaceutics, University of Minnesota), G. Govindraj (Dean, Pondichery University) and Vijisha K Rajan. KPSH acknowledges UGC-MANF for the fellowship with sanction number MANF-2017-18-KER-78598. KPSH and MST gratefully acknowledge the collaborative research grant from UGC-DAE (Sanction Order No-UDCSR/MUM/AO/CRS-M-2I0/2015/501 dated 06/01/2015). MST further acknowledges the financial assistance from KSCSTE (SRS, SARD), UGC (MRP) and DST FIST.Notes and references
- Z. Wojnarowska, K. Kołodziejczyk, K. J. Paluch, L. Tajber, K. Grzybowska, K. L. Ngai and M. Paluch, Phys. Chem. Chem. Phys., 2013, 15, 9205–9211 RSC.
- J. R. Sangoro, C. Iacob, A. Serghei, C. Friedrich and F. Kremer, Phys. Chem. Chem. Phys., 2009, 11, 913–916 RSC.
- P. Migowski, D. Zanchet, G. Machado, M. A. Gelesky, S. R. Teixeira and J. Dupont, Phys. Chem. Chem. Phys., 2010, 12, 1648 RSC.
- M. J. Marczewski, B. Stanje, I. Hanzu, M. Wilkening and P. Johansson, Phys. Chem. Chem. Phys., 2014, 16, 12341–12349 RSC.
- K. Lunstroot, K. Driesen, P. Nockemann, L. Viau, P. H. Mutin, A. Vioux and K. Binnemans, Phys. Chem. Chem. Phys., 2010, 12, 1879–1885 RSC.
- M. Schmollngruber, C. Schröder and O. Steinhauser, Phys. Chem. Chem. Phys., 2014, 16, 10999–11009 RSC.
- E. Kaminska, M. Tarnacka, K. Kaminski, K. L. Ngai and M. Paluch, Eur. J. Pharm. Biopharm., 2015, 97, 185–191 CrossRef PubMed.
- T. El Goresy and R. Böhmer, J. Non-Cryst. Solids, 2006, 352, 4459–4463 CrossRef.
- K. L. Grzybowska, K. Paluch, M. Grzybowski, A. Wojnarowska, Z. Hawelek, L. Kołodziejczyk and K. Ngai, J. Phys. Chem. B, 2010, 114(2010), 12792–12801 CrossRef PubMed.
- K. P. Safna Hussan, M. S. Thayyil, S. K. Deshpande, T. V. Jinitha, K. Manoj and K. L. Ngai, Eur. J. Pharm. Sci., 2018, 119, 268–278 CrossRef PubMed.
- S. Capaccioli, K. L. Ngai and N. Shinyashiki, J. Phys. Chem. B, 2007, 111, 8197–8209 CrossRef PubMed.
- K. L. Ngai, J. Non-Cryst. Solids, 2006, 352, 404–408 CrossRef.
- S. Capaccioli, K. Kessairi, M. S. Thayyil, D. Prevosto and M. Lucchesi, J. Non-Cryst. Solids, 2011, 357, 251–257 CrossRef.
- K. Adrjanowicz, Z. Wojnarowska, P. Wlodarczyk, K. Kaminski, M. Paluch and J. Mazgalski, Eur. J. Pharm. Sci., 2009, 38, 395–404 CrossRef PubMed.
- S. Hensel-bielowka, K. L. Ngai, A. Swiety-pospiech, L. Hawelek, J. Knapik, W. Sawicki and M. Paluch, J. Non-Cryst. Solids, 2015, 407, 81–87 CrossRef.
- K. G. Sangeetha, K. K. Aravindakshan and K. P. Safna Hussan, J. Mol. Struct., 2017, 1150, 135–145 CrossRef.
- K. P. Safna Hussan, T. M. Shahin, K. R. Vijisha and K. Muraleedharan, Comput. Biol. Chem., 2018, 72, 113–121 CrossRef PubMed.
- K. Safna Hussan, T. Mohamed Shahin, S. K. Deshpande and T. V. Jinitha, AIP Conf. Proc., 2017, 1832, 070011 CrossRef.
- K. P. Safna Hussan, T. Mohamed Shahin, S. K. Deshpande and T. V. Jinitha, AIP Conf. Proc., 2017, 1832, 070011 CrossRef.
- K. G. Sangeetha, K. K. Aravindakshan and K. P. Safna Hussan, J. Mol. Struct., 2017, 1150, 135–145 CrossRef.
- B. Katharina, R. Christiaan, N. Mark and R. Robin D, In search of pure liquid salt forms of aspirin: ionic liquid approaches with acetylsalicylic acid and salicylic acid, Phys. Chem. Chem. Phys., 2010, 12, 2011–2017 RSC.
- G. J. B. Ettema, H. Hoorn and J. M. Lemmens, US6828339B2; K. Mereiter, J. Roll, Priv. Commun. to CCDC Depos. no. 190882, 2002, 2004, (23).
- L. X. Scattering, S. N. Scattering, M. Matsugami, T. Takamuku, T. Otomo and T. Yamaguchi, J. Phys. Chem. B, 2006, 110, 12372–12379 Search PubMed.
- J. Sangster, J. Phys. Chem. Ref. Data, 1999, 28, 889–930 CrossRef.
- K. L. Ngai, J. Phys.: Condens. Matter, 2000, 12, 6437–6451 CrossRef.
- Z. Wojnarowska, K. Grzybowska, L. Hawelek and M. Paluch, J. Chem. Phys., 2012, 164507 CrossRef PubMed , 1–8.
- F. Kremer and A. Schönhals, Broadband Dielectric Spectroscopy, 2003 Search PubMed.
- K. P. Safna Hussan, T. Mohamed Shahin, S. K. Deshpande, T. V. Jinitha, K. R. Vijisha and K. L. Ngai, J. Mol. Liq., 2016, 223, 1333–1339 CrossRef.
- Z. Wojnarowska, M. Paluch, A. Grzybowski, K. Adrjanowicz, K. Grzybowska, K. Kaminski, P. Wlodarczyk and J. Pionteck, J. Chem. Phys., 2009, 131, 104505–104514 CrossRef.
- Z. Wojnarowska, J. Pionteck, S. Pawlus, A. Grzybowski, Z. Wojnarowska, J. Pionteck, S. Pawlus and A. Grzybowski, J. Chem. Phys., 2012, 224501 Search PubMed , 1.
- Z. Wojnarowska, C. M. Roland, K. Grzybowska and M. Paluch, Phys. Rev. Lett., 2012, 015701 CrossRef PubMed , 1–4.
- A. Swiety-Pospiech, Z. Wojnarowska, S. Hensel-Bielowka, J. Pionteck and M. Paluch, J. Chem. Phys., 2013, 138, 204502 CrossRef PubMed , 1–8.
- T. Psurek, S. Hensel-Bielowka, J. Ziolo and M. Paluch, J. Chem. Phys., 2002, 116, 9882–9888 CrossRef.
- J. Scheers, L. Niedzicki, G. Z. Zukowska, P. Johansson, W. Wieczorek and P. Jacobsson, Phys. Chem. Chem. Phys., 2011, 13, 11136–11147 RSC.
- A. Rivera, A. Brodin, A. Pugachev and E. A. Rössle, J. Chem. Phys., 2007, 126, 0–7 CrossRef PubMed.
- Z. Wojnarowska, K. L. Ngai and M. Paluch, J. Chem. Phys., 2014, 140, 1–6 CrossRef PubMed.
- K. P. Safna Hussan, T. Mohamed Shahin, M. Binesh, S. K. Deshpande, K. R. Vijisha, S. H. Safna, M. S. Thayyil, M. Binesh, S. K. Deshpande and V. K. Rajan, J. Mol. Liq., 2018, 251, 487–491 CrossRef.
- K. P. Safna Hussan, T. Mohamed Shahin, S. K. Deshpande, T. V. Jinitha and K. Jayant, Solid State Ionics, 2017, 310, 166–175 CrossRef.
- K. Adrjanowicz, K. Kaminski, M. Paluch, P. Wlodarczyk, K. Grzybowska, Z. Wojnarowska, L. Hawelek, W. Sawicki, P. Lepek and R. Lunio, J. Pharm. Sci., 2010, 99, 828–839 CrossRef PubMed.
- U. Sailaja, T. Mohamed Shahin, N. S. K. Kumar and G. Govindaraj, J. Pharm. Anal., 2014, 1–9 Search PubMed.
- T. H. Kim, T. Shibata, S. Kojima, D. M. Shin, Y. H. Hwang and J. H. Ko, Curr. Appl. Phys., 2014, 14, 965–969 CrossRef.
- U. Sailaja, M. Shahin Thayyil, N. S. Krishna Kumar and G. Govindaraj, Eur. J. Pharm. Sci., 2013, 49, 333–340 CrossRef PubMed.
- M. T. O. Abe, N. T. Correia, L. Valdes, J. M. B. Ndjaka and F. Affouard, J. Mol. Liq., 2015, 205, 74–77 CrossRef.
- M. S. Thayyil, S. Capaccioli, D. Prevosto and K. L. Ngai, Philos. Mag., 2008, 88, 4007–4013 CrossRef.
- F. Pabst, J. Gabriel, P. Weigl and T. Blochowicz, Chem. Phys., 2017, 494, 103–110 CrossRef.
- G. Jarosz, M. Mierzwa, J. Ziozo, M. Paluch, H. Shirota and K. L. Ngai, J. Phys. Chem. B, 2011, 115, 12709–12716 CrossRef PubMed.
- K. L. Ngai, J. Chem. Phys., 1998, 109, 6982–6994 CrossRef.
- K. L. Ngai and M. Paluch, J. Chem. Phys., 2004, 120, 857–873 CrossRef PubMed.
- S. Capaccioli, M. Paluch, D. Prevosto, L.-M. Wang and K. L. Ngai, J. Phys. Chem. Lett., 2012, 3, 735–743 CrossRef PubMed.
- M. S. Thayyil, K. L. Ngai, D. Prevosto and S. Capaccioli, J. Non-Cryst. Solids, 2015, 407, 98–107 CrossRef.
- K. L. Ngai, J. Habasaki, D. Prevosto, S. Capaccioli and M. Paluch, J. Chem. Phys., 2012, 137, 034511 CrossRef PubMed.
- K. L. Ngai, J. Habasaki, D. Prevosto, S. Capaccioli and M. Paluch, J. Chem. Phys., 2014, 140, 019901 CrossRef.
- K. L. Ngai and M. Paluch, J. Non-Cryst. Solids, 2017, 478, 1–11 CrossRef.
- K. L. Ngai, Relaxation and Diffusion in Complex Systems, Springer, New York, 2011 Search PubMed.
- R. Casalini and C. M. Roland, Macromolecules, 2013, 46, 6364–6372 CrossRef.
Footnote |
| † Electronic supplementary information (ESI) available. See DOI: 10.1039/c8ra01544a |
| This journal is © The Royal Society of Chemistry 2018 |