
 Open Access Article
 This Open Access Article is licensed under a
 Creative Commons Attribution 3.0 Unported Licence
Enhanced thermal conductivity of epoxy composites filled with tetrapod-shaped ZnO†
Liangchao Guoab,
Zhenyu Zhang*a,
Ruiyang Kangab,
Yapeng Chenb,
Xiao Houb,
Yuming Wub,
Mengjie Wangb,
Bo Wangab,
Junfeng Cuiab,
Nan Jiangb,
Cheng-Te Linb and
Jinhong Yu *b
*b
aKey Laboratory for Precision and Non-Traditional Machining Technology of Ministry of Education, Dalian University of Technology, Dalian 116024, China. E-mail: zzy@dlut.edu.cn
bKey Laboratory of Marine Materials and Related Technologies, Zhejiang Key Laboratory of Marine Materials and Protective Technologies, Ningbo Institute of Materials Technology and Engineering, Chinese Academy of Sciences, Ningbo 315201, China. E-mail: yujinhong@nimte.ac.cn
First published on 29th March 2018
Abstract
Epoxy composites with ZnO powders characterized by different structures as inclusion are prepared and their thermal properties are studied. The experimental results demonstrate that the epoxy resins filled by tetrapod-shaped ZnO (T-ZnO) whiskers have the superior thermal transport property in comparison to ZnO micron particles (ZnO MPs). The thermal conductivity of ZnO/epoxy and T-ZnO/epoxy composites in different mass fraction (10, 20, 30, 40, 50 wt%) are respectively investigated and the suitable models are compared to explain the enhancement effect of thermal conductivity. The thermal conductivity of T-ZnO/epoxy composites with 50 wt% filler reaches 4.38 W m−1 K−1, approximately 1816% enhancement as compared to neat epoxy. In contrast, the same mass fraction of ZnO MPs are incorporated into epoxy matrix showed less improvement on thermal conduction properties. This is because T-ZnO whiskers act as a thermal conductance bridge in the epoxy matrix. In addition, the other thermal properties of T-ZnO/epoxy composites are also improved. Furthermore, the T-ZnO/epoxy composite also presents a much reduced coefficient of thermal expansion (∼28.1 ppm K−1) and increased glass transition temperature (215.7 °C). This strategy meets the requirement for the rapid development of advanced electronic packaging.
1. Introduction
With the development of integrated circuit chips toward higher density and high frequency, more and more waste heat must be removed to make the device work stable. Thus, this has prompted fundamental studies to high thermal conduction in the field of advanced polymeric composites. The polymeric materials have strong potential as thermal management materials because of the ease of their processing, light weight, and low cost.1 However, the thermal conductivity of polymers is quite low, i.e. in the light of 0.1 W m−1 K−1 at room temperature, which cannot meet the heat dissipating requirements of modern electronic and electrical systems.2–4 Therefore, polymer composites containing ceramic fillers, such as alumina (Al2O3), aluminum nitride (AlN), boron nitride (BN) and zinc oxide (ZnO), have been the subject of studies to enhance their thermal conductivity.5–11 Generally, thermal conductivity of the polymer composites is chosen based on the thermal conductive chains or networks, which are formed between fillers and fillers. However, the quasi-circular ceramic fillers can hardly form thermal conductive chains except if high content fillers is applied.Tetrapod-shaped ZnO whisker (T-ZnO) is a new type of ZnO whisker with superior performances, such as thermally conductive and other uses.12–14 Yuan et al.15 prepare a phenolic formaldehyde composite with an in-plane thermal conductivity of 1.96 W m−1 K−1 by compounding with 30 wt% T-ZnO. However, less attention is paid to the formation mechanism of three-dimensional thermal network offered by T-ZnO. Nie et al.16 investigate and predict the synergistic effect of T-ZnO and BN in the thermal conductive high-density polyethylene composites, but the thermal conductivity of composites with 50 wt% filler is about 1.99 W m−1 K−1, which is relatively low. In addition, graphene-coated T-ZnO hybrids are fabricated by chemical modification of T-ZnO. Though, a relatively high thermal conductivity of 3.96 W m−1 K−1 is achieved for the epoxy composite with 55 wt%, while the fabrication process is quite fussy and time consuming.17 Based on the previous study, the inclusion of T-ZnO into polymer matrix is still one of the hardest challenges in polymer composites with high thermal conductivity.
In this study, we propose a facile method for the preparation of epoxy composites containing T-ZnO fillers by solution blending process and the fillers are mixed uniformly with epoxy using ethanol as the solvent. A high thermal conductivity of 4.38 W m−1 K−1 is achieved for the epoxy composite with 50 wt% T-ZnO filler, which is higher than previous references at the same content. The interconnected network of T-ZnO fillers in epoxy matrix results in not only enhancing thermal transportation properties but also retaining low coefficient of thermal expansion (CTE) performance. The characteristics of high thermal conductivity and low CTE of T-ZnO/epoxy composites make it more easily applicable in thermal management of power devices and other electrical devices.
2. Experimental
2.1 Materials
The ZnO powders with an average diameter of 5 μm were obtained from Forsman Scientific (Beijing) Co., Ltd. China. Tetrapod-shaped ZnO (T-ZnO) whiskers were provided from by Chengdu Crystrealm Co., Ltd. China. A cycloaliphatic epoxy resin (6105, DOW Chemicals, USA) along with hardener of methyl-hexahydrophthalic anhydride (MHHPA, Shanghai Li Yi Science & Technology Development Co. Ltd., China) was used in the present study. Neodymium(III) acetylacetonate trihydrate (Nd(III)acac) purchased from Aldrich Chemicals was used as latent catalyst.2.2 Preparation of epoxy composites
The epoxy composites with different T-ZnO loadings were prepared as follows. Firstly, the required ratio of Nd(III)acac (0.1%) was added to the epoxy resin, stirred and degassed at 80 °C in a three-necked flask. The homogeneous solution was then cooled down to ambient temperature. Secondly, a desired amount of T-ZnO (10, 20, 30, 40, and 50 wt%) was ultrasonically dispersed in ethanol for 1 h at room temperature and then added into the predetermined amount of epoxy resin (200 g). The obtained mixture was then placed in a beaker with vigorous mechanical stirring at 80 °C in water bath until complete evaporation of ethanol. Curing agent (MHHPA) was added at a ratio of 100![[thin space (1/6-em)]](https://www.rsc.org/images/entities/char_2009.gif) :95 (epoxy:curing agent) by weight into the beaker and was stirred for 20 min. It was further degassed in the vacuum oven for 10 min to remove air bubbles. Finally, the mixture was poured onto preheated stainless steel molds, pre-cured in an oven at 135 °C for 2 h, followed by post-cure at 165 °C for 14 h. The molds were left in the oven and allowed to cool gradually to room temperature and then polished with emery paper for different characterizations. For comparison, the epoxy composites with ZnO were also fabricated with the same procedures as described above. For the sake of convenience, the composites containing ZnO and T-ZnO were denoted as ZnO/epoxy composites and T-ZnO/epoxy composites, respectively. The experiment details of the process of epoxy composites are shown in Fig. 1.
:95 (epoxy:curing agent) by weight into the beaker and was stirred for 20 min. It was further degassed in the vacuum oven for 10 min to remove air bubbles. Finally, the mixture was poured onto preheated stainless steel molds, pre-cured in an oven at 135 °C for 2 h, followed by post-cure at 165 °C for 14 h. The molds were left in the oven and allowed to cool gradually to room temperature and then polished with emery paper for different characterizations. For comparison, the epoxy composites with ZnO were also fabricated with the same procedures as described above. For the sake of convenience, the composites containing ZnO and T-ZnO were denoted as ZnO/epoxy composites and T-ZnO/epoxy composites, respectively. The experiment details of the process of epoxy composites are shown in Fig. 1.
 | ||
| Fig. 1 Schematic illustration of the preparation process of T-ZnO/epoxy composites. | ||
2.3 Characterizations
The morphology of the ZnO, T-ZnO and the fractured surface of composites were examined by field emission scanning electron microscopy (FE-SEM, QUANTA FEG250, USA) equipped with energy dispersive spectroscopy (EDS) at an acceleration voltage of 20 kV. Samples that were broken and the fractured surface was coated with a thin gold layer to avoid accumulation of charge. X-ray photoelectron spectroscopy (XPS) was carried out with a Kratos AXIS Ultra DLD spectrometer, using AlKα excitation radiation (hν: 1253.6 eV). The X-ray diffraction (XRD) patterns of the samples were recorded on a D8 DISCOVER with GADDS (BRUKER Ltd. Germany) with CuKα radiation (λ = 1.5406 Å). The scanning was performed from 10° to 80° with a speed of 4° min−1 at room temperature. Thermal conductivities of the composites were measured using the light flash apparatus LFA 467 NanoFlash® (NETZSCH, Germany). The IR-photos were captured by infrared camera (Fluke, Ti400, USA). Differential scanning calorimetry was performed by a Pyris Diamond DSC (Perkin-Elmer, USA) from 20 to 250 °C at a heating rate of 10 °C min−1 under a nitrogen atmosphere to study glass transition temperature (Tg) of the composites. The CTE measurements were performed on a thermal mechanical analyzer (TMA 402F1/F3, NETZSCH, Germany) from 310 to 460 K at a heating rate of 5 K min−1. Thermogravimetric analysis (TGA) was carried out using TG 209 F3 thermo-analyzer (NETZSCH, Germany). The temperature range was from 50 to 800 °C at a ramp rate of 10 °C min−1 in nitrogen atmosphere. Dynamic mechanical analysis (DMA) were performed on a DMA Q800 dynamic mechanical analyzer (TA instruments, USA) operating in the tension mode at an oscillation frequency at 1 Hz.3. Results and discussion
3.1 Characterization of ZnO filler
The different structure of ZnO MPs and T-ZnO can be observed in Fig. 2. Fig. 2a and b shows the SEM image of ZnO MPs dispersed in ethanol using sonication–centrifugation process. The high-resolution SEM image of ZnO MPs indicates that the particles (size 2–10 μm) have irregular particle size and can be easily aggregated. The range sizes of particles are marked and calculated by one after another, and are taken the average on the basis of the longest axis and the most narrow axis. The aspect ratio of ZnO MPs is difficult to determine, but it can be estimated that the aspect ratio of ZnO MPs is approximately from 1.5 to 1.7. In Fig. 2c and d, T-ZnO is composed of the needle (size 2–10 μm) and root (diameter 0.2–1 μm). The aspect ratio of T-ZnO is calculated about 10, which is considered beneficial to form the thermal conductive networks when filled in epoxy in theory.18 Also, the XRD pattern of ZnO MPs exhibits characteristic peaks at 31.9° (100), 34.6° (002), 36.4° (101), 47.6° (102) and 56.7° (110) in Fig. S1a.†19 The T-ZnO presents a XRD pattern and Raman spectroscopy similar to that of ZnO MPs, as shown in Fig. S1a and b,† which is an evidence of the same crystal form compared with ZnO MPs. The Raman spectra is an effective and clipping method tool to investigate the crystalline of ceramics.20,21 T-ZnO exhibits sharp peak at 437.9 cm−1, corresponding to its nonpolar optical phonon E2 (high) mode.22 Fig. S1c and d† show the dispersion states of the ZnO MPs and T-ZnO in ethanol after standing for 10 min and 12 h.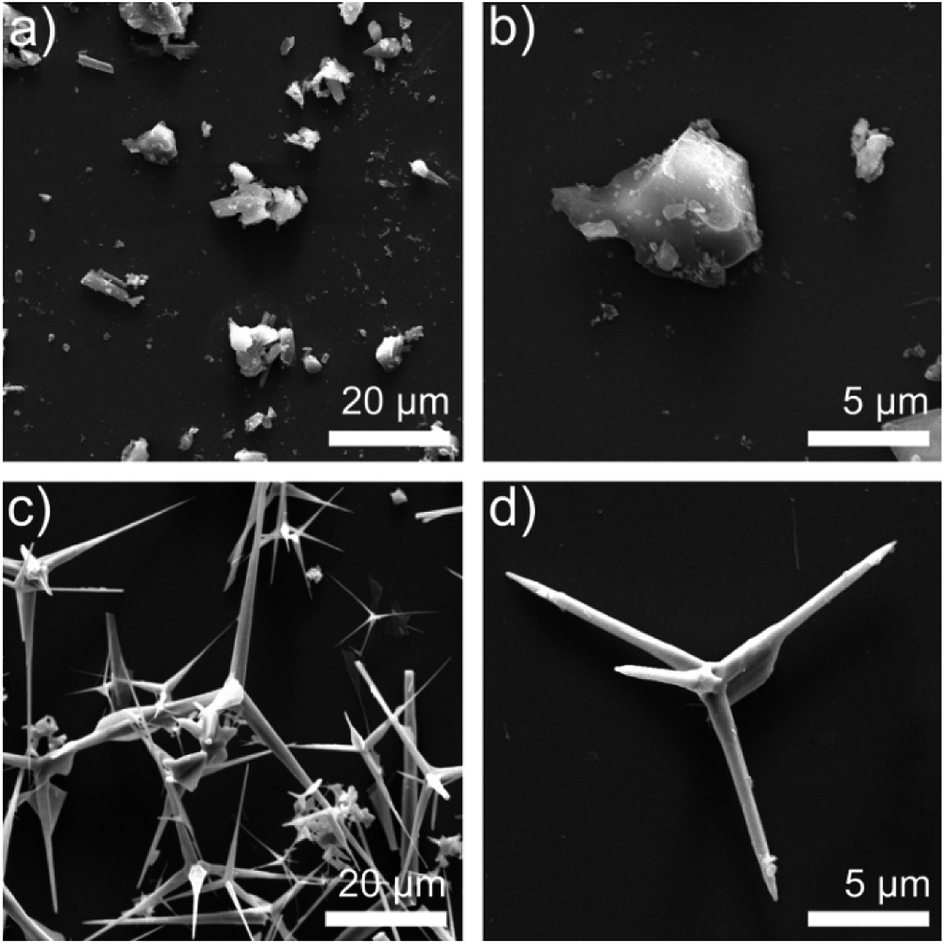 | ||
| Fig. 2 (a) SEM images of ZnO MPs (b) SEM images of single ZnO MP; (c) SEM images of T-ZnO (d) SEM images of single T-ZnO. | ||
3.2 Morphology of epoxy composites
Fig. 3 reveals SEM images of fracture surfaces of the ZnO/epoxy and T-ZnO/epoxy composites with 50 wt% fillers in order to demonstrate the distribution and structure of fillers in epoxy composites. Fig. 3a and b show that there are some cracks and porous structure on the regions of the fracture surface in ZnO/epoxy composites, indicating a week interfacial interaction between epoxy matrix and ZnO MPs. Unlike epoxy composites filled with ZnO MPs, it can be clearly observed that the pattern of cross section has a smooth surface with the uniform dispersion of T-ZnO and T-ZnO can perfectly be wrapped with epoxy without crack in Fig. 3c and d. It is suggested that the needle of T-ZnO formed a three-dimensional network and a strong interfacial interaction between matrix and surface of T-ZnO in Fig. 3d, which can be concluded as the critical factor for thermal properties. Meanwhile, XPS analysis of T-ZnO/epoxy and ZnO/epoxy composites are employed to further verify the surface composition and investigate the functional groups and C1s high-resolution results are shown in Fig. S2.† The spectra of C1s composes of three bonds centered at 284.6, 285.8, and 287.8 eV, which corresponds to C–C, C–O, C![[double bond, length as m-dash]](https://www.rsc.org/images/entities/char_e001.gif) O, respectively.
O, respectively.
 | ||
| Fig. 3 (a) Low resolution SEM images of 50% ZnO/epoxy composites (b) high resolution porous structure in ZnO/epoxy composites (c) low resolution SEM images of 50% T-ZnO/epoxy composites (d) high resolution SEM images of T-ZnO can perfect be wrapped with epoxy. | ||
The energy dispersive spectrometer (EDS) of T-ZnO/epoxy observes that there are only Zn, O, C elements in the composites in Fig. 4. Compared with ZnO/epoxy composites in Fig. S3,† the content of Zn, O, C in T-ZnO/epoxy composites are approximately equal with those in ZnO/epoxy. Zn elements in T-ZnO/epoxy composites are continuous in the composites which display the outline of a T-ZnO particle. If the quantity of T-ZnO is further increased and reaches the percolation threshold, local chain and network would mutually bridge to generate the whole network. While O and C elements are randomly distributed in the matrix which is similar to ZnO/epoxy composites. It is means that ZnO MPs are analogous to the “sea-island” structure.
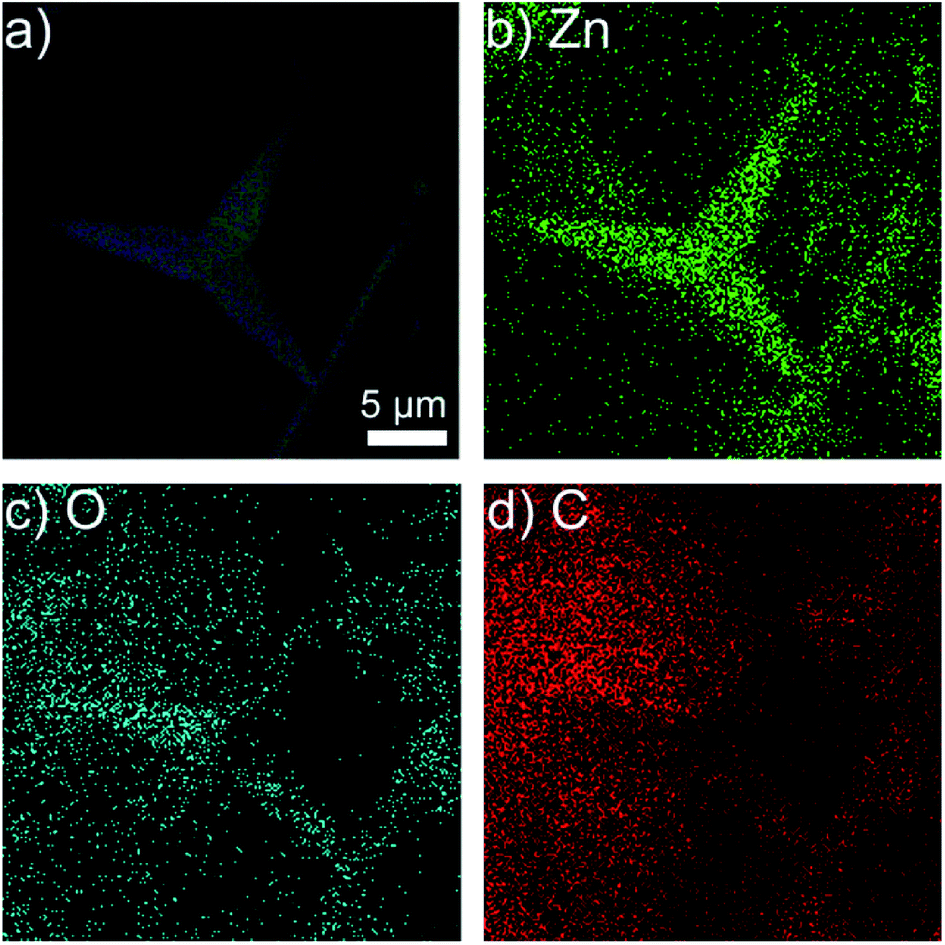 | ||
| Fig. 4 EDS images of (a) 50% T-ZnO/epoxy composites; the distribution of (b) Zn element; (c) O element and (d) C element. | ||
3.3 Thermal properties of epoxy composites
In order to enhance the thermal conductivity, not only the thermal network maximized through high filler loading, but also the uniform dispersion in polymer matrix is the key factor.23 We adopted a transient laser method to indirectly estimate the thermal conductivity of the neat epoxy and its composites. Fig. 5a and b present thermal diffusivity and thermal conductivity of neat epoxy and epoxy composites with 10–50 wt% filler loading. As can be shown, both the thermal diffusivity and conductivity of the samples shows extraordinary increase with increase ZnO and T-ZnO content. The thermal diffusivity of T-ZnO/epoxy composite increased from 0.11 mm2 s−1 (neat epoxy) to 0.18 mm2 s−1 (74.6% enhancement) with the addition of 10 wt% T-ZnO. As the content of T-ZnO is further increased to 50 wt%, the thermal diffusivity is improved from 0.11 mm2 s−1 to 1.91 mm2 s−1, and the thermal conductivity was improved from 0.22 W m−1 K−1 to 4.38 W m−1 K−1. At 50 wt% T-ZnO loading, the thermal conductivity of T-ZnO composite is enhanced significantly by 1817% compared to that of neat epoxy, as illustrated in Fig. 5c. Moreover, a sharply increase on thermal diffusivity and thermal conductivity is observed when the loading fraction of T-ZnO increased from 30 to 50 wt%. It is suggested that the percolation threshold is obtained at ∼30 wt% and T-ZnO three-dimensional network is formed. For comparison, the thermal conductivity of ZnO/epoxy composites was also determined with the same procedure. The value is 1.623 W m−1 K−1 at 50 wt%, lower than that of T-ZnO/epoxy composites at the same fraction, only 624% comparing to that neat epoxy, as shown in Fig. 5b and c. Moreover, compared to ZnO/epoxy composites, T-ZnO/epoxy composites achieve higher thermal conductivity, which is because of several reasons as following: (a) the aspect ratio of T-ZnO is about 5 times more than ZnO MPs; (b) the heat conductive path and three-dimensional network between T-ZnO and T-ZnO and (c) a better interaction between T-ZnO with the epoxy matrix.24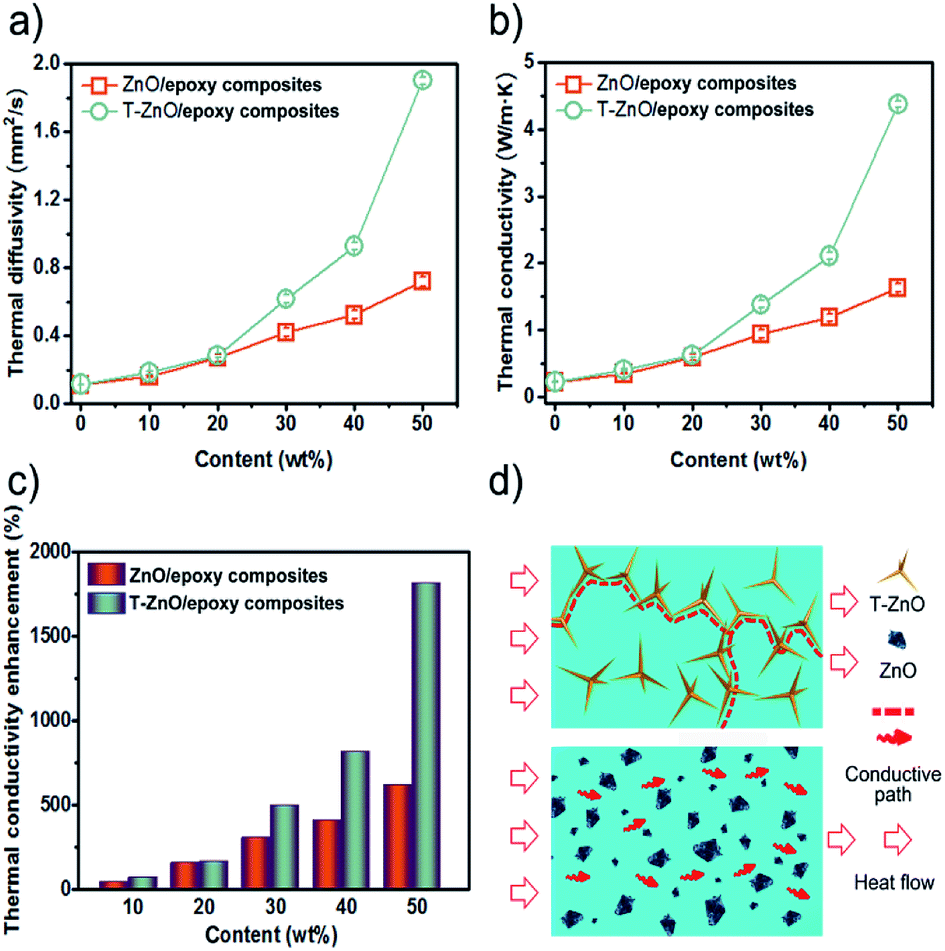 | ||
| Fig. 5 (a) Thermal diffusivity and (b) thermal conductivity of epoxy composites as a function of ZnO MPs or T-ZnO content; (c) thermal conductivity enhancement (TCE) of epoxy composites compared to neat epoxy; (d) the model of heat flow for the epoxy composites. | ||
In order to further understand the thermal conductive mechanism of epoxy composites with regard to phonon, it is believed that phonon plays a significant role in heat conduction of majority polymer composites. Meanwhile, both the harmonic or anharmonic phonon–phonon interaction at high temperatures and the scattering of the phonon by the crystal boundaries at low temperatures determine the thermal conductivity of semiconductors.25 Neat epoxy is not a good heat conductor due to the low crystallinity and phonon scattering of the randomly entangled molecule chains.26 Introducing semiconductors of high thermal conductivity, such as ZnO (∼60 W m−1 K−1)27 into epoxy can solve this problem. The results show that the low loading T-ZnO in the polymer matrix cannot contact with each other just like “islands” in the sea. If the quantity of T-ZnO is sharply increased and reaches the percolation threshold, T-ZnO would built efficient thermal conductive network and greatly enhanced thermal conductivity of the matrix.28 In addition, the densely packed structure formed upon vacuum filtration decreased the interfacial thermal resistance, which is another reason for the high thermal conductivity. In order to visualized representation the superiority of ZnO MPs as compared with T-ZnO, the thermal conduction model of ZnO/epoxy and T-ZnO/epoxy composites was proposed to present the thermal path of epoxy composites as shown in Fig. 5d. Also, it can demonstrate that the ZnO MPs cannot contact with each other and the polymer layers stop the ZnO MPs from forming efficient thermal conduction pathway in epoxy, even though the loading is 50 wt%. Comparison with T-ZnO/epoxy composites, that is the reason ZnO/epoxy composites have relatively lower thermal conductivity in arbitrarily loadings. Moreover, the phonon mismatch between ZnO MPs and epoxy matrix leads to a large thermal interface resistance. Phonon mismatch shows that phonon can hardly be absorbed by crystalline structure in the procedure of transmission, which means, the energy phonon carries is not sensitively to the crystal lattice, which is in good agreement with the aforementioned SEM results (as shown in Fig. 3).28
As shown in Fig. 6a, the effect of temperature on thermal conductivity is investigated at 50 wt% loading of T-ZnO and ZnO MPs. It is suggested that the thermal conductivity of composites is in the order of ZnO/epoxy < T-ZnO/epoxy under the same temperature. For the T-ZnO/epoxy composites, thermal conductivity is confirmed to be 4.38 W m−1 K−1 at 25 °C and decreased with temperature over the temperature range investigated. Similarly, the thermal conductivity of ZnO/epoxy composites shows the same trend with the increase of temperature. It has been demonstrated that crystalline materials exhibit a decrease in thermal conductivity with increasing temperature because of Umklapp phonon scattering, while the thermal conductivity of the amorphous materials increases with increasing temperature.29 Fig. 6b shows the thermal conductivity changes only slightly change after 20 heating/cooling cycles alternating between 25 °C and 100 °C, suggesting good thermal stability for epoxy composites in this temperature range.
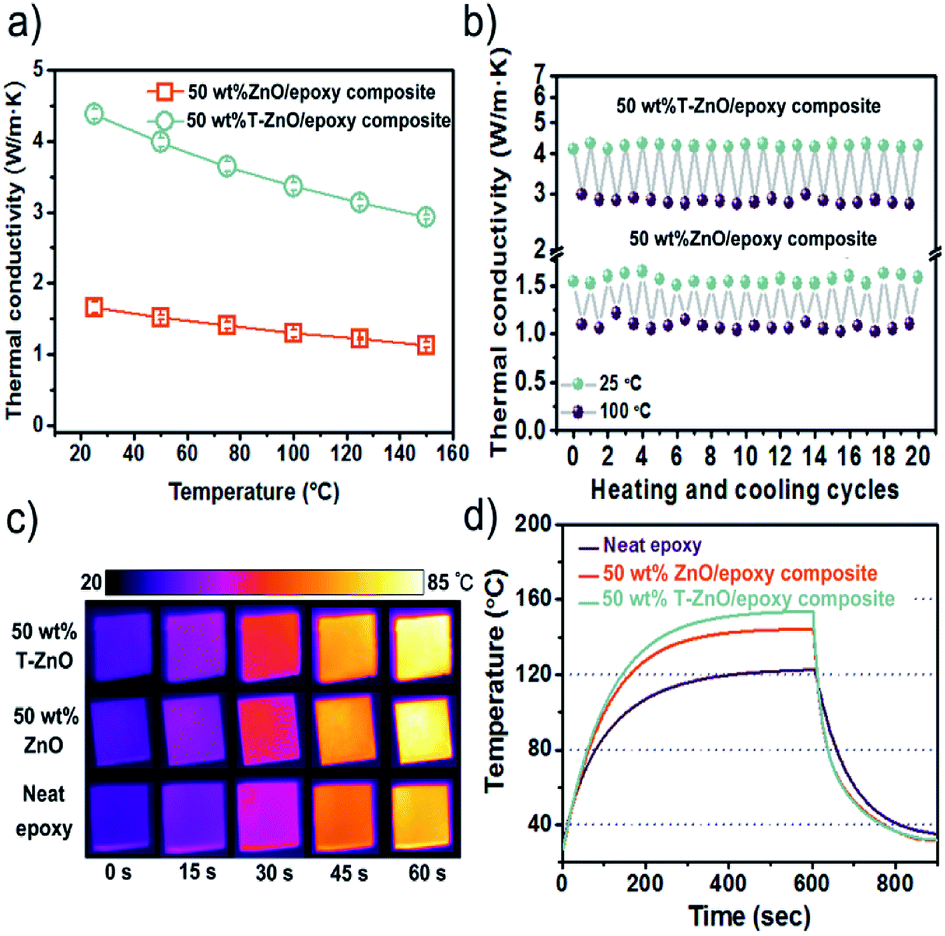 | ||
| Fig. 6 (a) Thermal conductivity of epoxy composites as a function of test temperature; the thermal stability of epoxy composites: (b) thermal conductivity of heating/cooling cycles alternating between 25 °C and 100 °C; (c) infrared images, (d) surface temperature variation with time upon heating and cooling event. | ||
An infrared camera was used to record the temperature response difference during heating, as shown in Fig. 6c. There were three samples vertically placed on the same heater in order of 50 wt% T-ZnO/epoxy composites, 50 wt% ZnO/epoxy composites and neat epoxy from top to down. Infrared camera images showing the color change from blue to red by 60 s which represents that the temperature of the heater increased from room temperature (25 °C) to 100 °C. It is implied that the surface of the sample become more hot with increasing heating time. Moreover, the color of epoxy composites is much brighter comparing to neat epoxy. After 60 s, the surface of T-ZnO/epoxy is 84.4 °C and that of ZnO/epoxy is 81.9 °C, compared that neat epoxy shows a slight orange color and its surface temperature is 74.6 °C. The results give us an interpretation that the better heat dissipation ability of epoxy composites than neat epoxy, especially for the T-ZnO/epoxy composites, which is in accordance with the thermal conductivity values shown in Fig. 5b. In order to verify the effect on heat dissipation, the system with a hot plate, a thermocouple element and versatile voltmeter are employed to get quantitative results of heating and cooling process. As shown in Fig. 6d, neat epoxy rises to 122.4 °C by the end of 601 s, which is consistent with infrared images. While it can be observed that the highest temperature of T-ZnO/epoxy composites is 153.6 °C, compared to that of ZnO/epoxy is 144.3 °C. After 601 s heating, the samples are cooled down to a room temperature plate in several seconds. The cooling data with differential treatment ranging from 601 to 750 s are shown in Fig. 6d. Obviously, we found that T-ZnO/epoxy composites is the fastest one cooling down to room temperature, followed by ZnO/epoxy, and neat epoxy. In brief, epoxy composites show better heat dissipating behaviors comparing with neat epoxy. Among all of composites, T-ZnO/epoxy composites are illuminated to be the most excellent, which indicates that T-ZnO are the most promising filler to enhance the thermal propagation of epoxy composite.
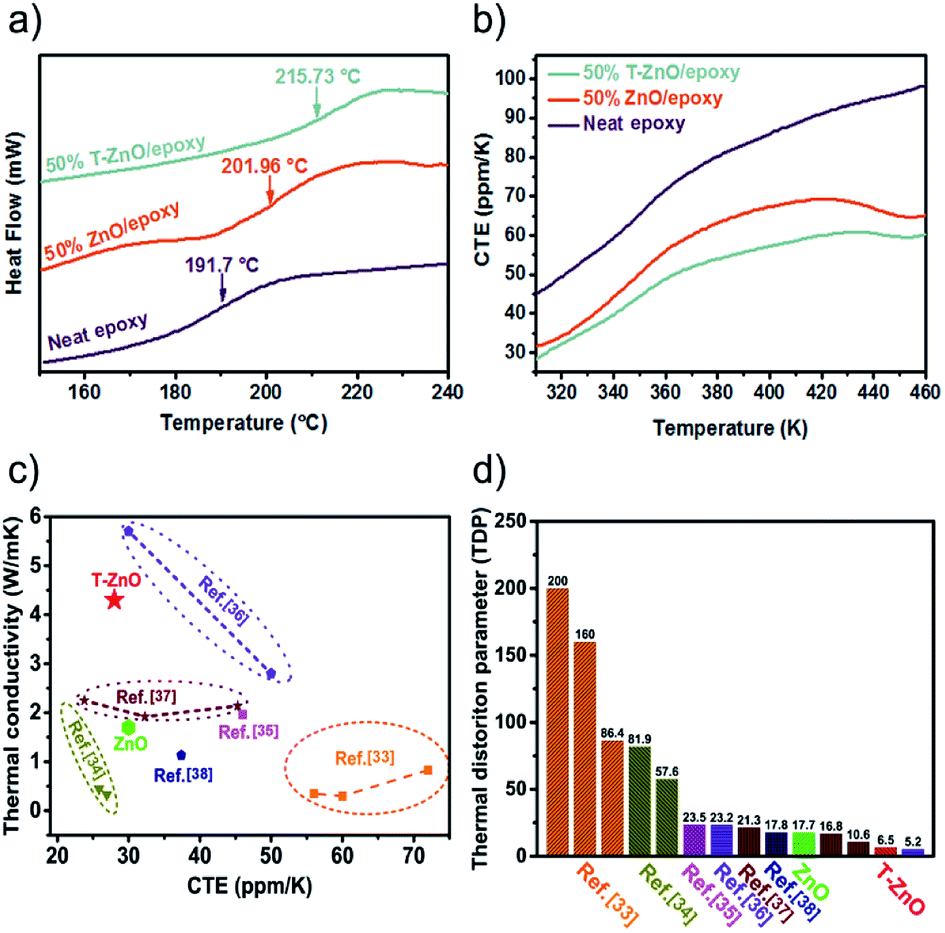
Fig. 7a shows the DSC curve of the neat epoxy, ZnO/epoxy and T-ZnO/epoxy at 50 wt% loading, respectively. The glass transition temperatures (Tg) appear over a wide temperature range, because the level of cross-linking in the epoxy matrix is not accordant. It is well-known that the Tg of epoxy and its composites is bound up with the cross-linking density.30 The Tg of the samples was investigated in temperature range 150–250 °C base on DSC curves. It is observed that the Tg of neat epoxy is 191.7 °C. While the Tg of the T-ZnO/epoxy and ZnO/epoxy is 215.7 °C and 201.9 °C, respectively. The Tg of the ZnO/epoxy and T-ZnO/epoxy composite is increased by 10.2 °C and 24.0 °C, respectively in compared with neat epoxy. The glass transition temperatures is shifted to higher temperature with the addition of T-ZnO and ZnO MPs into the epoxy matrix indicating that a strong interface by reacting with matrix molecules during curing process. This creates more barriers to restrict the motion of macromolecular chain, leading to the higher Tg and promoting thermal stability. The positive effect can also be found from TGA and DMA curves of epoxy composites, as shown in Fig. S4 and S5.† Fig. S5a† shows storage modulus of neat epoxy and its composites at 50 wt%. Meanwhile, the results show that storage modulus of neat epoxy and composites is in the order of neat epoxy < ZnO/epoxy < T-ZnO/epoxy under the same temperature. Two reasons may account for the enhancement in the storage modulus. First, the applied stresses are expected to be easily transferred from the matrix onto the hybrid fillers due to the high surface area of hybrid fillers. Second, the strong covalent bonding formation between hybrid fillers and epoxy matrix reduced the mobility of the local matrix during the process of epoxy curing reaction.31,32 The tan delta of epoxy composites in Fig. S5b† is also consistent with the glass transition temperatures.
 | ||
| Fig. 7 Neat epoxy and epoxy composites: (a) DSC curves, (b) CTE curves; comparison of (c) thermal conductivity versus CTE and (d) TDP of the T-ZnO/epoxy and ZnO/epoxy composites with various engineering materials. | ||
In addition, the coefficient of thermal expansion (CTE) of polymer composites is important for electronic packaging. Fig. 7b shows CTE results of neat epoxy and epoxy composites with 50 wt% filler. All the curves show a slowly increase after the temperature upgrades from 360 K. In addition, the T-ZnO/epoxy composite shows lower slope and maintains the slope up to 460 K, which is lower than that of ZnO/epoxy composite in any temperature. Packaging materials with lower CTE value is expected to have lower thermal strain, which will find potential application as heating sinks structural material with improved thermal properties. Furthermore, compared with other particles in epoxy composites, we noticed that the CTE of our samples are much lower as shown in Fig. 7c. The CTE of T-ZnO/epoxy composites at 50 wt% loading and room temperature is 27.9 ppm K−1, compared to conventional epoxy based composites, which is the lower CTE value.33–38 Also, this outstanding performance combining with high thermal conductivity result in lower TDP, which is a prominent indicator at the engineering-scale and be defined as following eqn (1)
 | (1) |
TDP is a prominent indicator of the temperature-induced distortion in a material in applications such as metrology, optics and high-precision engineering.39 As shown in Fig. 7d, the lower TDP of composite predicts greater thermal stability, on account of the high thermal conductivity and low CTE of the T-ZnO/epoxy composite, because the efficient conductance pathway formed by the T-ZnO play an important role in determining the thermal stability.40 Polymer composites with high thermal conductivity and low TDP would have application prospects in the field of LED, CPU and so on.
4. Conclusions
In summary, a facile method to prepare epoxy composites has been demonstrated. The epoxy composite filled by T-ZnO fillers has the superior thermal property in comparison to ZnO MPs. The thermal conductivity of T-ZnO/epoxy with 50 wt% filler was 4.38 W m−1 K−1, which is enhanced 1817% compared to that of neat epoxy. It is found that T-ZnO/epoxy composite retains the low coefficient of thermal expansion. This strategy meets the requirement for the rapid development of advanced electronic packaging.5. Author contributions
Zhenyu Zhang and Jinhong Yu supervised the projects. Liangchao Guo and Ruiyang Kang carried out the experiments. Jinhong Yu, Liangchao Guo, Ruiyang Kang, Yapeng Chen, Xiao Hou, Yuming Wu, Mengjie Wang, Bo Wang, Junfeng Cui, Nan Jiang and Cheng-Te Lin analyzed the mechanism and thermal properties. All authors discussed the results and commented on the manuscript.Conflicts of interest
There are no conflicts to declare.Acknowledgements
We would like to acknowledge the financial support from National Natural Science Foundation of China (51422502, 51573201 and 51621064), Changjiang Scholar Program of Chinese Ministry of Education, the Xinghai Science Funds for Distinguished Young Scholars and Thousand Youth Talents at Dalian University of Technology, the Natural Science Foundation of Jiangsu Province (BK20151190), the Tribology Science Fund of State Key Laboratory of Tribology (SKLTKF17B19), Tsinghua University, the Distinguished Young Scholars for Science and Technology of Dalian City (2016RJ05), and Public Welfare Project of Zhejiang Province (2016C31026).References
- G. W. Lee, M. Park, J. Kim, J. I. Lee and H. G. Yoon, Composites, Part A, 2006, 37, 727–734 CrossRef.
- J. Wang and X. Yi, Compos. Sci. Technol., 2004, 64, 1623–1628 CrossRef CAS.
- R. F. Hill and P. H. Supancic, J. Am. Ceram. Soc., 2002, 85, 851–857 CrossRef CAS.
- D. Yan, X. Li, Y. Jiang, H. B. Zhang and B. B. Jia, Mater. Lett., 2014, 118, 212–216 CrossRef CAS.
- J. F. Fu, L. Y. Shi, Q. D. Zhong, Y. Chen and L. Y. Chen, Polym. Adv. Technol., 2011, 22, 1032–1041 CrossRef CAS.
- Z. Liu and C. X. Xiong, Polym. Mater.: Sci. Eng., 2009, 25, 165–167 Search PubMed.
- Y. Wu, Y. Cao, X. Xiao, Z. Liu, M. Wang, N. Jiang, X. Wu, C.-T. Lin and J. Yu, Fibers Polym., 2017, 18, 1180–1186 CrossRef CAS.
- H. Ishida and S. Rimdusit, Thermochim. Acta, 1998, 320, 177–186 CrossRef CAS.
- M. J. Maria, S. Balanand, S. Anas, A. P. Mohamed and S. Ananthakumar, Mater. Des., 2016, 92, 387–396 CrossRef.
- K. Wang, W. Li, J. Du, P. Tang and J. Chen, Mater. Des., 2016, 99, 303–313 CrossRef CAS.
- A. Dmytruk, I. Dmitruk, Y. Shynkarenko, R. Belosludov and A. Kasuya, RSC Adv., 2017, 7, 21933–21942 RSC.
- S. Rackauskas, O. Klimova, H. Jiang, A. Nikitenko, K. A. Chernenko, S. D. Shandakov, E. I. Kauppinen, O. V. Tolochko and A. G. Nasibulin, J. Phys. Chem. C, 2015, 119, 16366–16373 CAS.
- L. Shen, H. Zhang and S. Guo, Mater. Chem. Phys., 2009, 114, 580–583 CrossRef CAS.
- J. Z. Liang and G. S. Liu, J. Mater. Sci., 2009, 44, 4715–4720 CrossRef CAS.
- F. Y. Yuan, H. B. Zhang, X. Li, X. Li and Z. Z. Yu, Composites, Part A, 2013, 53, 137–144 CrossRef CAS.
- S. Nie, X. Zhang, J. Luo, Y. Liu and W. Yan, Polym. Compos., 2017, 38, 1–8 CrossRef.
- Y. Jiang, R. Sun, H. B. Zhang, P. Min, D. Yang and Z. Z. Yu, Composites, Part A, 2017, 94, 104–112 CrossRef CAS.
- Z. Zhou, L. Chu and S. Hu, Mater. Sci. Eng., B, 2006, 126, 93–96 CrossRef CAS.
- C. W. Nan, Z. Shi and Y. Lin, Chem. Phys. Lett., 2003, 375, 666–669 CrossRef CAS.
- A. B. Djurišić, W. C. H Choy, V. A. L. Roy, Y. H. Leung, C. Y. Kwong, K. W. Cheah, T. K. G. Rao, W. K. Chan, H. F. Lui and C. Surya, Adv. Funct. Mater., 2004, 14, 856–864 CrossRef.
- G. Lian, C. C. Tuan, L. Li, S. Jiao, Q. Wang, K. S. Moon, D. Cui and C. P. Wong, Chem. Mater., 2016, 28, 6096–6104 CrossRef CAS.
- A. C. Ferrari, J. C. Meyer, V. Scardaci, C. Casiraghi, M. Lazzeri, F. Mauri, S. Piscanec, D. Jiang, K. S. Novoselov, S. Roth and A. K. Geim, Phys. Rev. Lett., 2006, 97, 187401 CrossRef CAS PubMed.
- C. Casiraghi, S. Pisana, K. S. Novoselov, A. K. Geim and A. C. Ferrari, Appl. Phys. Lett., 2007, 91, 233108 CrossRef.
- A. Prakash and D. Bahadur, ACS Appl. Mater. Interfaces, 2014, 6, 1394–1405 CAS.
- H. Xu and D. Pasini, Sci. Rep., 2016, 6, 34924 CrossRef CAS PubMed.
- R. Agarwal, N. S. Saxena, K. B. Sharma, S. Thomas and M. S. Sreekala, J. Appl. Polym. Sci., 2003, 89, 1708–1714 CrossRef CAS.
- A. K. Collins, M. A. Pickering and R. L. Taylor, J. Appl. Phys., 1990, 68, 6510–6512 CrossRef CAS.
- D. Hands, K. Lane and R. P. Sheldon, J. Polym. Sci., Part A: Polym. Chem., 1973, 42, 717–726 Search PubMed.
- Y. Cao, M. Liang, Z. Liu, Y. Wu, X. Xiong, C. Li, X. Wang, N. Jiang, J. Yu and C.-T. Lin, RSC Adv., 2016, 6, 68357–68362 RSC.
- H. Jin, C. Zhao, J. Chen and Y. Zhang, Plast. Sci. Technol., 2010, 38, 73–76 Search PubMed.
- V. Goyal and A. A. Balandin, Appl. Phys. Lett., 2012, 100, 073113 CrossRef.
- N. Tagami, M. Hyuga, Y. Ohki, T. Tanaka, T. Imai, M. Harada and M. Ochi, IEEE Trans. Dielectr. Electr. Insul., 2010, 17, 214–220 CrossRef CAS.
- P. N. Patil, S. K. Rath, S. K. Sharma, K. Sudarshan, P. Maheshwari, M. Patri, S. Praveen, P. Khandelwal and P. K. Pujari, Soft Matter, 2013, 9, 3589–3599 RSC.
- C. Zeng, S. Lu, L. Song, X. Xiao, J. Gao, L. Pan, Z. He and J. Yu, RSC Adv., 2015, 5, 35773–35782 RSC.
- Y. Shimazaki, Y. Miyazaki, Y. Takezawa, M. Nogi, K. Abe, S. Ifuku and H. Yano, Biomacromolecules, 2007, 8, 2976–2978 CrossRef CAS PubMed.
- M. Abdalla, D. Dean, M. Theodore, J. Fielding, E. Nyairo and G. Price, Polymer, 2010, 51, 1614–1620 CrossRef CAS.
- D. Shen, Z. Zhan, Z. Liu, Y. Cao, L. Zhou, Y. Liu, W. Dai, K. Nishimura, C. Li, C.-T. Lin, N. Jiang and J. Yu, Sci. Rep., 2017, 7, 2606 CrossRef PubMed.
- S. Wang, M. Tambraparni, J. Qiu, J. Tipton and D. Dean, Macromolecules, 2009, 42, 5251–5255 CrossRef CAS.
- Z. Lin, Y. Liu, S. Raghavan, K. Moon, S. K. Sitaraman and C. Wong, ACS Appl. Mater. Interfaces, 2013, 5, 7633–7640 CAS.
- C. Subramaniam, Y. Yasuda, S. Takeya, S. Ata, A. Nishizawa, D. Futaba, T. Yamada and K. Hata, Nanoscale, 2014, 6, 2669–2674 RSC.
Footnote |
| † Electronic supplementary information (ESI) available. See DOI: 10.1039/c8ra01470a |
| This journal is © The Royal Society of Chemistry 2018 |