 Open Access Article
The effect of sintering process on lithium ionic conductivity of Li6.4Al0.2La3Zr2O12 garnet produced by solid-state synthesis
Wenjuan Xue ab,
Yaping Yangb,
Qiaoling Yangc,
Yuping Liua,
Lian Wangb,
Changguo Chen*a and
Renju Chengb
aCollege of Chemistry and Chemical Engineering, Chongqing University, Chongqing 401331, China. E-mail: cgchen@cqu.edu.cn; Fax: +86 23 65678934; Tel: +86 23 65678934
bChongqing Research Center for Advanced Materials, Chongqing Academy of Science and Technology, Chongqing 401123, China
cSchool of Materials Science and Engineering, Sichuan University of Science and Engineering, Zigong 643000, China
First published on 9th April 2018
Abstract
Recently, solid-state electrolyte lithium lanthanum zirconium oxide garnet (Li7La3Zr2O12, LLZO) has attracted great attention due to its high room temperature conductivity of lithium ions and stability against lithium metal electrodes. The Al-doped cubic garnet Li6.4Al0.2La3Zr2O12 was synthesized by a conventional solid-state method at different sintering temperatures. The influence of the sintering process on the structure and ionic conductivity was investigated by X-ray diffraction, electrochemical impedance spectroscopy, and scanning electron microscopy. The results showed that Li vaporization and relative density were affected by the sintering process. The synergistic effects of Li concentration and relative density determined the Li+ ionic conductivity. Compared with the relative density, the Li concentration plays a more important role in determining the ionic conductivity via the solid-state method.
1. Introduction
Although traditional lithium-ion batteries with liquid electrolytes have been widely applied in consumer electronics and power sources, further development and improvement is difficult due to problems encountered such as poor safety, limited voltage, lower energy density, and poor cycling performance. Solid-state lithium batteries (SSLiBs) provide potential solutions compared with the liquid lithium-ion batteries. Solid-state electrolytes (SSEs) are the key factor for development of SSLiBs.1 Thus, different types of ceramic electrolytes with ionic conductivity similar to liquid electrolytes are used for realizing SSLiBs, such as Li3N,2 LiPON, LISICON-type sulfides,3 NASICON-type phosphates,4 perovskite-type titanates,5 and Li7La3Zr2O12 (lithium lanthanum zirconium oxide, LLZO) garnets.6 Among them, LLZO has been widely studied because of high lithium-ion conductivity and good electrochemical and chemical stability against lithium metal electrode. Murugan et al.7 first reported cubic LLZO and Geiger et al.8 investigated its crystal chemical and structural properties. Up to now, three different structural forms for LLZO have been reported, the high temperature (HT) cubic phase with the Ia![[3 with combining macron]](https://www.rsc.org/images/entities/char_0033_0304.gif) d space group,9 the tetragonal structure with the I41/acd space group,10 and the low temperature (LT) cubic.11,12 The tetragonal structure is easily obtained at lower sintering temperature (approximately 700–900 °C) by solid-state synthesis without doping and liquid-state methods. However, it shows lower ionic conductivity by two orders of magnitude as compared to the HT cubic phase, which cannot meet the demand for solid-state electrolytes. In addition, the low temperature (LT) cubic is less known and studied due to the low lithium ion conductivity and instability above 800 °C. The lithium ionic conductivity of HT cubic garnet LLZO is approximately 10−4 S cm−1, and its high conductivity is dependent upon the high sintering temperature (approximately 1100–1300 °C) and stable cubic structure. Generally, it is difficult to stabilize the HT cubic phase without element doping, using such elements as Al, Ta,13 Nb,14 and Ga. The Al ion is specifically doped to stabilize the cubic structure intentionally added or resulting from contamination during sintering processing. Chen et al.15 also found that Al can be a sintering aid facilitating densification.
d space group,9 the tetragonal structure with the I41/acd space group,10 and the low temperature (LT) cubic.11,12 The tetragonal structure is easily obtained at lower sintering temperature (approximately 700–900 °C) by solid-state synthesis without doping and liquid-state methods. However, it shows lower ionic conductivity by two orders of magnitude as compared to the HT cubic phase, which cannot meet the demand for solid-state electrolytes. In addition, the low temperature (LT) cubic is less known and studied due to the low lithium ion conductivity and instability above 800 °C. The lithium ionic conductivity of HT cubic garnet LLZO is approximately 10−4 S cm−1, and its high conductivity is dependent upon the high sintering temperature (approximately 1100–1300 °C) and stable cubic structure. Generally, it is difficult to stabilize the HT cubic phase without element doping, using such elements as Al, Ta,13 Nb,14 and Ga. The Al ion is specifically doped to stabilize the cubic structure intentionally added or resulting from contamination during sintering processing. Chen et al.15 also found that Al can be a sintering aid facilitating densification.
The solid-state method was most frequently used to obtain LLZO due to its simplicity in processing and mass production. However, the evaporation of lithium by high temperature sintering should still not be neglected because it is a critical factor that influences the lithium ion conductivity of LLZO. Additionally, the higher sintering temperature can increase the relative density. It is necessary to balance these two factors with the solid-state method.
Previous studies focuses on the effect of the sintering temperature15 or lithium concentration16 on ionic conductivity independently, but there are few researches which consider the relationship between them. The sintering temperature is vary with different researchers, so it is difficult to make it uniform. Moreover, the Li concentration is affected by the sintering process, including sintering temperature, the amount of mother powder, sintering time, and so on. In the present work, the synergistic effect of lithium concentration and relative density on the ionic conductivity was investigated. Instruction is provided for synthetizing Al-doped LLZO with high ionic conductivity. To produce cubic garnet LLZO using solid-state or high temperature solution-based syntheses, a minimum amount of Al (>0.5 wt%) is necessary as well as one-step calcination at 1000 °C or above.16,17 This work was followed by one-step sintering to prepare Li6.4Al0.2La3Zr2O12 using commercially desirable and more reliable procedures.
2. Experiments
2.1 Material synthesis
The nominal chemical formula Li6.4Al0.2La3Zr2O12 compounds were produced by the solid-state method, using stoichiometric amounts of Li2CO3, La2O3 (heated at 900 °C for 10 h), ZrO2, and Al2O3. An excessive amount of 10 wt% Li2CO3 was mixed to compensate for the lithium evaporation during the sintering process. The raw materials were mixed through ball milling with zirconia balls for 20 h in isopropanol in air, and then dried at 65 °C. The obtained powder was calcined at 900 °C for 10 h, reground, and then ball-milled for another 20 h with 1 wt% polyvinyl butyral (PVB). Finally, the mixed powder was pressed into pellets with 12.7 mm diameter at 160 MPa, followed by sintering in the temperature range of 1100–1230 °C with different sintering times (10 h, 15 h, and 20 h). Table 1 shows the naming convention for all samples that will be used for the rest of this study. The pellets were sandwiched between two layers of the same powders in a small MgO crucible to suppress potential volatilization of Li2O during the preparation.| Sample denotation | Sintering conditions | Li atomic ratio | Al atomic ratio | Relative densitya (%) | a (Å) |
|---|---|---|---|---|---|
| a Theoretical density obtained from XRD results is 5.257 g cm−3. | |||||
| LLZALO-1 | 1100 °C × 20 h | 6.25 | 0.13 | 87.5 | 12.97131(9) |
| LLZALO-2 | 1150 °C × 20 h | 5.69 | 0.15 | 87.9 | 12.97159(9) |
| LLZALO-3 | 1200 °C × 20 h | 5.47 | 0.15 | 92.0 | 12.96794(7) |
| LLZALO-4 | 1210 °C × 15 h | 6.11 | 0.15 | 91.2 | 12.96529(8) |
| LLZALO-5 | 1220 °C × 10 h | 5.88 | 0.14 | 94.0 | 12.96800(7) |
2.2 Material characterizations
The X-ray diffraction (XRD) patterns were recorded using an X-ray diffractometer (X'Pert3 Powder) with Cu-Kα radiation (λ = 0.154178 nm) in the 2θ range of 10–80° with a scanning rate of 4.2° min−1. Cu-Kα radiation was obtained from a copper X-ray tube operated at 40 kV and 40 mA. JCPDS files were used to identify the crystalline phases, and the lattice parameters were obtained from Rietveld refinement. The morphology of the obtained pellets was observed by scanning electron microscopy (SEM, ZEISS EVO18). The relative densities of the obtained ceramic pellets were measured at 22 °C using the Archimedes' principle and alcohol as the immersion medium. The theoretical density of samples was calculated from the lattice parameters determined by XRD. The amounts of lithium and aluminium were measured by inductively coupled plasma optical emission spectroscopy (ICP-OES, ICPA6300). The sample was dissolved in aqua regia at 100 °C for 12 h in an enclosed autoclave. After many trials, analytical results with good reproducibility were obtained.The ionic conductivity was measured with a CHI650D impedance analyzer while the frequency ranged within 10 Hz to 1 MHz at an AC amplitude of 5 mV. Z-view software was employed for data analysis. To test the ionic conductivity, a thin film of Ag was pasted on both sides of the polished pellets, which were then dried at 125 °C for 15 min following curing at 850 °C for 10 min. The samples then were loaded into a spring-loaded Swagelok cell with stainless steel electrodes. The ionic conductivity tests were carried out in the temperature range of 298–373 K. To ensure the accuracy during testing, the cells were equilibrated for 30 min at the corresponding test temperature before each test.
3. Results
The XRD patterns collected from the pellets crushed into powders are presented in Fig. 1(a). All samples mainly showed similar results, and the corresponding diffraction peaks were indexed as a cubic garnet-like structure (PDF#45-0109). It was difficult to observe the peaks corresponding to the tetragonal phase, which is evident by the following analysis using the Rietveld refinement. That result was also unable to detect the tetragonal phase. Therefore, it suggests that the amount of this phase, if it exists, is below the detection limit of XRD. This result was in agreement with that of the Al-stabilized cubic phase reported by previous studies.8,15,18 Rietveld refinements of XRD data were conducted on the basis of a garnet-like crystal structure with the Ia![[3 with combining macron]](https://www.rsc.org/images/entities/char_0033_0304.gif) d space group for cubic samples. Fig. 1(b) shows the Rietveld refinement of the XRD pattern for the sample LLZALO-4. The final Bragg-R factor (R = 3.477) indicated a good refinement. The lattice parameters of these samples with different sintering temperatures are listed in Table 1. As can be seen, the refined unit cell parameter is in the range of 12.96529(8)–12.97159(9) Å, which is slightly different as compare to that of the LLZO phase reported by Murugan (a = 12.9682(6) Å)7 and Geiger (a = 12.9751(1) Å).8 The atomic coordinates are listed in Table 2. It is difficult to fix the occupancy values of Li by Rietveld refinement analysis.19 In addition, Al ion was not taken into account in Rietveld refinements because it is difficult to determine its position in the lattice by XRD.
d space group for cubic samples. Fig. 1(b) shows the Rietveld refinement of the XRD pattern for the sample LLZALO-4. The final Bragg-R factor (R = 3.477) indicated a good refinement. The lattice parameters of these samples with different sintering temperatures are listed in Table 1. As can be seen, the refined unit cell parameter is in the range of 12.96529(8)–12.97159(9) Å, which is slightly different as compare to that of the LLZO phase reported by Murugan (a = 12.9682(6) Å)7 and Geiger (a = 12.9751(1) Å).8 The atomic coordinates are listed in Table 2. It is difficult to fix the occupancy values of Li by Rietveld refinement analysis.19 In addition, Al ion was not taken into account in Rietveld refinements because it is difficult to determine its position in the lattice by XRD.
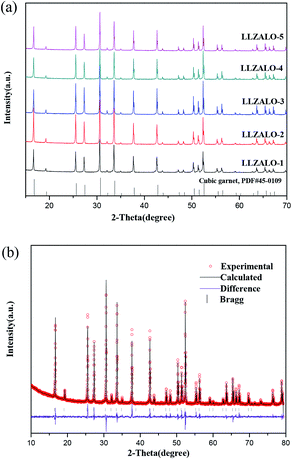 | ||
| Fig. 1 (a) XRD patterns of pellets crushed into powders and (b) XRD Rietveld pattern for the LLZALO-4 sample. Vertical bars denote the corresponding the Bragg reflection positions. | ||
![[3 with combining macron]](https://www.rsc.org/images/entities/char_0033_0304.gif) d, a = 12.96529(8); Rp: 2.895; Rexp: 1.956; Rwp: 4.105; GOF: 2.099, Rbragg: 3.477
d, a = 12.96529(8); Rp: 2.895; Rexp: 1.956; Rwp: 4.105; GOF: 2.099, Rbragg: 3.477
| Atom | Site | x | y | z |
|---|---|---|---|---|
| La | 24d | 0.125 | 0 | 0.25 |
| Zr | 16a | 0 | 0 | 0 |
| O | 96h | 0.97808 | 0.048 | 0.147 |
The measurement results of the relative density are listed in the Table 1. The relative density increased with increasing sintering temperature except for the LLZALO-4. It is reasonable that shortened sintering time reduced the density for LLZALO-4 compared with other samples. The results of chemical compositions for the obtained samples are summarized in Table 1. The La atomic ratio was fixed to 3 per formula unit due to the La concentration exceeding the measured limits in a blank test. It can be seen that the Li concentration is 11% lower than the theoretical quantity in the pellet even at 1100 °C, indicating that it is still necessary to perform Li evaporation. Obviously, the evaporation of Li accelerated when the sintering temperature was elevated. For LLZALO-4, the Li loss was moderate because the sintering time was decreased. The same trend occurred as that which was observed for the relative density of LLZALO-4. The Al concentration is almost the same for all sintered pellets, at approximately 0.14 per formula units.
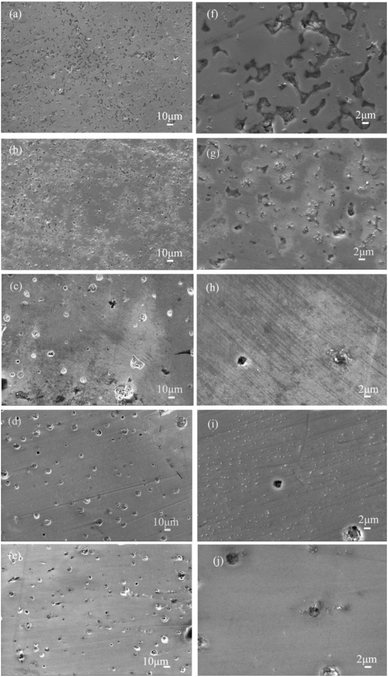
The influence of the sintering process on the relative density can also be observed from the SEM micrographs shown in Fig. 2.
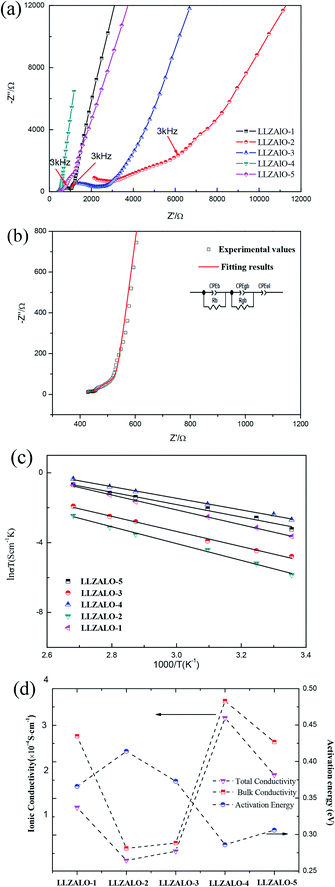
The ionic conductivity of the samples was measured using impedance spectroscopy. Fig. 3(a) shows Nyquist profiles for sintered pellets at different processes at room temperature (25 °C). The typical impedance plot is composed of part of a semicircle in the high-frequency range, intermediate-frequency flattened semicircle, and a spike below 3 kHz. The first incomplete semicircle corresponds to the bulk resistance, and the second flattened semicircle presents the grain-boundary resistance. The low-frequency spike is the contribution of the electrode. Fitting was based on the equivalent circuit (shown in the inset of Fig. 3(b)) consisting of (RbCPEb) (RgbCPEgb) (CPEel) components using the Zview software, where R stands for the resistance, CPE is the abbreviation for the constant phase element, and their subscripts “b”, “gb”, and “el” refer to the bulk, grain-boundary, and electrode contribution, respectively.
For LLZALO-1, LLZALO-2, and LLZALO-5, the impedance plots showed a short arc below 3 kHz, which can be attributed to the electrode effect. The ionic conductivity of samples at 25 °C is listed in Table 3. Among the investigated samples, the highest total ionic conductivity of 2.10 × 10⁻⁴ S cm−1 was observed for LLZAO-4, which is comparable to the total ionic conductivity values for only Al-doped cubic LLZO. The lowest conductivity was 1.54 × 10⁻⁵ S cm−1 for LLZALO-2 with sintering at 1150 °C. Arrhenius plots for the total electrical conductivity of LLZALO are shown in Fig. 3(c). The Arrhenius equation was used to calculate the activation energy Ea:
 | (1) |
| Sample | σtotal298 K (S cm−1) | σbulk298 K (S cm−1) | Ea (eV) | Rgb/Rtotal |
|---|---|---|---|---|
| LLZALO-1 | 8.78 × 10⁻⁵ | 1.85 × 10⁻⁴ | 0.366 | 0.52 |
| LLZALO-2 | 1.54 × 10⁻⁵ | 3.19 × 10⁻⁵ | 0.414 | 0.49 |
| LLZALO-3 | 2.80 × 10⁻⁵ | 3.91 × 10⁻⁵ | 0.373 | 0.28 |
| LLZALO-4 | 2.10 × 10⁻⁴ | 2.33 × 10⁻⁴ | 0.286 | 0.11 |
| LLZALO-5 | 1.32 × 10⁻⁴ | 1.77 × 10⁻⁴ | 0.306 | 0.26 |
The results show that the Ea values fell in the range of 0.286–0.414 eV. Such a high variation with different samples suggests a strong influence of transport properties on the microstructure. Fig. 3(d) shows the total conductivity and bulk conductivity for samples. It can be seen that the value of Rgb/Rtotal decreased with the increase of the sintering temperature, except that LLZALO-4 is the lowest. From Fig. 3(d), it also can be seen that the activation energy and ionic conductivity are correlated with each other, and the samples with a higher ionic conductivity had lower activation energy and vice versa. The lower activation energy suggests the higher-level disorder of lithium ions, which enables greater enhancement of the mobility of lithium ions.21
4. Discussion
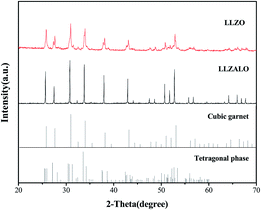
When 0.2 mol Al was added to the LLZO, all samples exhibited a cubic phase, which is consistent with previous results reporting that Al element plays a critical role in the stabilization of the cubic phase (Fig. 4). The atomic values for Li and Al are provided for comparison. The results show that the reduced sintering temperature and shortened time results in lower lithium evaporation, hence, the higher Li concentration in sintered pellets. Rangasamy et al.16 suggested that the lower lithium evaporation should lead to higher conductivity and a corresponding lower activation energy. Higher sintering temperature, on the contrary, yielded higher density and improved the ionic conductivity. The cross-section of the pellets sintered at higher temperature shows much greater density than that of lower temperature, while the difference was not obvious when the sintering temperature reached 1200 °C. The effectiveness of sintering temperature during the densification process is clearly demonstrated.The conductivity of a material with multiple conducting species is given by
| σ = nizieμi | (2) |
The Li+ mobility at 24d sites is characterized by a powerful jumping capability that mainly determines the bulk conductivities of garnet-type electrolytes.22 This intrinsic structure dominated the Li+ mobility. The XRD results showed that all the samples exhibited the same cubic structure and similar lattice parameters. The effects of structure on ionic conductivity can be attributed to the Li concentration, which affects lithium ionic conductivity by changing the Li+ occupational and positional disorder in the grain. From the results of ICP-OES, the lithium concentrations of the samples decrease with the increasing sintering temperature at the same sintering time, while the sintering time has a reverse effect on those parameters. It is indicated that the volatilization of lithium can be governed by regulating the sintering process. Therefore, in the current study, the ion conductivity is determined by the synergistic effect of Li concentration and relative density.
Previous studies showed that the Li concentration is often less than 7 per formula units when obtaining high-conductivity LLZO.23–25 The Li concentration in the present work is at a range of 5.47 to 6.25 per formula units, which is the proper Li concentration and has a direct influence on the lithium ionic conductivity. However, higher sintering temperature yielded slightly higher relative density. The dense microstructure with higher relative density is expected to increase the total lithium ion conductivity by decreasing the grain-boundary resistance. Furthermore, it is expected to suppress the formation of lithium dendrite on the lithium metal electrode. Fig. 5 shows the synergistic effect of Li concentration and relative density on ionic conductivity. It can be seen that the range of change for Li concentration is 12%, which is larger than that of the relative density, 4.9%. It is the mutual restriction of both Li concentration and relative density that affects ionic conductivity. The change of Li concentration is more sensitive to that of sintering temperature, indicating that Li concentration is more effective at altering ionic conductivity than the relative density, especially at higher sintering temperature. The influence of Li concentration on ionic conductivity was investigated by Zhang et al.26 through the hot pressing method, which can maintain the same relative density. The detailed relationship of these parameters is still being investigated.
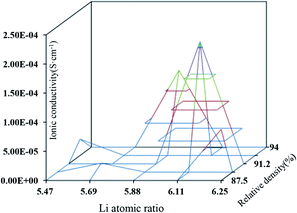 | ||
| Fig. 5 The schematic illustration of the synergistic effect of the relative density and Li concentration. | ||
The samples with a higher ionic conductivity had lower activation energy and vice versa. This was not surprising, as the microstructure affected both ionic conductivities and activation energies. In this study, these samples showed lower activation energies than the reported values for the Al-doped LLZO (0.32–0.40 eV), which suggests the occurrence of facile Li+ transport in them that is attributed to the excellent sintering property of the ceramic pellets, and this can be verified by SEM and relative density results. From the above results, it can be conclude that Li concentration plays a significant role in enhancing the lithium ionic conductivity for Al stabilized cubic LLZO. For LLZALO-4, the high ionic conductivity and low activation energy may be attributed to two interconnected factors: the Al-doped effect, and the synergistic effect of Li concentration and relative density. Firstly, LLZALO-4 exhibited the pure cubic garnet structure with Al doped at 0.2 mol. Secondly, because LLZALO-1 has the highest lithium concentration and the lowest density, the increased resistance limited the mobility of Li+. Hence, the lithium concentration and relative density are like two sides of a balance. For LLZALO-4, the ionic conductivity reaches a maximum because lithium concentration and relative density maintain their equilibrium.
5. Conclusions
The nominal Li6.4Al0.2La3Zr2O12 with lithium ionic conductivity of 2.10 × 10⁻⁴ S cm−1 was synthetized by a solid-state method at the sintering temperature of 1210 °C. The relative density is 91.2%. The different sintering process affected the lithium volatilization and relative density. The results show that the synergistic effects of Li concentration and relative density determined the Li+ ionic conductivity. Compared to relative density, Li concentration plays a major role in determining the ionic conductivity via the solid-state method.Conflicts of interest
There are no conflicts to declare.Acknowledgements
This work was supported by the National Science Foundation of China (21406021, 51504052).References
- C. Sun, J. Liu, Y. Gong, D. P. Wilkinson and J. Zhang, Nano Energy, 2017, 33, 363–386 CrossRef CAS.
- W. Li, G. Wu, C. M. Araujo, R. H. Scheicher, A. Blomqvist, R. Ahuja, Z. Xiong, Y. Feng and P. Chen, Energy Environ. Sci., 2010, 3, 1524–1530 CAS.
- N. Kamaya, K. Homma, Y. Yamakawa, M. Hirayama, R. Kanno, M. Yonemura, T. Kamiyama, Y. Kato, S. Hama, K. Kawamoto and A. Mitsui, Nat. Mater., 2011, 10, 682–686 CrossRef CAS PubMed.
- H. Aono, E. Sugimoto, Y. Sadaoka, N. Imanaka and G.-y. Adachi, Chem. Lett., 1991, 20, 1567–1570 CrossRef.
- S. Stramare, V. Thangadurai and W. Weppner, Chem. Mater., 2003, 34, 3974–3990 CrossRef.
- C. K. Chan, T. Yang and J. Mark Weller, Electrochim. Acta, 2017, 253, 268–280 CrossRef CAS.
- R. Murugan, V. Thangadurai and W. Weppner, Angew. Chem., Int. Ed., 2007, 46, 7778–7781 CrossRef CAS PubMed.
- C. A. Geiger, E. Alekseev, B. Lazic, M. Fisch, T. Armbruster, R. Langner, M. Fechtelkord, N. Kim, T. Pettke and W. Weppner, Inorg. Chem., 2011, 50, 1089–1097 CrossRef CAS PubMed.
- J. Awaka, A. Takashima, K. Kataoka, N. Kijima, Y. Idemoto and J. Akimoto, Chem. Lett., 2011, 40, 60–62 CrossRef CAS.
- J. Awaka, N. Kijima, H. Hayakawa and J. Akimoto, J. Solid State Chem., 2009, 182, 2046–2052 CrossRef CAS.
- H. Xie, J. A. Alonso, Y. Li, M. T. Fernandez-Diaz and J. B. Goodenough, Chem. Mater., 2011, 23, 3587–3589 CrossRef CAS.
- H. Xie, Y. Li and J. B. Goodenough, Mater. Res. Bull., 2012, 47, 1229–1232 CrossRef CAS.
- J. L. Allen, J. Wolfenstine, E. Rangasamy and J. Sakamoto, J. Power Sources, 2016, 206, 315–319 CrossRef.
- S. Ohta, T. Kobayashi and T. Asaoka, J. Power Sources, 2011, 196, 3342–3345 CrossRef CAS.
- R. J. Chen, M. Huang, W. Z. Huang, Y. Shen, Y. H. Lin and C. W. Nan, Solid State Ionics, 2014, 265, 7–12 CrossRef CAS.
- E. Rangasamy, J. Wolfenstine and J. Sakamoto, Solid State Ionics, 2012, 206, 28–32 CrossRef CAS.
- H. Buschmann, J. Dolle, S. Berendts, A. Kuhn, P. Bottke, M. Wilkening, P. Heitjans, A. Senyshyn, H. Ehrenberg, A. Lotnyk, V. Duppel, L. Kienle and J. Janek, Phys. Chem. Chem. Phys., 2011, 13, 19378–19392 RSC.
- A. A. Hubaud, D. J. Schroeder, B. Key, B. J. Ingram, F. Dogan and J. T. Vaughey, J. Mater. Chem. A, 2013, 1, 8813–8818 CAS.
- Y. T. Li, J. T. Han, C. A. Wang, H. Xie and J. B. Goodenough, J. Mater. Chem., 2012, 22, 15357–15361 RSC.
- Y. Kim, H. Jo, J. L. Allen, H. Choe, J. Wolfenstine and J. Sakamotok, J. Am. Ceram. Soc., 2016, 99, 1367–1374 CrossRef CAS.
- Y. Matsuda, K. Sakamoto, M. Matsui, O. Yamamoto, Y. Takeda and N. Imanishi, Solid State Ionics, 2015, 277, 23–29 CrossRef CAS.
- D. W. Wang, G. M. Zhong, O. Dolotko, Y. X. Li, M. J. McDonald, J. X. Mi, R. Q. Fu and Y. Yang, J. Mater. Chem. A, 2014, 2, 20271–20279 CAS.
- E. J. Cussen, Chem. Commun., 2006, 412–413 RSC.
- M. P. O'Callaghan and E. J. Cussen, Chem. Commun., 2007, 2048–2050 RSC.
- A. Logeat, T. Koohler, U. Eisele, B. Stiaszny, A. Harzer, M. Tovar, A. Senyshyn, H. Ehrenberg and B. Kozinsky, Solid State Ionics, 2012, 206, 33–38 CrossRef CAS.
- Y. Zhang, F. Chen, R. Tu, Q. Shen, X. Zhang and L. Zhang, Solid State Ionics, 2016, 284, 53–60 CrossRef CAS.
| This journal is © The Royal Society of Chemistry 2018 |

