 Open Access Article
Creative Commons Attribution 3.0 Unported Licence
Ce3+ and Tb3+ doped Ca3Gd(AlO)3(BO3)4 phosphors: synthesis, tunable photoluminescence, thermal stability, and potential application in white LEDs
Bin Li ,
Qi Sun
 ,
Shaoying Wang
 ,
Heng Guo
 and
Xiaoyong Huang
 *
*
Key Lab of Advanced Transducers and Intelligent Control System, Ministry of Education and Shanxi Province, College of Physics and Optoelectronics, Taiyuan University of Technology, Taiyuan 030024, PR China. E-mail: huangxy04@126.com
First published on 9th March 2018
Abstract
Novel blue-green-emitting Ca3Gd(AlO)3(BO3)4:Ce3+,Tb3+ phosphors were successfully synthesized via traditional high temperature solid reaction method. X-ray diffraction, luminescence spectroscopy, fluorescence decay time and fluorescent thermal stability tests have been used to characterize the as-prepared samples. The energy transfer from Ce3+ to Tb3+ ions in the Ca3Gd(AlO)3(BO3)4 host has been demonstrated to be by dipole–dipole interaction, and the energy transfer efficiency reached as high as 83.6% for Ca3Gd0.39(AlO)3(BO3)4:0.01Ce3+,0.6Tb3+. The critical distance was calculated to be 9.44 Å according to the concentration quenching method. The emission colour of the obtained phosphors can be tuned appropriately from deep blue (0.169, 0.067) to green (0.347, 0.494) through increasing the doping concentrations of Tb3+. Moreover, the Ca3Gd0.39(AlO)3(BO3)4:0.01Ce3+,0.6Tb3+ phosphor possessed excellent thermal stability at high temperature, and the emission intensity at 423 K was about 87% of that at 303 K. Finally, the fabricated prototype LED device with a BaMgAl10O7:Eu2+ blue phosphor, CaAlSiN3:Eu2+ red phosphor, Ca3Gd0.39(AlO)3(BO3)4:0.01Ce3+,0.6Tb3+ green phosphor and 365 nm-emitting InGaN chip exhibited bright warm white light. The current study shows that Ca3Gd0.39(AlO)3(BO3)4:0.01Ce3+,0.6Tb3+ can be used as a potential green phosphor for white LEDs.
1. Introduction
During the past decades, inorganic luminescent materials based on rare-earth (RE) ions have attracted many researchers' attention because of their wide applications, such as lighting, displays, lasers, solar cells, sensors and bioimaging.1–19 For lighting, the research on phosphor-converted white light-emitting diodes (pc-WLEDs) is prevalent because they possess many merits, including low electricity consumption, long service life, small volume, non-pollution, and fast response.20 RE ions can emit various different fascinating colours due to their special 4f shell configuration. Through combining different RE ions and controlling their respective concentration, the emission of phosphor can be tuned from violet to red.21–37 Therefore, the use of different RE ions can produce a variety of colour tunable phosphors.38–40 As one important part of RGB (red, green and blue) phosphors for ultraviolet (UV)-pumped WLEDs, green phosphors are always fabricated by Tb3+ ion as its intrinsic green emissions peaking at around 544 nm.41 However, Tb3+ activated phosphors are inefficient because their absorption lines of 4f–4f spin-forbidden transitions are too weak. As a result, researchers introduce Ce3+ ions as a sensitizer to intensify Tb3+ ions absorption. Furthermore, the broad f–d absorption band of Ce3+ ions locate on UV region, which maximally broadens the application of Tb3+ ions.42 But to successfully realize that, not only request Ce3+ and Tb3+ ions but also need a proper host that can influence RE ions luminescent properties.Borates have been proved to be outstanding host materials for inorganic phosphors, because they have many advantages, including high chemical stability, good thermal stability, and low synthetic temperature.43,44 Here in this work, we reported the luminescent properties of novel Ce3+ and Tb3+ co-activated Ca3Gd(AlO)3(BO3)4 phosphors. The crystal structure and the site substitution were investigated to verify the purity of phosphors and clarify the effect of doping on crystal structures. The luminescent performance including excitation, emission spectra, decay time, and chromaticity diagram was discussed to elucidate the luminescent mechanism of doping ions and the energy transfer mechanism between Ce3+ and Tb3+ in the Ca3Gd(AlO)3(BO3)4 host. Moreover, we examined their thermal stability and LED device performance for the practical application.
2. Experimental
A series of Ca3Gd(0.99−x)(AlO)3(BO3)4:0.01Ce3+,xTb3+ (x = 0, 0.02, 0.05, 0.1, 0.2, 0.3, 0.4, 0.5 and 0.6) samples were successfully fabricated via a conventional high-temperature solid-state reaction technique. H3BO3 (analytical reagent), CaCO3 (analytical reagent), Gd2O3 (99.99%), Al2O3 (analytical reagent), Ce(NO3)3·6H2O (99.99%) and Tb(NO3)3·6H2O (99.99%) were used as raw materials. According to the stoichiometric ratio, these raw materials were weighted and ground in an agate mortar to achieve uniformity. In order to compensate the volatilization, the amount of H3BO3 is in excess of 5 wt%. Then, these uniform mixtures were put in the alumina crucibles and sintered at 1100 °C for 4 h in CO atmosphere to reduce the Ce ion into tri-valence ion. After that, the furnace was cooled down naturally to room temperature, and the final products were ground and collected for further characterization.The X-ray diffraction (XRD) patterns of the samples were recorded on a Bruker D8 X-ray diffractometer using Cu Kα radiation ranging with 5–80° at step rate of 0.02°. The morphology properties of the samples were obtained by a field-emission scanning electron microscope (FE-SEM; MAIA3 TESCAN). The room-temperature photoluminescence (PL) and PL excitation (PLE) spectra and luminescence decay lifetimes of phosphors were measured by Edinburgh FS5 spectrometer equipped with a 150 W continued-wavelength Xenon lamp and a pulsed Xenon lamp, respectively. Temperature-dependent PL spectra were recorded by using the same spectrophotometer and detectors equipped with a temperature controller. The internal quantum efficiency (IQE) of the phosphors was measured on an Edinburgh FS5 spectrometer equipped with an integrating sphere coated with BaSO4.
The commercial blue phosphor BaMgAl10O7:Eu2+, red phosphor CaAlSiN3:Eu2+ and our green phosphor Ca3Gd0.39(AlO)3(BO3)4:0.01Ce3+,0.6Tb3+ were mixed with silicone thoroughly, and the obtained phosphor–silicone mixture was coated on the surface of the LED chips to fabricate WLED device. The photoelectric properties of the fabricated devices were measured by using an integrating sphere spectroradiometer system (HAAS-2000, Everfine). The LEDs were operated at 3 V with various driven currents of 20, 60, 120, 180, 240 and 300 mA, respectively. The spectral power distributions of LEDs were measured using a corrected spectrometer to calculate their values of correlated colour temperature (CCT) and colour rendering index (CRI).
3. Results and discussion
3.1 Phase and structure
Fig. 1 shows the XRD patterns of Ca3Gd(AlO)3(BO3)4 and Ca3Gd0.39(AlO)3(BO3)4:0.01Ce3+,0.6Tb3+ phosphors. Obviously, the obtained patterns agreed well with Ca3Y(AlO)3(BO3)4, which can be found in Inorganic Crystal Structure Database (ICSD-172154), suggesting that the compounds were obtained as a single phase.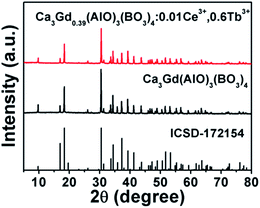 | ||
| Fig. 1 XRD patterns of Ca3Gd0.39(AlO)3(BO3)4:0.01Ce3+,0.6Tb3+ and Ca3Gd(AlO)3(BO3)4 phosphors. The standard data of CYAB (ICSD-172154) was shown. | ||
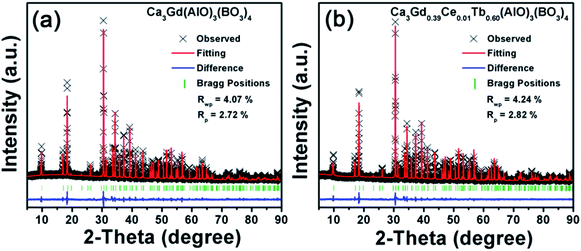
Based on the iso-structure of Ca3Y(AlO)3(BO3)4, the Rietveld refinements of the Ca3Gd(AlO)3(BO3)4 and Ca3Gd0.39(AlO)3(BO3)4:0.01Ce3+,0.6Tb3+ were performed to further analyze the crystal structure details, as shown in Fig. 2. It can be found that Ca3Gd(AlO)3(BO3)4 crystallized in a hexagonal unit cell with space group P63/m, which coincide with Ca3Y(AlO)3(BO3)4. Moreover, crystallographic data and details were summarized in Table 1, and the refined lattice parameters are changed slightly through substituting Y3+(1.075 Å) ions with Gd3+(1.107 Å), Ce3+(1.196 Å) and Tb3+(1.095 Å) ions. It can be attributed to the different radii of these ions.45
| Formula | Ca3Y(AlO)3(BO3)4 | Ca3Gd(AlO)3(BO3)4 | Ca3Gd0.39Ce0.01Tb0.6(AlO)3(BO3)4 |
| Crystal system | Hexagonal | Hexagonal | Hexagonal |
| Space group | P63/m | P63/m | P63/m |
| 2θ-interval,° | 10–90 | 10–90 | 10–90 |
| a (Å) | 10.3877 | 10.4270 | 10.4244 |
| b (Å) | 10.3877 | 10.4270 | 10.4244 |
| c (Å) | 5.6920 | 5.7041 | 5.7035 |
| V (Å3) | 531.91 | 537.07 | 536.75 |
| Rwp (%) | — | 4.07% | 4.24% |
| Rp (%) | — | 2.72% | 2.82% |
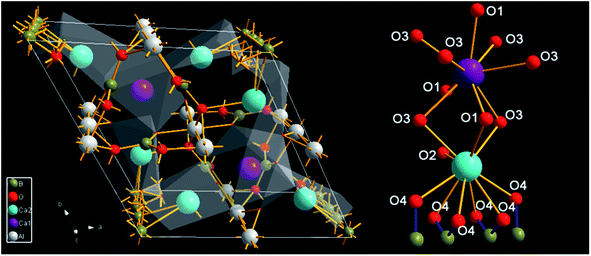
The crystal structure of Ca3Gd(AlO)3(BO3)4 and coordination (CN) environments of Ca2+ sites (Ca1 and Ca2) are depicted in Fig. 3. Clearly, Ca2 sites are surrounded with ten oxygen atoms while Ca1 sites are coordinated with nine oxygen atoms, but the coordinative six oxygen (O4) ions of Ca2 are also shared by the adjacent four B ions. Therefore, the CN sites of Ca1 and Ca2 are 9 and 7, respectively. The above results suggest that Ln3+ (Gd3+, Ce3+ and Tb3+) ions prefer to occupy the Ca1 sites.46
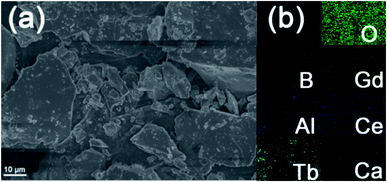
Fig. 4(a) shows the representative FE-SEM image of Ca3Gd0.39(AlO)3(BO3)4:0.01Ce3+,0.6Tb3+ phosphors. As can be seen, the studied sample was made up of irregular and aggregated microparticles with the size ranging from 2 to 10 μm. Besides, the elemental mapping result revealed that the components of Ca, Ga, Al, O, B, Ce and Tb were uniformly distributed over the whole range of particles, as can be seen in Fig. 4(b).
3.2 Photoluminescence properties
Fig. 5(a) shows the PLE and PL spectra of Ca3Gd0.99(AlO)3(BO3)4:0.01Ce3+ phosphor. By monitoring at 402 nm, there were two principle excitation bands in the PLE spectrum: the first one was located in the 250–300 nm region and the second one was located in the range of 300–380 nm with a peak at around 347 nm, originating from 4f → 5d transitions of Ce3+ ions.22 The sharp PLE peak at 276 nm was attributed to the 8S7/2→6I7/2 transition of Gd3+ ions, indicating the energy transfer from Gd3+ to Ce3+ ions in the Ca3Gd0.99(AlO)3(BO3)4:0.01Ce3+ phosphor.47 The PL spectrum was a broad emission band centered at 402 nm, corresponding to the transition from the 5d level to the ground state of the Ce3+ ion.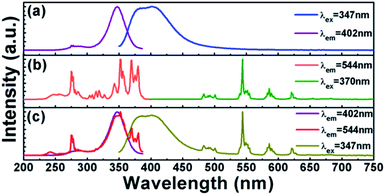 | ||
| Fig. 5 PLE and PL spectra of (a) Ca3Gd0.99(AlO)3(BO3)4:0.01Ce3+, (b) Ca3Gd0.95(AlO)3(BO3)4:0.05Tb3+ and (c) Ca3Gd0.94(AlO)3(BO3)4:0.01Ce3+,0.05Tb3+. | ||
The PLE and PL spectra of the representative phosphor Ca3Gd0.95(AlO)3(BO3)4:0.05Tb3+ were presented in Fig. 5(b). The PLE spectrum was recorded by monitoring with bright green emission at 544 nm, which revealed a series of excitation bands in the range of 230 to 400 nm. The broad PLE band in the range of 230–300 nm was due to the 4f–5d transitions of Tb3+ ions. The PLE peak at 276 nm can be attributed to the 8S7/2 → 6I7/2 transition of Gd3+ ions, indicating the occurrence of energy transfer from Gd3+ to Tb3+ ions.48 In the 300–400 nm wavelength region, a series of PLE peaks were observed, which can be attributed to the 4f–4f electronic transitions of Tb3+ ions, such as 7F6 → 5H7 at 314 nm, 7F6 → 5L7 at 343 nm, 7F6 → 5D2 at 352 nm, 7F6 → 5G6 at 370 and 7F6 → 5D3 at 380 nm. Upon 370 nm excitation, strong green emission was presented in the emission spectrum. The emission peaks at 492, 544, 586, and 622 nm can be assigned to 5D4 → 7FJ (J = 6, 5, 4, 3) transitions, respectively.41
By comparison of the Fig. 5(a) and (b), we can observe the overlap between the emission band of Ce3+ and the f–f excitation of Tb3+, indicating the possible resonance energy transfer from Ce3+ to Tb3+ in Ca3Gd(AlO)3(BO3)4 host. For further identifying it, we measured the PLE and PL spectra of Ce3+ and Tb3+ co-doped sample Ca3Gd0.85(AlO)3(BO3)4:0.01Ce3+,0.05Tb3+, as shown in Fig. 5(c). Clearly, not only the characteristic emission bands of Tb3+ can be observed under excitation at 347 nm, but also the two broad PLE bands of Ce3+ also existed when monitored at 544 nm. The results above show the energy transfer from Ce3+ to Tb3+ truly happened in Ca3Gd(AlO)3(BO3)4 host.
In order to discuss the energy transfer mechanism of Ce3+ → Tb3+, the illustration of electronic transitions of Ce3+ and Tb3+ is depicted in Fig. 6. Under 347 nm excitation, the electrons on Ce3+ ions are excited from ground state (2F7/2) to higher excited state (5d), then some excited electrons return to ground states (2F5/2 and 2F7/2), generating blue emission of Ce3+. Meanwhile other excited electrons transfer part of their energy from Ce3+ 5d level to the excited levels of Tb3+ (5D2) through cross-relaxation, and subsequently, Tb3+ relaxes non-radiatively to the 5D4 level from 5D2 and 5D3 states. Finally, radiative transitions take place through 5D4 → 7FJ (J = 3–6) transitions, giving rise to the characteristic green emissions of Tb3+.
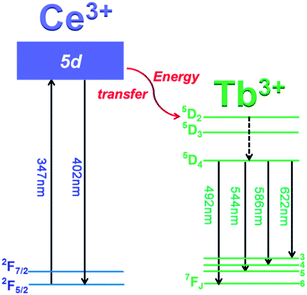 | ||
| Fig. 6 Illustration of energy levels of Ce3+ and Tb3+, and the energy transfer mechanism of Ce3+ → Tb3+. | ||
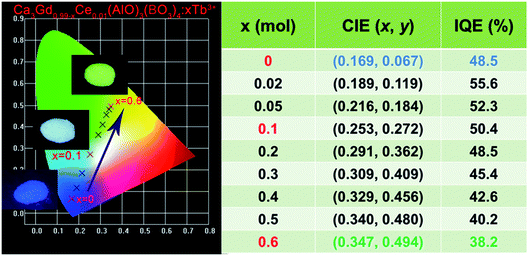
Fig. 7 shows the PL spectra of Ca3Gd(0.99−x)(AlO)3(BO3)4:0.01Ce3+,xTb3+ (x = 0, 0.02, 0.05, 0.1, 0.2, 0.3, 0.4, 0.5 and 0.6) phosphors under excitation at 347 nm. As can be seen, the PL spectra of Ce3+/Tb3+ co-doped Ca3Gd(AlO)3(BO3)4 samples consisted of blue emission band of Ce3+ ions and the characteristic green emission peaks of Tb3+ ions, due to the energy transfer from Ce3+ to Tb3+. Moreover, with increasing Tb3+ concentration from x = 0 to x = 0.6, the emission intensity of Ce3+ ions decreased monotonically, while the emission intensity of Tb3+ ions gradually increased without emission quenching. Interestingly, the emission colour of phosphors can be tuned through increasing Tb3+ concentration, and the corresponding Commission Internationale de L'Eclairage (CIE) chromaticity moved from blue to green, as can be seen in Fig. 8. The digital photos depict a series of the representative Ca3Gd(0.99−x)(AlO)3(BO3)4:0.01Ce3+,xTb3+ (x = 0, 0.1, and 0.6) phosphors under 365 nm lamp. These visual images reflect the high potential of the phosphors as luminescence materials in the blue-green emission range. Besides, the IQEs of the Ca3Gd(0.99−x)(AlO)3(BO3)4:0.01Ce3+,xTb3+ phosphors were also listed in Fig. 8, which can be calculated based on the formula below.49
 | (1) |
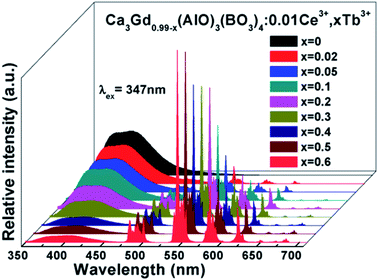 | ||
| Fig. 7 PL spectra of Ca3Gd(0.99−x)(AlO)3(BO3)4:0.01Ce3+,xTb3+ (x = 0, 0.02, 0.05, 0.1, 0.2, 0.3, 0.4, 0.5 and 0.6) phosphors excited at 347 nm. | ||
3.3 Energy transfer mechanism
The decay curves of Ca3Gd(0.99−x)(AlO)3(BO3)4:0.01Ce3+,xTb3+ samples were measured for identifying the energy transfer mechanism, as shown in Fig. 9. The fluorescence average lifetimes τ can be obtained from following formula:
 | (2) |
 | (3) |
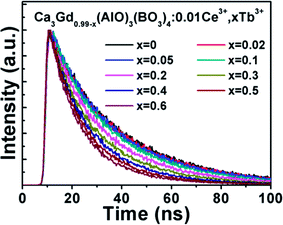 | ||
| Fig. 9 Fluorescence decay curves of Ce3+ in Ca3Gd(0.99−x)(AlO)3(BO3)4:0.01Ce3+,xTb3+ after pulse excitation at 347 nm while monitored at 402 nm. | ||
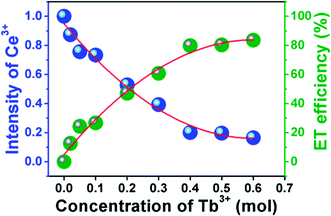 | ||
| Fig. 10 Dependence of Ce3+ emission intensities and energy transfer efficiency on Tb3+ concentration in Ca3Gd(0.99−x)(AlO)3(BO3)4:0.01Ce3+,xTb3+. | ||
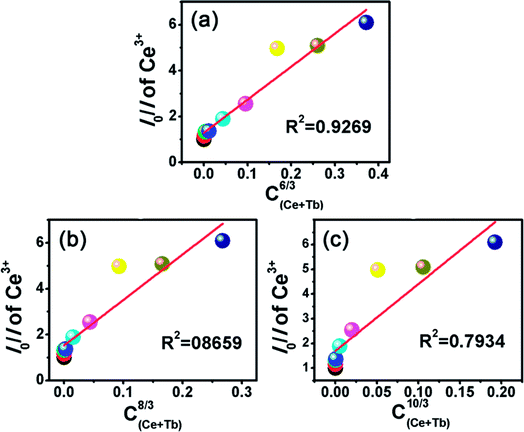
As it is known, the mechanism of energy transfer from Ce3+ to Tb3+ ions can be attributed to exchange interaction or electric multipolar interaction. To figure out which interaction dominated in the energy transfer process, the average distance (Rc) between the Ce3+ donors and Tb3+ acceptor ions in Ca3Gd0.39(AlO)3(BO3)4:0.01Ce3+,0.6Tb3+ phosphor was evaluated by using the following equation:21
 | (4) |
As discussed by many researchers, the multipolar interaction can be further confirmed by using the following formula:38
 | (5) |
3.4 Thermal stability
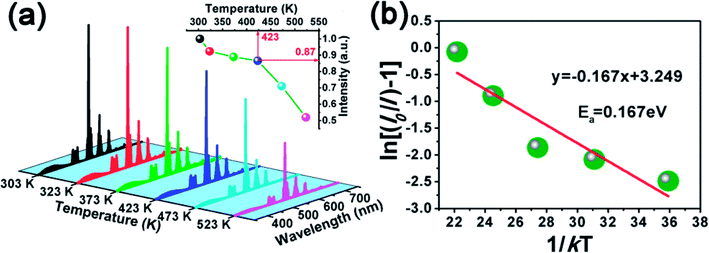
As a very important index, the thermal stability can influence the colour output and brightness of phosphor. Therefore, we measured the temperature-dependent emission spectra of Ca3Gd0.39(AlO)3(BO3)4:0.01Ce3+,0.6Tb3+ sample and the curves were shown in Fig. 12(a). Clearly, with temperature increased from 303 K to 523 K, the emission intensity of Ca3Gd0.39(AlO)3(BO3)4:0.01Ce3+,0.6Tb3+ decreased due to thermal quenching but still maintained the same profiles. Surprisingly, the PL intensity at 423 K was about 87% of that at 303 K, demonstrating that Ca3Gd0.39(AlO)3(BO3)4:0.01Ce3+,0.6Tb3+ phosphor possessed superior thermal stability and thus it suits for fabricating WLEDs.The modified Arrhenius equation was then used to fit the thermal quenching data for activation energy calculation:50
 | (6) |
3.5 Electroluminescence properties of WLEDs fabricated with Ca3Gd0.39(AlO)3(BO3)4:0.01Ce3+,0.6Tb3+
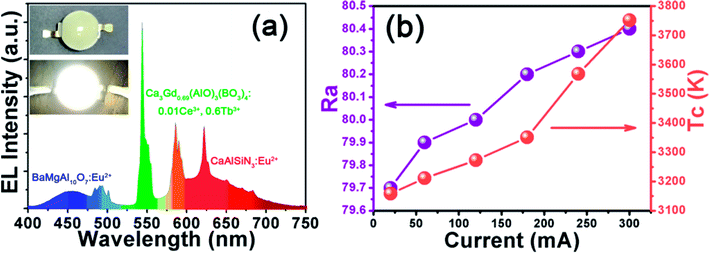
In order to evaluate the potential application of Ca3Gd0.39(AlO)3(BO3)4:0.01Ce3+,0.6Tb3+ phosphor, a WLED lamp was fabricated through the combined use of a NUV chip (365 nm) and BaMgAl10O7:Eu2+ blue phosphor, CaAlSiN3:Eu2+ red phosphor and Ca3Gd0.39(AlO)3(BO3)4:0.01Ce3+,0.6Tb3+ green phosphor driven by a 20 mA current. The electroluminescence (EL) spectrum of such a WLED under the driven current of 20 mA was shown in Fig. 13(a). The bright warm white light can be seen in the inset of Fig. 13(a). The CCT, CRI (Ra), and CIE chromaticity coordinate of this WLED device was measured to be 3158 K, 79.7, and (0.427, 0.401), respectively. The above values of the WLED device under various currents were also measured (see Fig. 13(b)) and there was little variation, which confirmed the stable white light output in the device.4. Conclusions
In summary, we have successfully developed a novel green emitting phosphor for near UV-pumped WLEDs. The energy transfer from Ce3+ to Tb3+ in Ca3Gd(AlO)3(BO3)4 host has been demonstrated to be the dipole–dipole interaction, and the energy transfer efficiency was as high as 83.6% on Ca3Gd0.39(AlO)3(BO3)4:0.01Ce3+,0.6Tb3+. The energy transfer critical distance was calculated to be 9.44 Å according to the concentration quenching method. The emission colour of the obtained phosphors can be tuned appropriately from deep blue (0.169, 0.067) to green (0.347, 0.494) by increasing the contents of Tb3+ ions. Besides, Ca3Gd0.39(AlO)3(BO3)4:0.01Ce3+,0.6Tb3+ phosphor possessed good thermal stability at high temperature, and the emission intensity at 423 K was about 87% of that at 303 K. A prototype LED device was fabricated by using the BaMgAl10O7:Eu2+ blue phosphor, CaAlSiN3:Eu2+ red phosphor and Ca3Gd0.39(AlO)3(BO3)4:0.01Ce3+,0.6Tb3+ green phosphor and 365 nm-emitting InGaN chip, and bright warm white light with CCT (3158 K), CRI (79.7), and CIE chromaticity coordinates (0.427, 0.401) was achieved. These results indicate that the Ca3Gd0.39(AlO)3(BO3)4:0.01Ce3+,0.6Tb3+ sample can be as a promising green-emitting phosphor for UV-based white LEDs.Conflicts of interest
There are no conflicts to declare.Acknowledgements
This work was supported by the National Natural Science Foundation of China (No. 51502190), the Program for the Outstanding Innovative Teams of Higher Learning Institutions of Shanxi, the Start-up Research Grant of Taiyuan University of Technology (No. Tyutrc201489a), the Excellent Young Scholars Research Grant of Taiyuan University of Technology (No. 2014YQ009, 2015YQ006, and 2016YQ03), and the Open Fund of the State Key Laboratory of Luminescent Materials and Devices (South China University of Technology, No. 2017-skllmd-01).References
- W. B. Dai, Y. F. Lei, J. Zhou, M. Xu, L. L. Chu, L. Li, P. Zhao, Z. H. Zhang, W. B. Dai and Y. F. Lei, J. Alloys Compd., 2017, 726, 230–239 CrossRef CAS.
- W. B. Dai, Y. F. Lei, J. Zhou, Y. Zhao, Y. H. Zheng, M. Xu, S. L. Wang and F. Shen, J. Am. Ceram. Soc., 2017, 100, 5174–5185 CrossRef CAS.
- P. Du, X. Huang and J. S. Yu, Inorg. Chem. Front., 2017, 4, 1987–1995 RSC.
- X. Huang, J. Alloys Compd., 2015, 628, 240–244 CrossRef CAS.
- X. Huang, Opt. Lett., 2015, 40, 3599–3602 CrossRef CAS PubMed.
- X. Huang, Dyes Pigm., 2016, 130, 99–105 CrossRef CAS.
- X. Huang, S. Han, W. Huang and X. Liu, Chem. Soc. Rev., 2013, 44, 173–201 RSC.
- X. Y. Huang, X. H. Ji and Q. Y. Zhang, J. Am. Ceram. Soc., 2011, 94, 833–837 CrossRef CAS.
- B. Shao, Z. W. Yang, Y. D. Wang, J. Li, J. Z. Yang, J. B. Qiu and Z. G. Song, ACS Appl. Mater. Interfaces, 2015, 7, 25211–25218 CAS.
- X. Huang, Nat. Photonics, 2014, 8, 748–749 CrossRef CAS.
- X. Y. Huang and J. Lin, J. Mater. Chem. C, 2015, 3, 7652–7657 RSC.
- X. Huang, J. Alloys Compd., 2017, 690, 356–359 CrossRef CAS.
- P. Du, X. Huang and J. S. Yu, Chem. Eng. J., 2018, 337, 91–100 CrossRef CAS.
- F. Kang, M. Peng, D. Y. Lei and Q. Zhang, Chem. Mater., 2016, 28, 7807–7815 CrossRef CAS.
- F. Kang, H. Zhang, L. Wondraczek, X. Yang, Y. Zhang, D. Y. Lei and M. Peng, Chem. Mater., 2016, 28, 2692–2703 CrossRef CAS.
- J. Han, L. Li, M. Peng, B. Huang, F. Pan, F. Kang, L. Li, J. Wang and B. Lei, Chem. Mater., 2017, 29, 8412–8424 CrossRef CAS.
- P. Du, L. Luo, H. K. Park and J. S. Yu, Chem. Eng. J., 2016, 306, 840–848 CrossRef CAS.
- P. Du and J. S. Yu, Chem. Eng. J., 2017, 327 Search PubMed.
- P. Du and J. S. Yu, Sci. Rep., 2017, 7, 11953 CrossRef PubMed.
- C. H. Huang and T. M. Chen, J. Phys. Chem. C, 2011, 115, 2349–2355 CAS.
- B. Li and X. Huang, Ceram. Int., 2018, 44, 4915–4923 CrossRef CAS.
- F. W. Kang, L. J. Li, J. Han, D. Y. Lei and M. Y. Peng, J. Mater. Chem. C, 2017, 5, 390–398 RSC.
- J. Zhao, C. F. Guo, T. Li, X. Y. Su, N. M. Zhang and J. Y. Chen, Dyes Pigm., 2016, 132, 159–166 CrossRef CAS.
- Z.-C. Wu, F.-F. Wang, K. Zhang, S.-C. Xu, J. Liu, Z. Xia and M.-M. Wu, Dyes Pigm., 2017, 150, 275–283 CrossRef.
- M. Shang, S. Liang, H. Lian and J. Lin, Inorg. Chem., 2017, 56, 6131 CrossRef CAS PubMed.
- M. Shang, C. Li and J. Lin, Chem. Soc. Rev., 2014, 43, 1372–1386 RSC.
- M. Y. Peng, X. W. Yin, P. A. Tanner, M. G. Brik and P. F. Li, Chem. Mater., 2015, 27, 2938–2945 CrossRef CAS.
- Z. Mao, J. Chen, L. Jian and D. Wang, Chem. Eng. J., 2016, 284, 1003–1007 CrossRef CAS.
- G. Li, J. Chen, Z. Mao, W. Song, T. Sun and D. Wang, Ceram. Int., 2016, 42, 1756–1761 CrossRef CAS.
- X. Huang, H. Guo and B. Li, J. Alloys Compd., 2017, 720, 29–38 CrossRef CAS.
- L. Huang, Y. Zhu, X. Zhang, R. Zou, F. Pan, J. Wang and M. Wu, Chem. Mater., 2016, 28, 1495–1502 CrossRef CAS.
- P. Du and J. S. Yu, Dyes Pigm., 2017, 147, 16–23 CrossRef CAS.
- P. Du, L. K. Bharat and J. S. Yu, J. Alloys Compd., 2015, 633, 37–41 CrossRef CAS.
- W. Dai, Y. Lei, M. Xu, P. Zhao, Z. Zhang and J. Zhou, Sci. Rep., 2017, 7, 12872 CrossRef PubMed.
- R. P. Cao, Y. J. Ye, Q. Y. Peng, G. T. Zheng, H. Ao, J. W. Fu, Y. M. Guo and B. Guo, Dyes Pigm., 2017, 146, 14–19 CrossRef CAS.
- R. Cao, C. Liao, F. Xiao, G. Zheng, W. Hu, Y. Guo and Y. Ye, Dyes Pigm., 2018, 149, 574–580 CrossRef CAS.
- R. Cao, T. Fu, Y. Cao, H. Ao, S. Guo and G. Zheng, Mater. Lett., 2015, 155, 68–70 CrossRef CAS.
- B. Li, X. Huang, H. Guo and Y. Zeng, Dyes Pigm., 2018, 150, 67–72 CrossRef CAS.
- A. Huang, Z. Yang, C. Yu, Z. Chai, J. Qiu and Z. Song, J. Phys. Chem. C, 2017, 121 Search PubMed.
- C. Y. Yu, Z. W. Yang, A. J. Huang, Z. Z. Chai, J. B. Qiu, Z. G. Song and D. C. Zhou, J. Non-Cryst. Solids, 2017, 457, 1–8 CrossRef CAS.
- X. Y. Huang, B. Li and H. Guo, J. Alloys Compd., 2017, 695, 2773–2780 CrossRef CAS.
- H. Guo, B. Devakumar, B. Li and X. Huang, Dyes Pigm., 2018, 151, 81–88 CrossRef CAS.
- M. Wen, H. Wu, X. Su, J. Lu, Z. Yang, X. Wu and S. Pan, Dalton Trans., 2017, 46, 4968–4974 RSC.
- J. T. Ingle, A. B. Gawande, R. P. Sonekar, S. K. Omanwar, Y. Wang and L. Zhao, J. Alloys Compd., 2014, 585, 633–636 CrossRef CAS.
- R. D. Shannon, Acta Crystallogr., 1976, 32, 751–767 CrossRef.
- Y. Yu, Q. S. Wu and R. K. Li, J. Solid State Chem., 2006, 179, 429–432 CrossRef CAS.
- E. J. Bosze, G. A. Hirata, L. E. Shea-Rohwer and J. Mckittrick, J. Lumin., 2003, 104, 47–54 CrossRef CAS.
- Y. C. Li, Y. S. Chang, Y. C. Lai, Y. J. Lin, C. H. Laing and Y. H. Chang, Mater. Sci. Eng., B, 2007, 146, 225–230 CrossRef.
- J. Zhong, D. Chen, H. Xu, W. Zhao, J. Sun and Z. Ji, J. Alloys Compd., 2017, 695, 311–318 CrossRef CAS.
- X. Huang, B. Li, H. Guo and D. Chen, Dyes Pigm., 2017, 143, 86–94 CrossRef CAS.
| This journal is © The Royal Society of Chemistry 2018 |

