 Open Access Article
Creative Commons Attribution 3.0 Unported Licence
Novel Eu2+-activated thiogallate phosphors for white LED applications: structural and spectroscopic analysis†
Szu-Ping Leea,
Ting-Shan Chanb,
Somrita Duttaa and
Teng-Ming Chen *a
*a
aPhosphors Research Laboratory, Department of Applied Chemistry, National Chiao Tung University, Hsinchu 30010, Taiwan. E-mail: tmchen@mail.nctu.edu.tw
bNational Synchrotron Radiation Research Center, Hsinchu 30076, Taiwan
First published on 27th March 2018
Abstract
Novel Eu2+-activated BaGa2SiS6 and Ba2Ga8SiS16 thiogallate phosphors were prepared by solid-state reaction route. The BaGa2SiS6:Eu2+ phosphor generated a green emission upon excitation at 405 nm, whereas the Ba2Ga8SiS16:xEu2+ phosphor could be tuned from cyan to green range with increasing Eu2+ concentration upon excitation at 365 nm. Additionally, the thermal luminescence properties of the thiogallate phosphors were investigated in the temperature range of 25 to 250 °C. A warm-white LED is fabricated using the combination of a 405 nm blue InGaN-based LED chip with the green-emitting BaGa2SiS6:0.01Eu2+ phosphor, and red-emitting Sr2Si5N8:Eu2+ commercial phosphor with the CRI value of ∼88 and the CCT of 4213 K.
1. Introduction
Phosphor-converted white light emitting diodes (PC-WLEDs) have emerged as one of the most promising and eco-friendly white-light sources for general illumination, consuming less energy than conventional incandescent light sources1–6. In most commercial WLEDs, a combination of a blue LED chip and cerium doped yttrium aluminum garnet (YAG:Ce3+) phosphor is used for the generation of white light.7 But this combination has the shortcomings of poor colour rendering index (CRI) and a high correlated colour temperature (CCT) due to the absence of emission in the red spectral region which restricts its use in commercial lighting.8,9 There are several approaches considered for achieving high CRI and cool color correlated temperature such as; a combination of a blue LED chip with a yellow-emitting and a narrow-band red-emitting phosphor or a mixture of green-emitting and red-emitting phosphor.8–12 The use of a near-ultraviolet (n-UV) LED chip or an ultraviolet (UV) LED chip when combined with a mixture of red, green and blue phosphors can also improve the CRI value and the CCT values of the white light generated.13–15 Hence there is a need to develop new phosphors for obtaining the optimal requirements for a high-quality white light for general commercial lighting applications.One of the main approaches involved in the designing of new phosphors includes the exploration of host compounds from existing structural model and then the proper selection of suitable activators (such as broadband emitting Eu2+, Ce3+, and Mn2+).16 Two such hosts that can be considered for exploration are BaGa2SiS6 reported by Yin et al. in 2012 (ref. 17) and Ba2Ga8SiS16 reported by Liu and group in the year 2014 (ref. 18) for the first time. Both the materials were studied for high power IR – nonlinear optical applications. Since, sulphide-containing lattices when activated by Eu2+ provide a longer emission wavelength due to their higher nephelauxetic effect compared to nitrides and oxides,19–21 the structural design of these two materials opens up the possibility to study them for LED applications. The gallium (Ga3+) and silicon (Si4+) ions can create a protective environment to successfully enhance the stability of the sulfide phosphors and hence their luminescence properties.
When doped with Eu2+, the emission spectrum is in general characterized by a single broad band emission which can be deconvoluted into two or more number of emission bands depending on the number of cationic sites replaced by Eu which can also help in achieving higher CRI values for WLED applications. Also, due to the small Stokes shift value, the phosphors could be excited from UV to blue region. The covalency and the crystal field splitting between the host allows Eu2+ ions to exhibit the parity-allowed 5d14fn−1 → 4fn emission from the UV region to the visible spectral region.22–26 In this research, a green-emitting Eu2+-activated BaGa2SiS6 and a tunable cyan-to-green-emitting Ba2Ga8SiS16:Eu2+ phosphors were reported which show broad excitation range. The structural and luminescent properties of the phosphors were investigated in detail. In addition, a LED device using the BaGa2SiS6:Eu2+ phosphor with a 405 nm LED chip was fabricated to demonstrate its applicability as a colour-conversion phosphor in the fabrication of WLEDs.
2. Experimental
2.1 Materials and synthesis
The Eu2+ -doped BaGa2SiS6 and Ba2Ga8SiS16 phosphors were synthesized using BaS (Alfa Aesar, 99.7%), Ga2S3 (Alfa Aesar, 99.99%), Si powder (Alfa Aesar, 99.999%), and S powder (Acros, 99.999%) and EuF2 (Alfa Aesar, 99.9%) as raw ingredients. The ingredients were homogeneously mixed and ground in a glove box under nitrogen atmosphere and loaded into the quartz glass ampoules, which were then sealed off after evacuated to 10−4 torr. The ampoules were heated in a furnace to 900 °C for 8 h at 5 °C min−1. Finally, the powdered phosphors were obtained after the furnace naturally cooled down to room temperature. In each case, the reactions are summarized in the following equations.| (1 − x)BaS + Ga2S3 + xEuF2 + Si + 2S → (Ba1−xEux)Ga2SiS6 | (1) |
| (2 − 2x)BaS + 4Ga2S3 + 2xEuF2 + 2Si + 4S → (Ba1−xEux)2Ga8SiS16 + SiS2↑ | (2) |
2.2 Characterizations
Synchrotron X-ray Diffraction (SXRD) using the BL01C2 beamline with an X-ray wavelength of 0.774908 Å was used to analyse the phase purity of the synthesized products by at the National Synchrotron Radiation Research Centre (NSRRC) in Hsinchu, Taiwan. The X-ray Rietveld refinement was carried to investigate the structure of the phosphor using the General Structure Analysis System (GSAS) software. JEOL JSM-7401F operated at voltage of 5 kV was used to perform the scanning electron microscopy (SEM) morphological analysis and energy dispersive X-ray spectroscopy (EDS) analysis. The photoluminescence spectra and the time resolved measurement of the phosphors were obtained using a FS5 Fluorescence Spectrometer (Edinburgh Instruments) with a 450 W xenon lamp and a TCSPC (Time Correlated Single Photon Counting) module in combination with EPLED-360 picosecond pulsed light emitting diode laser system as the excitation source respectively. An integrating sphere whose inner face was coated with Spectralon equipped with a spectrofluorometer (Horiba Jobin-Yvon Fluorolog 3-2-2) measured the quantum efficiency (QE). The thermal luminescence performance was analyzed using a heating apparatus (THMS-600) fitted with PL equipment. The electroluminescence (EL) spectra were performed by Sphere-Optics integrating sphere with LED measurement starter packages (Onset, Inc.) recording at different current in the range of 100–300 mA.3. Results and discussion
3.1 Structural characterizations and crystallographic parameters of the (Ba0.95Eu0.05)Ga2SiS6 and (Ba0.90Eu0.10)2Ga8SiS16 phosphors
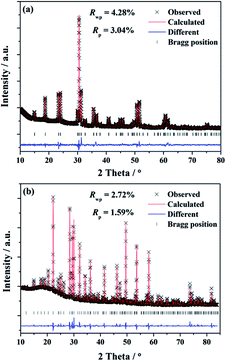
To investigate the phases of the obtained phosphors and a knowledge of their crystal structure, the Rietveld analysis22 was performed using the single crystal structure data of BaGa2SiS6 (ICSD file no. 184747) and Ba2Ga8SiS16 (ICSD file no. 194875), respectively, as references to approach a dependable approximation of the actual crystal structure. The experimental, calculated, and structural results of the SXRD refinement of (Ba0.95Eu0.05)Ga2SiS6 and (Ba0.90Eu0.10)2Ga8SiS16 are shown in Fig. 1a and b, respectively.The final refinement converged with weighted-profiles of Rp = 3.04% and Rwp = 4.28% of (Ba0.95Eu0.05)Ga2SiS6; Rp = 1.59% and Rwp = 2.72% of (Ba0.90Eu0.10)2Ga8SiS16, thus revealing the good quality of the refinement. The crystallographic data are summarized and the selected bond lengths are available in Table 1 and 2, respectively.
| Formula | (Ba0.95Eu0.05)Ga2SiS6 | (Ba0.90Eu0.10)2Ga8SiS16 |
|---|---|---|
| a Lattice parameters: a and c in Å, V in Å3; T = 298 K; BL01C2 beamline of NSRRC, λ = 0.774908 Å; Site Occupancy Fraction (S.O.F.); Uiso in Å2. | ||
| Symmetry | Trigonal | Hexagonal |
| Space group | R3 (no. 146) | P63mc (no. 186) |
| Lattice parameters | a = b = 9.55032(28) | a = b = 10.83380(10) |
| c = 8.63634(27) | c = 11.86626(18) | |
| V = 682.18(4) | V = 1206.164(25) | |
| Rwp | 4.28% | 4.68% |
| Rp | 3.04% | 2.75% |
| χ2 | 3.805 | 2.873 |
| (Ba0.95Eu0.05)Ga2SiS6 | |||||
|---|---|---|---|---|---|
| Atom | x/a | y/b | z/c | S.O.F | Uiso*100 |
| Ba | 0.00000 | 0.000000 | 0.4988(26) | 0.9500 | 6.59 |
| Ga | 0.0537(13) | 0.8276(10) | 0.9498(29) | 0.6700 | 0.30 |
| Si | 0.049351 | 0.7379(22) | 0.8921(74) | 0.3300 | 1.34 |
| S(1) | 0.8527(13) | 0.5886(12) | 0.5146(28) | 1.0000 | 3.12 |
| S(2) | 0.8136(15) | 0.7627(13) | 0.8284(27) | 1.0000 | 1.63 |
| Eu | 0.000000 | 0.000000 | 0.4988(26) | 0.0500 | 6.59 |
| (Ba0.90Eu0.10)2Ga8SiS16 | |||||
|---|---|---|---|---|---|
| Atom | x/a | y/b | z/c | S.O.F | Uiso*100 |
| Ba(1) | 0.333300 | 0.666700 | 0.0253(8) | 0.9500 | 4.53 |
| Ba(2) | 0.333300 | 0.666700 | 0.5156(8) | 0.9500 | 2.59 |
| Ga(1) | 0.0048(17) | 0.3384(11) | 0.3262(65) | 0.8600 | 1.42 |
| Ga(2) | 0.8846(5) | 0.1154(5) | 0.0746(13) | 1.0000 | 2.16 |
| Si | 0.0048(17) | 0.3384(11) | 0.3262(65) | 0.1400 | 1.42 |
| S(1) | 0.6625(14) | 0.0040(14) | 0.0164(7) | 1.0000 | 1.72 |
| S(2) | 0.2255(11) | 0.7745(11) | 0.2637(18) | 1.0000 | 1.06 |
| S(3) | 0.5593(9) | 0.4407(9) | 0.2791(20) | 1.0000 | 1.61 |
| S(4) | 0.8977(11) | 0.1023(11) | 0.2664(18) | 1.0000 | 0.53 |
| S(5) | 1.000000 | 0.000000 | −0.0162(22) | 1.0000 | 2.70 |
| Eu(1) | 0.333300 | 0.666700 | 0.0253(8) | 0.0500 | 4.53 |
| Eu(2) | 0.333300 | 0.666700 | 0.5156(8) | 0.0500 | 2.59 |
| (Ba0.95Eu0.05)Ga2SiS6 | (Ba0.90Eu0.10)2Ga8SiS16 | ||
|---|---|---|---|
| a Bond distance in Å. | |||
| (Ba/Eu)-S1 | 3.45104(10) (3×) | (Ba1/Eu1)-S1 | 3.61231(3) (6×) |
| (Ba/Eu)-S1i | 3.50580(8) (3×) | (Ba1/Eu1)-S2 | 3.47936(4) (3×) |
| (Ba/Eu)-S2 | 3.51719(8) (3×) | (Ba1/Eu1)-S3 | 3.54776(4) (3×) |
| (Ba/Eu)-S2i | 3.60984(11) (3×) | (Ba2/Eu2)-S1 | 3.54578(3) (6×) |
| Ga-S1 | 2.27107(7) | (Ba2/Eu1)-S2 | 3.60961(4) (3×) |
| Ga-S1i | 2.40444(7) | (Ba2/Eu1)-S3 | 3.71969(4) (6×) |
| Ga-S2 | 2.20099(6) | (Ga1/Si)-S1 | 2.25675(3) |
| Ga-S2i | 2.12290(5) | (Ga1/Si)-S2 | 2.19921(2) |
| (Ga1/Si)-S3 | 2.19370(2) | ||
| (Ga1/Si)-S4 | 2.32944(2) | ||
| Ga2-S1 | 2.19539(2) (2×) | ||
| Ga2-S4 | 2.28965(3) | ||
| Ga2-S5 | 2.41845(2) | ||
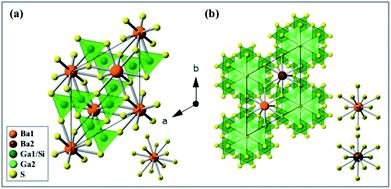
The as-synthesized BaGa2SiS6 phosphor was found to crystallize in the space group R3 of the trigonal system, whereas the Ba2Ga8SiS16 in the space group P63mc of the hexagonal system. Fig. 2a presents the exact crystal structure of BaGa2SiS6 viewed along the c-axis and a single Ba atomic site (BaS12). Fig. 2b indicates the crystal structure of Ba2Ga8SiS16, which shows two crystallographically-independent Ba atomic sites (Ba1 and Ba2) along with the Ga/SiS4 tetrahedral coordination.
The grain size and morphology of the two phosphor particles characterized by SEM show that the as-synthesized phosphor was composed of irregular granular micro crystals. The nominal stoichiometry was also verified by EDS measurement, as shown in Fig. S1.†
3.2 Spectroscopic study of the BaGa2SiS6:Eu2+ and Ba2Ga8SiS16:Eu2+ phosphor
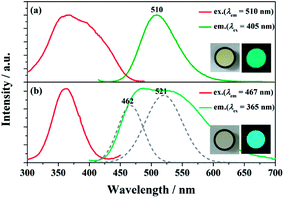
The PLE and PL spectra of BaGa2SiS6:0.01Eu2+ and Ba2Ga8SiS16:0.01Eu2+ is represented in Fig. 3. The BaGa2SiS6:Eu2+ phosphor is excitable around 350 to 450 nm and generates a green emission peaking at 510 nm, and the Ba2Ga8SiS16:Eu2+ phosphor exhibits a broadband cyan emission upon excitation at 365 nm. The two emission bands of Ba2Ga8SiS16:Eu2+ are attributed to the two sites of barium atom (Ba1 and Ba2) in the Ba2Ga8SiS16 lattice.As indicted in Fig. 4, the Eu2+ emission peak changes from 462 and 521 nm (1% Eu2+) to 462 and 537 nm (15% Eu2+) with the increasing Eu2+ concentration. In addition, the intensity of the short emission decreases while that of the long emission enhances as Eu2+ concentration increases. This may result from the fact that Eu2+ occupy in different sites, viz, Ba1 and Ba2 sites in the Ba2Ga8SiS16 lattice, and the energy transfer between Eu2+ ions in the two different sites occur with increasing Eu2+ concentration.
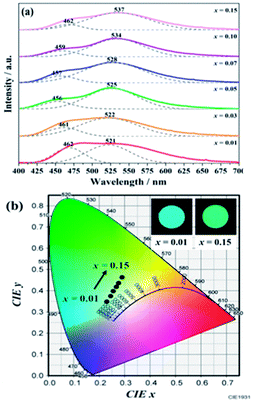 | ||
| Fig. 4 PL spectra (a) and variation in CIE chromaticity coordinates (b) of (Ba1−xEux)2Ga8SiS16 (0.01 ≤ x ≤ 0.15) phosphor as a function of Eu2+ content. | ||
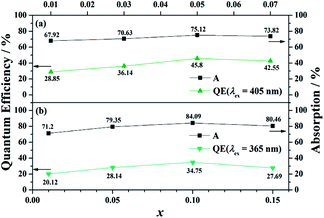
Moreover, BaGa2SiS6:Eu2+ exhibits a higher external quantum efficiency (EQE) values than that of Ba2Ga8SiS16:Eu2+ (Fig. 5). The comparatively high asymmetry in BaGa2SiS6:Eu2+ crystal may be the major reason for the higher EQE. With an increase in absorption, the EQE value for (Ba1−xEux)Ga2SiS6 (0.01 ≤ x ≤ 0.10) increases and reaches maximum values of about 45.80% at x = 0.10, whereas (Ba1−xEux)2Ga8SiS16 (0.01 ≤ x ≤ 0.15) reaches maximum values of about 34.75% at x = 0.10, as shown in Fig. 5.
3.3 Time resolved measurement and thermal luminescence properties of the BaGa2SiS6:Eu2+ and Ba2Ga8SiS16:Eu2+ phosphor
The decay curve of BaGa2SiS6:Eu2+ phosphor excited at 360 nm and monitored at 506 nm is presented in Fig. 6. The measured lifetime is related to the first-order exponential equation given by27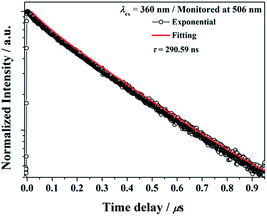 | ||
| Fig. 6 Decay curve for BaGa2SiS6:Eu2+ phosphor (black line) and curve-fitting (red line) under 360 nm excitation and monitored at 506 nm. | ||
The luminescence decay times τ was calculated to be 290.59 ns for BaGa2SiS6:Eu2+, the result is acceptable for the parity-allowed 4f65d1 → 4f7 transitions of Eu2+ and rapid enough for LED lighting applications. Moreover, the well-fitting results by an exponential decay with a single component illustrate that Eu2+ ions occupy only one site in the BaGa2SiS6 host.
The decay curves of Ba2Ga8SiS16:Eu2+ phosphor monitored at 462 nm (τ = 300.00 ns) and monitored at 521 nm (τ = 410.90 ns) under 360 nm excitation are illustrated in Fig. 7a and b, respectively. The results indicated that the Eu2+ ions occupied the two different Ba2+ ions coordination environment in the Ba2Ga8SiS16 host.
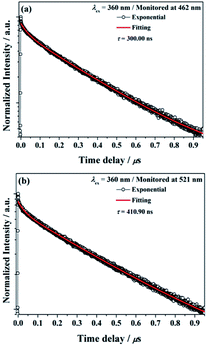 | ||
| Fig. 7 Decay curve for Ba2Ga8SiS16:Eu2+ phosphor (black line) and curve-fitting (red line) under 360 nm excitation and monitored at (a) 462 nm and (b) 521 nm. | ||
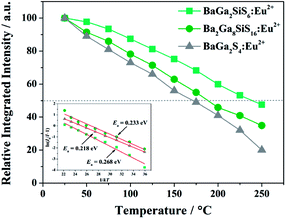
Both thiosilicate phosphors were found to remain intact when left in the air at ambient temperature for 10–14 days with 60–70% relative humidity. Thermal luminescence quenching property of a phosphor plays an important role for LED applications. Fig. 8 shows temperature dependence of relative PL integrated intensity for BaGa2SiS6:Eu2+, Ba2Ga8SiS16:Eu2+, and BaGa2S4:Eu2+ over the range 25 to 250 °C. The thermal stability of the as-prepared thiogallate phosphors is stronger than that of the ternary sulfide BaGa2S4:Eu2+, which perhaps belongs to the stiff (SiS4) tetrahedral network that makes the host more stable. The lower left inset of Fig. 8 presents the calculated thermal activation energy (Ea) expressed by the following equation:28
 | (3) |
3.4 CIE chromaticity coordinates and performance of LED devices based on BaGa2SiS6:Eu2+ phosphor
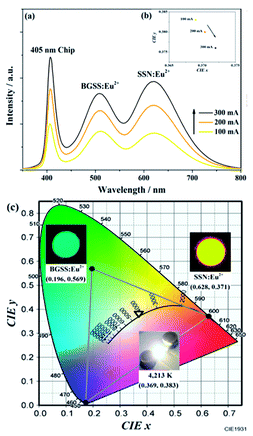
To reveal the prospective use of BaGa2SiS6:Eu2+ for PC-WLED application, the BaGa2SiS6:0.01Eu2+ phosphor was utilized to fabricate a WLED device driven by 100 to 300 mA current with red-emitting Sr2Si5N8:Eu2+ and a 405 nm LED chip shown in Fig. 9.The EL intensity of the blue, green, and red bands of the white LED device increased while increasing the forward-biased current from 100 to 300 mA, and the saturation phenomenon was not observed even at a high forward current of 300 mA, as illustrated in Fig. 9a. As shown in Fig. 9b, with an increase in the driving current, the CIE chromaticity coordinates shifted slightly. The results demonstrated the excellent colour stability of the BaGa2SiS6:0.01Eu2+ phosphor. In Fig. 9c the studies indicate that this novel green phosphor is a potential candidate for white LED, especially for the generation of warm white light with an optimum CRI of 88 and a CCT value of 4213 K.
4. Conclusions
In summary, we have investigated two new Eu2+-doped BaGa2SiS6 and Ba2Ga8SiS16 thiogallate phosphors. The crystal structure and luminescence performance of both the phosphors were studies in detail. The results reveal that the green-emitting Eu2+-doped BaGa2SiS6 and the colour-tunable Eu2+-doped Ba2Ga8SiS16 could be excited over a broad range of wavelength thus generating a broadband emission. The green-emitting Eu2+-doped BaGa2SiS6 phosphor was integrated together with a red-emitting phosphor and a blue chip to obtain a warm-white-light LED device an optimum CRI value of 88 and CCT value of 4213 K. Our investigation indicates the potential use of this phosphor in phosphor-converted LED for the lighting application.Conflicts of interest
There are no conflicts of interest to declare.Acknowledgements
This research was financially supported by Ministry of Science and Technology of Taiwan (R.O.C.) under Contract No. MOST104-2113-M-009-018-MY3.References
- G. Blasse and B. C. Grabmaier, Luminescent Materials, Springer-Verlag, Berlin, 1994 Search PubMed.
- B. Damilano, P. Demolon, J. Brault, T. Huault, F. Natali and J. Massies, J. Appl. Phys., 2010, 108, 73115–73121 CrossRef.
- S. Ye, F. Xiao, Y. Pan, Y. Ma and Q. Zhang, Mater. Sci. Eng., R, 2010, 71, 1–34 CrossRef.
- R. Mueller-Mach, G. Mueller, M. R. Krames, H. A. Hoppe, F. Stadler, W. Schnick, T. Juestel and P. Schmidt, Phys. Status Solidi A, 2005, 202, 1727–1732 CrossRef CAS.
- L. Chen, C. C. Lin, C. W. Yeh and R. S. Liu, Materials, 2010, 3, 2172–2195 CrossRef CAS.
- H. A. Höppe, Angew. Chem., Int. Ed., 2009, 48, 3572–3582 CrossRef PubMed.
- D. J. Robbins, J. Electrochem. Soc., 1979, 126, 1550–1555 CrossRef CAS.
- H. Lin, B. Wang, J. Xu, R. Zhang, H. Chen, Y. L. Yu and Y. S. Wang, ACS Appl. Mater. Interfaces, 2014, 6, 21264–21269 CAS.
- R. J. Xie, N. Hirosaki, T. Suehiro, F. F. Xu and M. A. Mitomo, Chem. Mater., 2006, 18, 5578–5583 CrossRef CAS.
- J. H. Oh, H. Y. Kang, J. Eo, H. K. Park and Y. R. Do, J. Mater. Chem. C, 2015, 3, 607–615 RSC.
- X. Piao, K. I. Machida, T. Horikawa, H. Hanzawa, Y. Shimomura and N. Kijima, Chem. Mater., 2007, 19, 4592–4599 CrossRef CAS.
- K. A. Denault, N. C. Gerorge, S. R. Paden, S. Brinkley, A. A. Mikhailovsky, J. Neuefeind, S. P. DenBaars and R. Seshardri, J. Mater. Chem., 2012, 22, 18204–18213 RSC.
- Z. Xia, Z. Xu, M. Chen and Q. Liu, Dalton Trans., 2016, 45(28), 11214–11232 RSC.
- Z. Yang, P. C. Lin, C. F. Guo and W.-R. Liu, RSC Adv., 2015, 5, 13184–13191 RSC.
- S. Dutta, S. Som and S. K. Sharma, Dalton Trans., 2013, 42, 9654–9661 RSC.
- Z. Xia and Q. Liu, Prog. Mater. Sci., 2016, 84, 59–117 CrossRef CAS.
- W. L. Yin, K. Feng, R. He, D. J. Mei, Z. H. Lin, J. Y. Yao and Y. C. Wu, Dalton Trans., 2012, 41, 5653–5661 RSC.
- B. W. Liu, H. Y. Zeng, M. J. Zhang, Y. H. Fan, G. C. Guo and J. S. Huang, Inorg. Chem., 2015, 54, 976–981 CrossRef CAS PubMed.
- J. E. Van Haecke, P. F. Smet and D. Poelman, J. Lumin., 2007, 126, 508–514 CrossRef CAS.
- P. F. Smet, I. Moreels, Z. Hens and D. Poelman, Materials, 2010, 3, 2834–2883 CrossRef CAS.
- A. B. Parmentier, P. F. Smet and D. Poelman, Opt. Mater., 2010, 33, 141–144 CrossRef CAS.
- G. Li, Y. Tian, Y. Zhao and J. Lin, Chem. Soc. Rev., 2015, 44, 8688–8713 RSC.
- J. Shi and S. Zhang, J. Phys. Chem. B, 2004, 108, 18845–18849 CrossRef CAS.
- A. Piquette, W. Bergbauer, B. Galler and K. C. Mishra, ECS J. Solid State Sci. Technol., 2016, 5(1), R3146–R3159 CrossRef CAS.
- C.-H. Huang, Y.-C. Chen, T.-M. Chen, T.-S. Chan and H.-S. Sheu, J. Mater. Chem., 2011, 21, 5645–5649 RSC.
- D. Y. Wang, C. H. Huang, Y. C. Wu and T. M. Chen, J. Mater. Chem., 2011, 21, 10818–10822 RSC.
- R. Pang, C. Li, L. Shi and Q. Su, J. Phys. Chem. Solids, 2009, 70, 303–306 CrossRef CAS.
- R. J. Xie, N. Hirosaki, N. Kimura, K. Sakuma and M. Mitomo, Appl. Phys. Lett., 2007, 90, 191101–191103 CrossRef.
Footnote |
| † Electronic supplementary information (ESI) available. See DOI: 10.1039/c8ra01113c |
| This journal is © The Royal Society of Chemistry 2018 |

