
 Open Access Article
 This Open Access Article is licensed under a Creative Commons Attribution-Non Commercial 3.0 Unported Licence
Fingerprint profiling of polysaccharides from different parts of lotus root varieties
Hong-Xun Wang†
*a,
Yang Yi† b,
Jie Sunb,
Olusola Lamikanrab and
Ting Minb
b,
Jie Sunb,
Olusola Lamikanrab and
Ting Minb
aCollege of Biology & Pharmaceutical Engineering, Wuhan Polytechnic University, Wuhan 430023, PR China. E-mail: wanghongxun7736@163.com; Tel: +86 27 83955611
bCollege of Food Science & Engineering, Wuhan Polytechnic University, Wuhan 430023, PR China. E-mail: yiy86@whpu.edu.cn; qiqijiayuguan@163.com; sola.lamikanra@gmail.com; minting1323@163.com
First published on 4th May 2018
Abstract
Thirty-nine polysaccharides isolated from different parts of 13 lotus root varieties were characterized with fingerprint and chemometrics analyses to explore their similarity and diversity. The physicochemical features of lotus root polysaccharides (LRPs) were found to be the following: LRPs contained mainly polysaccharides (5.94 kDa) and polysaccharide-protein complexes (11.57 kDa and 5.30 kDa); their carbohydrates were composed of mannose, rhamnose, glucuronic acid, galacturonic acid, glucose, galactose and arabinose approximately in the molar ratio of 0.19![[thin space (1/6-em)]](https://www.rsc.org/images/entities/char_2009.gif) :0.14:0.08:0.17:6.49:1.00:0.16; and node LRPs possessed more binding proteins and uronic acids than both flesh and peel LRPs. Their fingerprints based on Fourier-transform infrared spectroscopy, pre-column derivatization high-performance liquid chromatography and high performance size-exclusion chromatography all exhibited relatively high similarities, contributing to the common figerprint models which could be utilized as references for the identification of LPRs. In addition, the fingerprint characteristics associated with the between-group variability of LRPs in the score plots derived from multivariate analytical models might indicate which variety or part of lotus root they were isolated from. Therefore, multi-fingerprinting techniques have the potential to be applied to the identification and quality control of LRPs.
:0.14:0.08:0.17:6.49:1.00:0.16; and node LRPs possessed more binding proteins and uronic acids than both flesh and peel LRPs. Their fingerprints based on Fourier-transform infrared spectroscopy, pre-column derivatization high-performance liquid chromatography and high performance size-exclusion chromatography all exhibited relatively high similarities, contributing to the common figerprint models which could be utilized as references for the identification of LPRs. In addition, the fingerprint characteristics associated with the between-group variability of LRPs in the score plots derived from multivariate analytical models might indicate which variety or part of lotus root they were isolated from. Therefore, multi-fingerprinting techniques have the potential to be applied to the identification and quality control of LRPs.
1. Introduction
Lotus (Nelumbo nucifera Gaertn.) is an aquatic plant belonging to the family Nelumbonaceae and is widely cultivated in Southeast Asia and Australia as a commercial crop for foods and ornamentals.1 Its roots are very popular as both a nutritional vegetable and a therapeutic herb.2 Interest in pharmacological benefits of the root such as immunomodulation, antioxidant activity, antidiabetic activity, liver injury protecting effect and antiobesity effect has increased considerably.3–8 There are reasons to believe that polysaccharides significantly contribute to these benefits. Previous research studies have indicated that lotus root polysaccharides (LRPs) possess antioxidant, antidiabetic, antiobesity, antilipidemic and immunomodulatory activities and that they would have high value in the commercial development of functional food and medicine.3,9,10 Quality control is considered to be the main issue in the commercialization process of functional polysaccharide products.11 So far, little is known about the quality control of LRPs.In China, Nelumbo nucifera has been cultivated for the last 2000 years, and more than 200 germplasm collections of lotus root are preserved in the Wuhan National Germplasm Repository for Aquatic Vegetables.12 The genetic diversity assessment of lotus root varieties has attracted much attention for the evolutionary understanding, conservation and improvement of genetic resources.1,13 In contrast, investigations of the physicochemical diversity of characteristic components are rare. A comprehensive understanding of plant polysaccharides' physicochemical similarity and differences among different varieties, locations or tissues is needed for their commercial development.11,14,15 Varietal and tissue variations in plants are known to impact physicochemical properties of their polysaccharides and consequently the nature and intensity of their bioactivities.16,17 Previous work indicated that the in vitro antioxidant activities of polysaccharides from the peel and node of lotus root were significantly stronger than those from the flesh.9 Therefore, for the commercial development of LRPs, it is necessary to define the physicochemical diversity among the different varieties and different parts of the lotus root.
With the continual progress in modern analytical technology and chemometric applications, fingerprint profiling has been internationally proven to be effective and convenient for inspecting the authenticity and quality of herbal materials, as well as their products.14 Fingerprinting techniques have been successfully used for the quality control and standardization of plant polysaccharides, such as Lycium barbarum polysaccharides,14 tea polysaccharides,11 Ganoderma polysaccharides,15 Cordyceps polysaccharides18 and Panax polysaccharides.19 The inconsistent characteristics of LRPs reported is due to of their structural complexity, especially since they may be protein-bound complexes.3,9,20 Unlike the phenolic compounds of lotus root,2 LRPs are difficult to profile using only basic composition determination. Structural characteristics related to functional group, molecular weight distribution and binding protein are also needed for a comprehensive description. Accordingly, multi-fingerprinting analysis models are considered to be necessary for the characterization and discrimination of LRPs. However, any kind of fingerprinting profile of LRPs has been unavailable so far.
In this study, polysaccharides from different parts (flesh, peel and node) of 13 lotus root varieties were isolated and analyzed by multi-techniques including ultraviolet spectroscopy (UV), Fourier-transform infrared spectroscopy (FTIR), pre-column derivatization high-performance liquid chromatography (PCD-HPLC) and high performance size-exclusion chromatography (HPSEC). The resulting data were analyzed to develop fingerprint models that reveal the physicochemical similarities and differences of LRPs from different varieties and parts of the root. Considering the growing demand for lotus root-derived functional products and the increasing literature on their bioactive components, the detailed profiles of LRPs described in the present work will effectively support efforts toward the development and utilization of lotus root.
2. Materials and methods
2.1. Raw and processed materials
Thirteen varieties of lotus root, including No. 5 elian, No. 6 elian, No. 7 elian, No. 8 elian, Yingcheng-Bailian, Zoumayang, Guixi Fuou, Baheou, Baipaozi, Bobaiou, No. 2 Wuzhi, 8143 and Changzhou-Piaojiangou, were provided by the Wuhan National Germplasm Repository for Aquatic Vegetables and identified by senior agronomist Jing Peng (Wuhan Vegetable Research Institute, Wuhan, China). All the raw materials were harvested in October 2015. The roots were cleaned well and split into three parts (flesh, peel and node) according to the process shown in Fig. 1. After beening mashed by a food processor (HR7629/00, Philips Corporation, Huizhou, China), the materials were packaged and stored at −20 °C.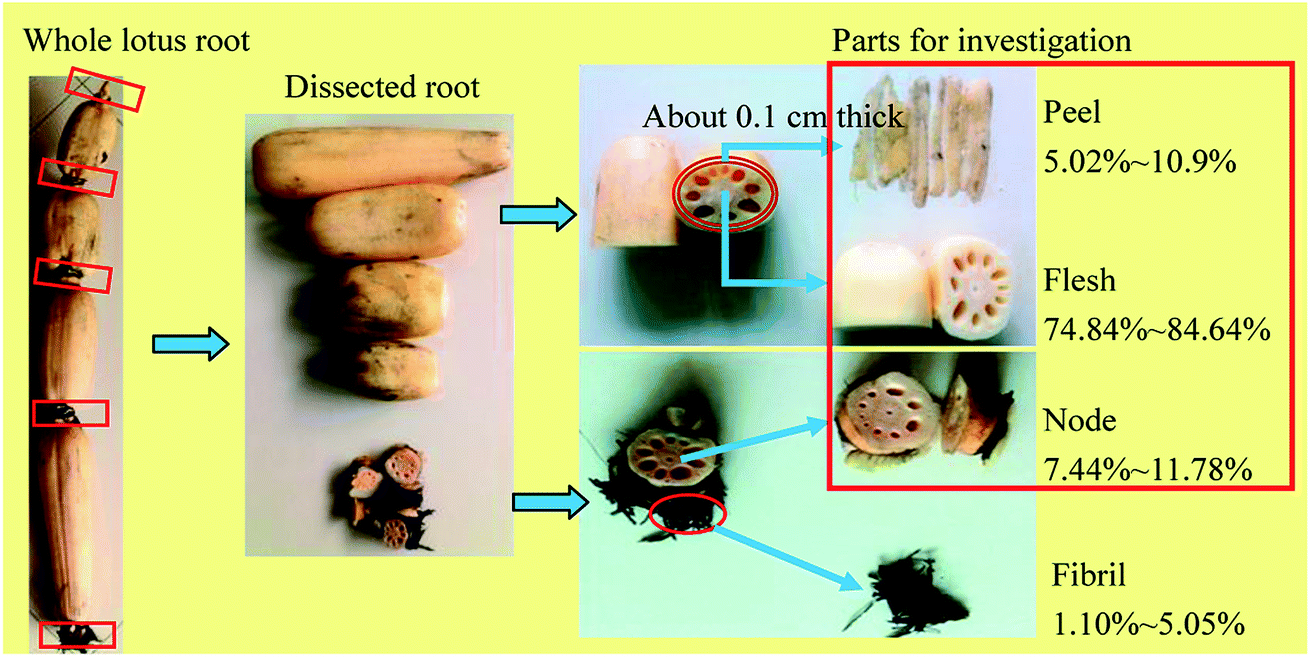 | ||
| Fig. 1 The illustrations for pretreating lotus root. The yield (%) of each lotus root part was calculated as a percentage of the wet weight of the whole root. | ||
2.2. Preparation of LRPs
LRPs were isolated according to the method of Li et al.9 In brief, 200 g processed materials were homogenized (12000 rpm, 5 min) in 2 L distilled water using a XHF-D high-shear homogenizer (Ningbo Xinzhi Biotechnology Co., Ltd, Ningbo, China), followed by incubation in a 90 °C water bath for 3 h. The homogenate was centrifuged (3556 × g, 10 min) to separate the supernatant. The supernatant was concentrated at 65 °C and 0.1 MPa to about 200 mL by a vacuum rotary evaporator (BC-R203, Shanghai Biochemical Equipment Co., Shanghai, China). The concentrated supernatant was placed in an 80 °C water bath with 0.5 mL liquid alpha-amylase reagent (Aladdin, Shanghai, China) for 1 h to remove starches and then treated with Sevage reagent (the volume ratio of chloroform to n-butyl alcohol was 4) to remove proteins. The concentrated solution was mixed with three volumes of dehydrated ethanol overnight at 4 °C to precipitate polysaccharides. The precipitates were separated by centrifugation (3556 × g, 10 min), washed twice with 75% ethanol solution, redissolved in 50 mL distilled water and finally lyophilized. The lyophilized polysaccharides were weighed and kept in a desiccator at room temperature. The polysaccharide yield (mg g−1 FW) was calculated as the mass ratio of polysaccharides (mg) to processed materials (g, fresh weight). The main contents and procedures conducted to the further investigation on LRPs are shown in Fig. 2.
 | ||
| Fig. 2 The main contents and procedures conducted to the investigation on LRPs. The fingerprint profiling of LRPs was performed with a Chemometrics Analysis System using the data associated with their characteristic groups, monosaccharide compositions and molecular weight distributions, which were respectively analyzed by the methods of FTIR, PCD-HPLC and HPSEC-RI-PDA. | ||
2.3. Chemical analyses
Samples were dissolved in distilled water to the concentration of 0.5 mg mL−1 and 2 mg mL−1 for the measurement of total sugar and protein, respectively. The total sugar content of the sample was determined using phenol–sulphuric acid method and expressed as glucose equivalents.21 The protein content was determined using Coomassie brilliant blue staining method-based protein determination kits (Nanjing Jiancheng Bioengineering Institute, Nanjing, China).2.4. UV analysis
Samples were dissolved in distilled water to the concentration of 50 μg mL−1 and centrifuged at 3556 × g for 10 min. The supernatant was then measured by a UV1800 spectrophotometer in the wavelength range of 190–400 nm (Shimadzu Corp., Kyoto, Japan).2.5. FTIR analysis
Samples were grounded with 1% mass ratio of potassium bromide powders (spectroscopic grade). The mixtures were then pressed into a 1 mm pellet for FTIR measurement in the frequency range of 4000–400 cm−1,14 using a Fourier transform infrared spectrophotometer (Nexus 5DXC FT-IR, Thermo Nicolet, America).2.6. PCD-HPLC analysis
The procedures of polysaccharide hydrolysis and pre-column derivatization were performed using the method of Dai et al.22 Monosaccharide composition was analyzed by a reversed-phase HPLC method. The HPLC system was composed of a 2998 photodiode array (PDA) detector, an 1525 binary pump and an Agilent Extend-C18 column (4.6 mm × 250 mm, California, USA). The mobile phase, consisting of a phosphate buffer (0.05 mol L−1, pH 6.9) and acetonitrile in a volume ratio of 81:19, was used at a flow rate of 1 mL min−1. The detection wavelength was 250 nm. External and internal standard methods were used for the identification of the sample's chromatographic peaks. The mixed standard solutions containing 1–5 mmol mL−1 of mannose (Man), ribose (Rib), rhamnose (Rha), glucuronic acid (GlcA), galacturonic acid (GalA), glucose (Glc), galactose (Gal) and arabinose (Ara) (Aladdin, Shanghai, China) were used to establish the regression equation of the peak area against the concentration for quantification.
2.7. HPSEC analysis
HPSEC analysis was performed on a Waters HPLC system (Waters, Milford, MA, USA) containing a 2414 refractive index (RI) detector, a 2998 PDA detector and an Ultrahydrogel 250 SEC column (7.8 mm × 300 mm). PDA detector (280 nm) and RI detector were connected in series. A sodium nitrate solution (0.1 mol mL−1) was used as mobile phase at a flow rate of 0.5 mL min−1. The column temperature was maintained at 45 °C and the injection volume was 15 μL. Samples were dissolved in a sodium nitrate solution to the concentration of 2.5 mg mL−1, followed by filtration through a 0.22 μm filter membrane prior to injection. The relative molecular weights corresponding to the chromatographic peaks of the sample were determined using a gel filtration calibration kit (LMW, GE Healthcare Life Sciences, Buckinghamshire, UK).2.8. Statistical analysis
Data were expressed as means ± standard deviations from three measurements. The statistically significant difference (p < 0.05) between groups was evaluated with one-way analysis of variance followed by the Student–Newman–Keuls test using SPSS Statistics 19 software (IBM, Armonk, NY, USA). The chemometrics-based analyses on fingerprints, including common model fitting, similarity evaluation and multivariate statistical analysis, were conducted on Chemometrics Analysis System 2017 (Chemmind Technologies (Beijin) CO., LTD., Beijin). The common model of assigned fingerprints was fitted with a Gaussian curve. The similarity values of all input fingerprints relative to the corresponding common model were calculated by the method of angle cosine (cosθ) and correlation coefficient (R). Principal component analysis (PCA) and partial least squares discriminant analysis (PLS-DA) on the data matrix of fingerprints were performed.
3. Results and discussion
3.1. Extraction yields and components of LRPs
Thirty-nine polysaccharides were isolated from different parts of lotus root varieties and coded as seen in Table 1. Their extraction yields ranging from 0.39 to 32.00 mg g−1 FW showed obvious differences among varieties and parts. The average polysaccharide yields of flesh, peel and node were 10.61, 8.72 and 4.15 mg g−1 FW, with the variation coefficients of 65.59%, 101.33% and 110.48%, respectively. In addition, the ranges of total sugar content in flesh, peel and node LRPs were 41.03–97.61%, 40.25–77.60% and 30.19–69.10%, and those of protein content were 0.58–2.59%, 0.38–8.35% and 4.36–9.37%, respectively. The results suggest varietal differences in lotus root would significantly impact amounts and nature of LRPs developed. No.5 elian and No. 8 elian are obviously the varieties with a high content of polysaccharides.| Sample code | Lotus root varieties | Root parts | Yield (mg g−1 FW) | Total sugar content (%) | Protein content (%) |
|---|---|---|---|---|---|
| a Values were expressed as means ± standard deviation (n = 3). Different letters indicate the significant difference (P < 0.05) between values in the same part group. | |||||
| 1 | Zoumayang | Flesh | 4.37 ± 0.68 | 72.08 ± 1.15 g | 1.01 ± 0.00 abc |
| 2 | Yingcheng-Bailian | Flesh | 7.87 ± 0.40 | 68.64 ± 0.89 ef | 0.73 ± 0.04 ab |
| 3 | No. 2 Wuzhi | Flesh | 0.53 ± 0.10 | 97.61 ± 1.74 h | 0.58 ± 0.05 a |
| 4 | Guixi-Fuou | Flesh | 0.90 ± 0.10 | 41.12 ± 1.05 a | 2.59 ± 0.19 d |
| 5 | No. 8 elian | Flesh | 14.18 ± 0.37 | 49.95 ± 1.48 b | 1.01 ± 0.18 abc |
| 6 | No. 7 elian | Flesh | 7.93 ± 0.81 | 66.34 ± 2.92 e | 1.13 ± 0.20 bc |
| 7 | No. 6 elian | Flesh | 14.06 ± 0.96 | 61.16 ± 1.48 d | 1.16 ± 0.19 bc |
| 8 | No. 5 elian | Flesh | 24.19 ± 2.89 | 71.31 ± 1.91 fg | 1.04 ± 0.17 abc |
| 9 | Changzhou-Piaojiang | Flesh | 6.88 ± 0.50 | 43.29 ± 1.65 a | 1.25 ± 0.21 bc |
| 10 | Bobaiou | Flesh | 15.26 ± 1.76 | 42.34 ± 0.92 a | 0.95 ± 0.19 abc |
| 11 | Baipaozi | Flesh | 11.37 ± 1.44 | 41.03 ± 0.39 a | 1.34 ± 0.11 c |
| 12 | Baheou | Flesh | 10.47 ± 1.26 | 41.34 ± 0.12 a | 1.28 ± 0.18 bc |
| 13 | 8143 | Flesh | 19.89 ± 0.88 | 58.02 ± 1.87 c | 0.76 ± 0.05 ab |
| 14 | Zoumayang | Peel | 1.77 ± 0.34 | 69.14 ± 2.76 e | 2.81 ± 0.30 de |
| 15 | Yingcheng-Bailian | Peel | 1.89 ± 0.30 | 63.41 ± 0.89 d | 2.34 ± 0.14 de |
| 16 | No. 2 Wuzhi | Peel | 0.48 ± 0.08 | 69.53 ± 0.64 e | 0.98 ± 0.22 b |
| 17 | Guixi-Fuou | Peel | 0.45 ± 0.01 | 64.30 ± 1.32 d | 1.77 ± 0.14 c |
| 18 | No. 8 elian | Peel | 8.88 ± 0.01 | 77.60 ± 1.59 f | 1.16 ± 0.14 b |
| 19 | No. 7 elian | Peel | 32.00 ± 0.69 | 65.15 ± 1.71 d | 5.63 ± 0.43 h |
| 20 | No. 6 elian | Peel | 6.08 ± 0.64 | 47.99 ± 2.21 b | 2.25 ± 0.43 d |
| 21 | No. 5 elian | Peel | 18.49 ± 2.07 | 50.07 ± 1.41 b | 2.63 ± 0.09 de |
| 22 | Changzhou-Piaojiang | Peel | 8.06 ± 0.66 | 63.92 ± 1.00 d | 2.92 ± 0.19 e |
| 23 | Bobaiou | Peel | 6.27 ± 0.50 | 40.25 ± 0.35 a | 8.35 ± 0.52 i |
| 24 | Baipaozi | Peel | 10.94 ± 1.45 | 51.35 ± 4.19 b | 3.63 ± 0.24 f |
| 25 | Baheou | Peel | 4.06 ± 0.31 | 55.85 ± 0.57 c | 5.08 ± 0.16 g |
| 26 | 8143 | Peel | 13.94 ± 0.32 | 66.98 ± 1.55 de | 0.38 ± 0.09 a |
| 27 | Zoumayang | Node | 1.65 ± 0.24 | 48.54 ± 0.70 e | 6.38 ± 0.13 f |
| 28 | Yingcheng-Bailian | Node | 0.63 ± 0.09 | 63.11 ± 1.07 i | 5.65 ± 0.19 cd |
| 29 | No. 2 Wuzhi | Node | 0.44 ± 0.05 | 46.38 ± 0.52 d | 7.68 ± 0.10 h |
| 30 | Guixi-Fuou | Node | 0.39 ± 0.03 | 41.07 ± 0.52 c | 8.35 ± 0.10 i |
| 31 | No. 8 elian | Node | 16.85 ± 1.48 | 41.83 ± 1.52 c | 4.82 ± 0.05 b |
| 32 | No. 7 elian | Node | 2.61 ± 0.44 | 52.66 ± 1.26 f | 9.37 ± 0.05 j |
| 33 | No. 6 elian | Node | 1.51 ± 0.32 | 59.72 ± 1.09 h | 4.36 ± 0.14 a |
| 34 | No. 5 elian | Node | 9.14 ± 1.75 | 69.10 ± 0.96 j | 5.46 ± 0.11 c |
| 35 | Changzhou-Piaojiang | Node | 3.77 ± 0.44 | 55.89 ± 0.13 g | 7.42 ± 0.19 g |
| 36 | Bobaiou | Node | 3.05 ± 0.01 | 33.85 ± 0.84 b | 9.37 ± 0.05 j |
| 37 | Baipaozi | Node | 3.55 ± 0.68 | 44.89 ± 1.91 d | 6.07 ± 0.10 e |
| 38 | Baheou | Node | 3.43 ± 0.31 | 53.85 ± 0.84 f | 5.89 ± 0.19 de |
| 39 | 8143 | Node | 6.87 ± 0.47 | 30.19 ± 0.70 a | 5.71 ± 0.05 cd |
3.2. UV fingerprints of LRPs
All the UV spectra (not shown) of LRPs exhibited strong absorption in the wavelength range of 200–220 nm, assigned to unsaturated carbonyl and carboxyl groups.11,14 The weak absorption at about 280 nm was primarily attributed to proteins. The spectra of LRPs from different parts showed significant differences. According to the comparison of the absorption intensities at 205 nm and 280 nm, it could be concluded that peel and node LRPs generally possessed more uronic acids and proteins than flesh LRPs. In addition, a comparison using the UV fingerprint revealed that LRPs showed no crucial difference from other plant polysaccharides, such as Lycium barbarum polysaccharides14 and tea polysaccharides.11 Although UV detection was unable to identify the authenticity of LRPs, it could be helpful in quality control to distinguish parts of the root from which LRPs were isolated. In general, both the absorption intensities at 205 nm and 280 nm could be ordered as node LRPs > peel LRPs > flesh LRPs.3.3. FTIR fingerprints of LRPs
As seen in Fig. 3A, the FTIR spectra of LRPs displayed some common characteristic bands, including O–H stretching vibration and N–H stretching vibration at about 3410 cm−1, C–H stretching vibration at about 2930 cm−1, C![[double bond, length as m-dash]](https://www.rsc.org/images/entities/char_e001.gif) O stretching vibration and N–H bending vibration at about 1630 cm−1, C–O stretching vibration and CO symmetrical stretching vibration at about 1420 cm−1 and O–H bending vibration at about 1076 cm−1.3,9 The trough at 618 cm−1 indicated the existence of sulfuric acid ester linkages and the trough at 518 cm−1 results from vibrations of C–(CH2)n– (n ≥ 4).3
O stretching vibration and N–H bending vibration at about 1630 cm−1, C–O stretching vibration and CO symmetrical stretching vibration at about 1420 cm−1 and O–H bending vibration at about 1076 cm−1.3,9 The trough at 618 cm−1 indicated the existence of sulfuric acid ester linkages and the trough at 518 cm−1 results from vibrations of C–(CH2)n– (n ≥ 4).3
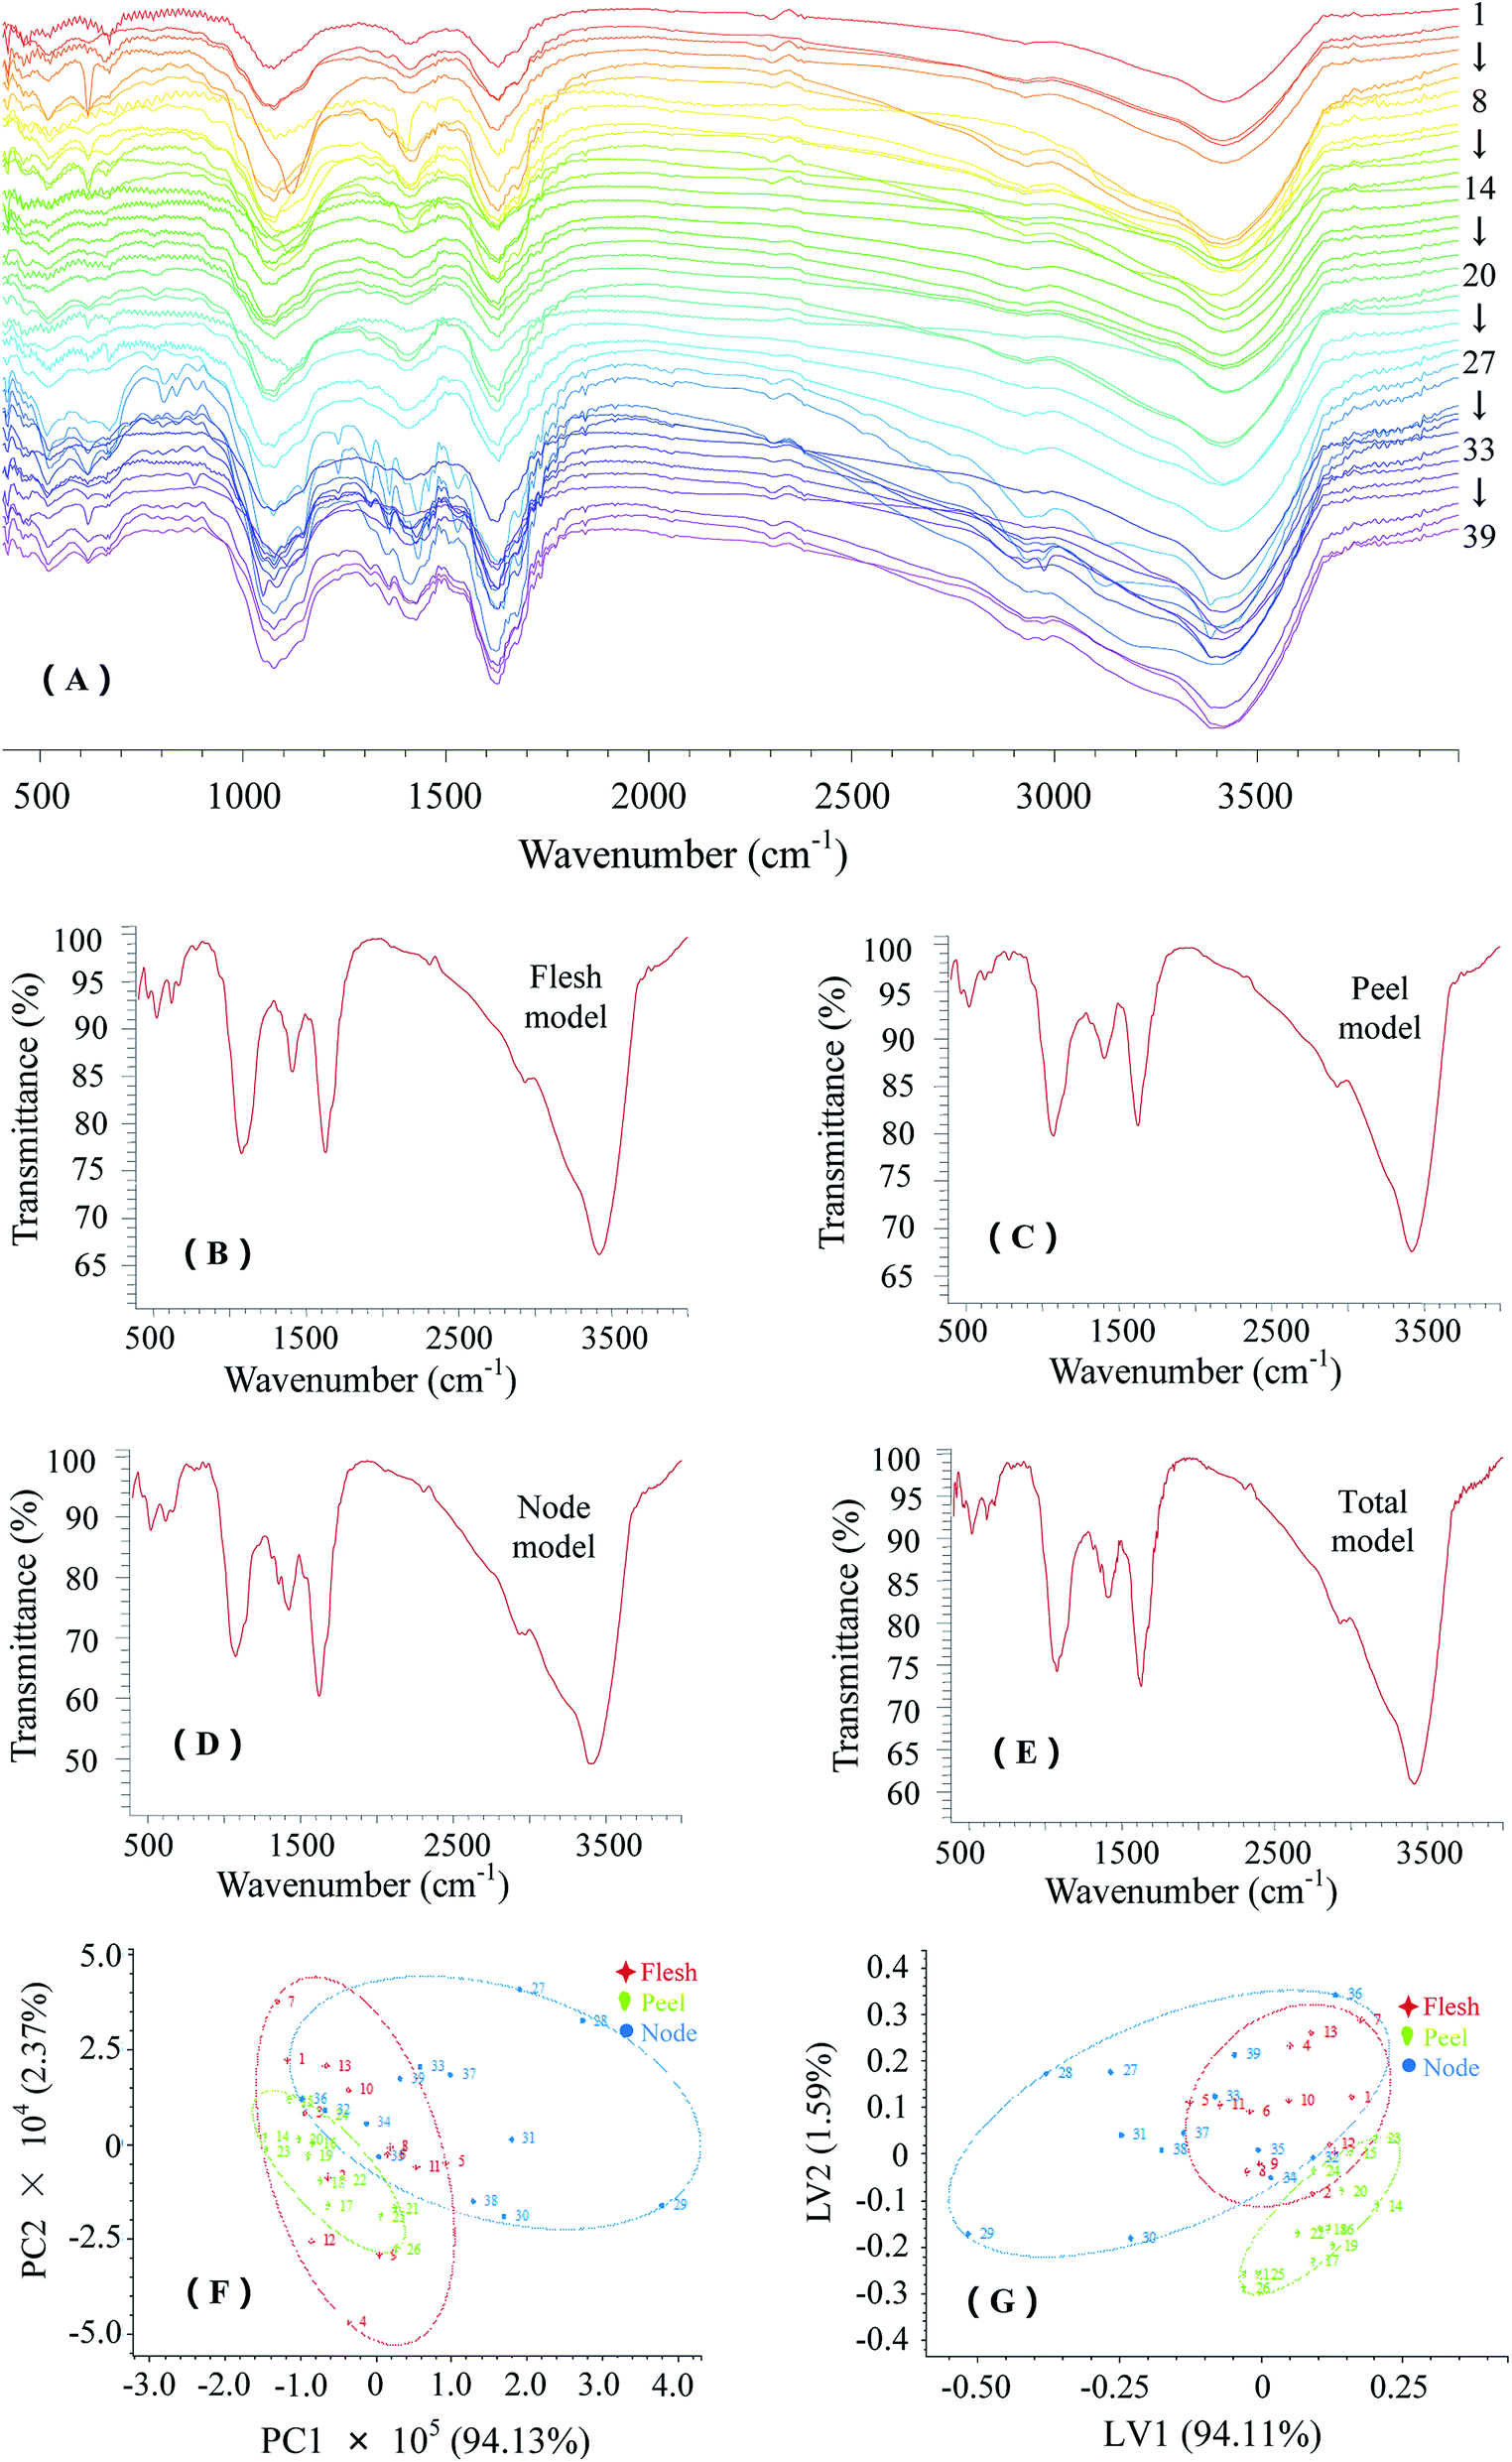 | ||
| Fig. 3 The FTIR fingerprints and chemometrics-based score plots of LRPs: (A) the FTIR fingerprints of 39 LRPs; (B)–(D) the common FTIR fingerprint models corresponding to LRPs from different lotus root parts; (E) the common FTIR fingerprint model of 39 LRPs; (F) the PCA score plot of LRPs; (G) the PLS-DA score plot of LRPs. | ||
The common FTIR models were established on the average vector of selected FTIR fingerprints, in particular, the models of flesh LRPs, peel LRPs and node LRPs were formed as representative references (Fig. 3B–D). The node model had a higher intensity ratio of 1630 cm−1 trough to 1076 cm−1 trough and a unique trough at 1360 cm−1, which was consistent with UV detection findings that node LRPs generally held more amino groups and carbonyl groups than peel LRPs and flesh LRPs. The FTIR fingerprint information of LRPs were mostly concentrated in the range of 1800–400 cm−1. Therefore, the similarity of the sample FTIR fingerprint to the total common model (Fig. 3E) was evaluated with correlation coefficient (R) and cosine (cosθ) values in this range (data not shown). The average R value and minimum R value were 0.89 and 0.80, and the average cosθ value and minimum cosθ value were 1.00 and 0.98, respectively. In light of the high similarity of 39 FTIR fingerprints, their total common model could be used as a standard fingerprint for differentiating LRPs from other plant polysaccharides, such as longan pulp polysaccharides,23 Lycium barbarum polysaccharides14 and tea polysaccharides.11 The most commonly used multivariate analytical methods, unsupervised PCA and supervised PLS-DA complement each other in providing visualizable representations of information-rich fingerprinting data by means of dimensionality reduction.24 Based on the separations observed between groups, the resultant two- or three-dimensional score plots can effectively identify the fingerprint features of polysaccharides contributing to between-group variability.14,15,19 These features are generally typical evidences for the quality control of polysaccharides. Therefore, the PCA and PLS-DA score plots derived from the data matrix of FTIR fingerprints were established (Fig. 3F and G). The PCA model with two components explained 96.50% of the total variance between the samples (PC1 captured 94.13%), and the PLS model with two latent variables explained 95.70% of the total variance (LV1 captured 94.11%). In the plots, peel LRPs were relatively centralized and could be separated from node LRPs. It was found that PLS-DA provided better discriminability than PCA. Accordingly, plots consisting of 362 variables within 1800–400 cm−1 were built to explore the effect of these variables on sample separation (data not shown). The variables in the range of 1650–1600 cm−1 contributed negatively to PC1 and positively to LV1, while the variables in the range of 1105–1140 cm−1 contributed positively to PC2 and negatively to LV2. They mainly contributed to the separation between the groups of peel LRPs and node LRPs. Specifically, the differences of samples 27–31 from others could be attributed to their strong absorptions at about 1650 cm−1, 1410 cm−1 and 1075 cm−1.
3.4. PCD-HPLC fingerprints of LRPs
Based on high sensitivity analysis methods such as PCD-HPLC,14,15 high-performance ion chromatography,11 high performance thin layer chromatography18,25 and carbohydrate gel electrophoresis,18 the monosaccharide composition related fingerprints have been widely used for quality control of active polysaccharides. The PCD-HPLC method previously established with systematic methodology validation was implemented for the monosaccharide composition analysis of LRPs, as seen in Fig. 4. Their chromatographic peaks were reasonably separated (Fig. 4A), and respectively belonged to Man (12.87 min), Rib (16.99 min), Rha (18.32 min), GlcA (20.13 min), GalA (22.85 min), Glc (27.26 min), Gal (31.19 min) and Ara (33.45 min) according to the chromatogram of monosaccharide standards (not shown). The retention times of the peaks were relatively stable (RSD < 1.8%), but their area ratios were significantly different.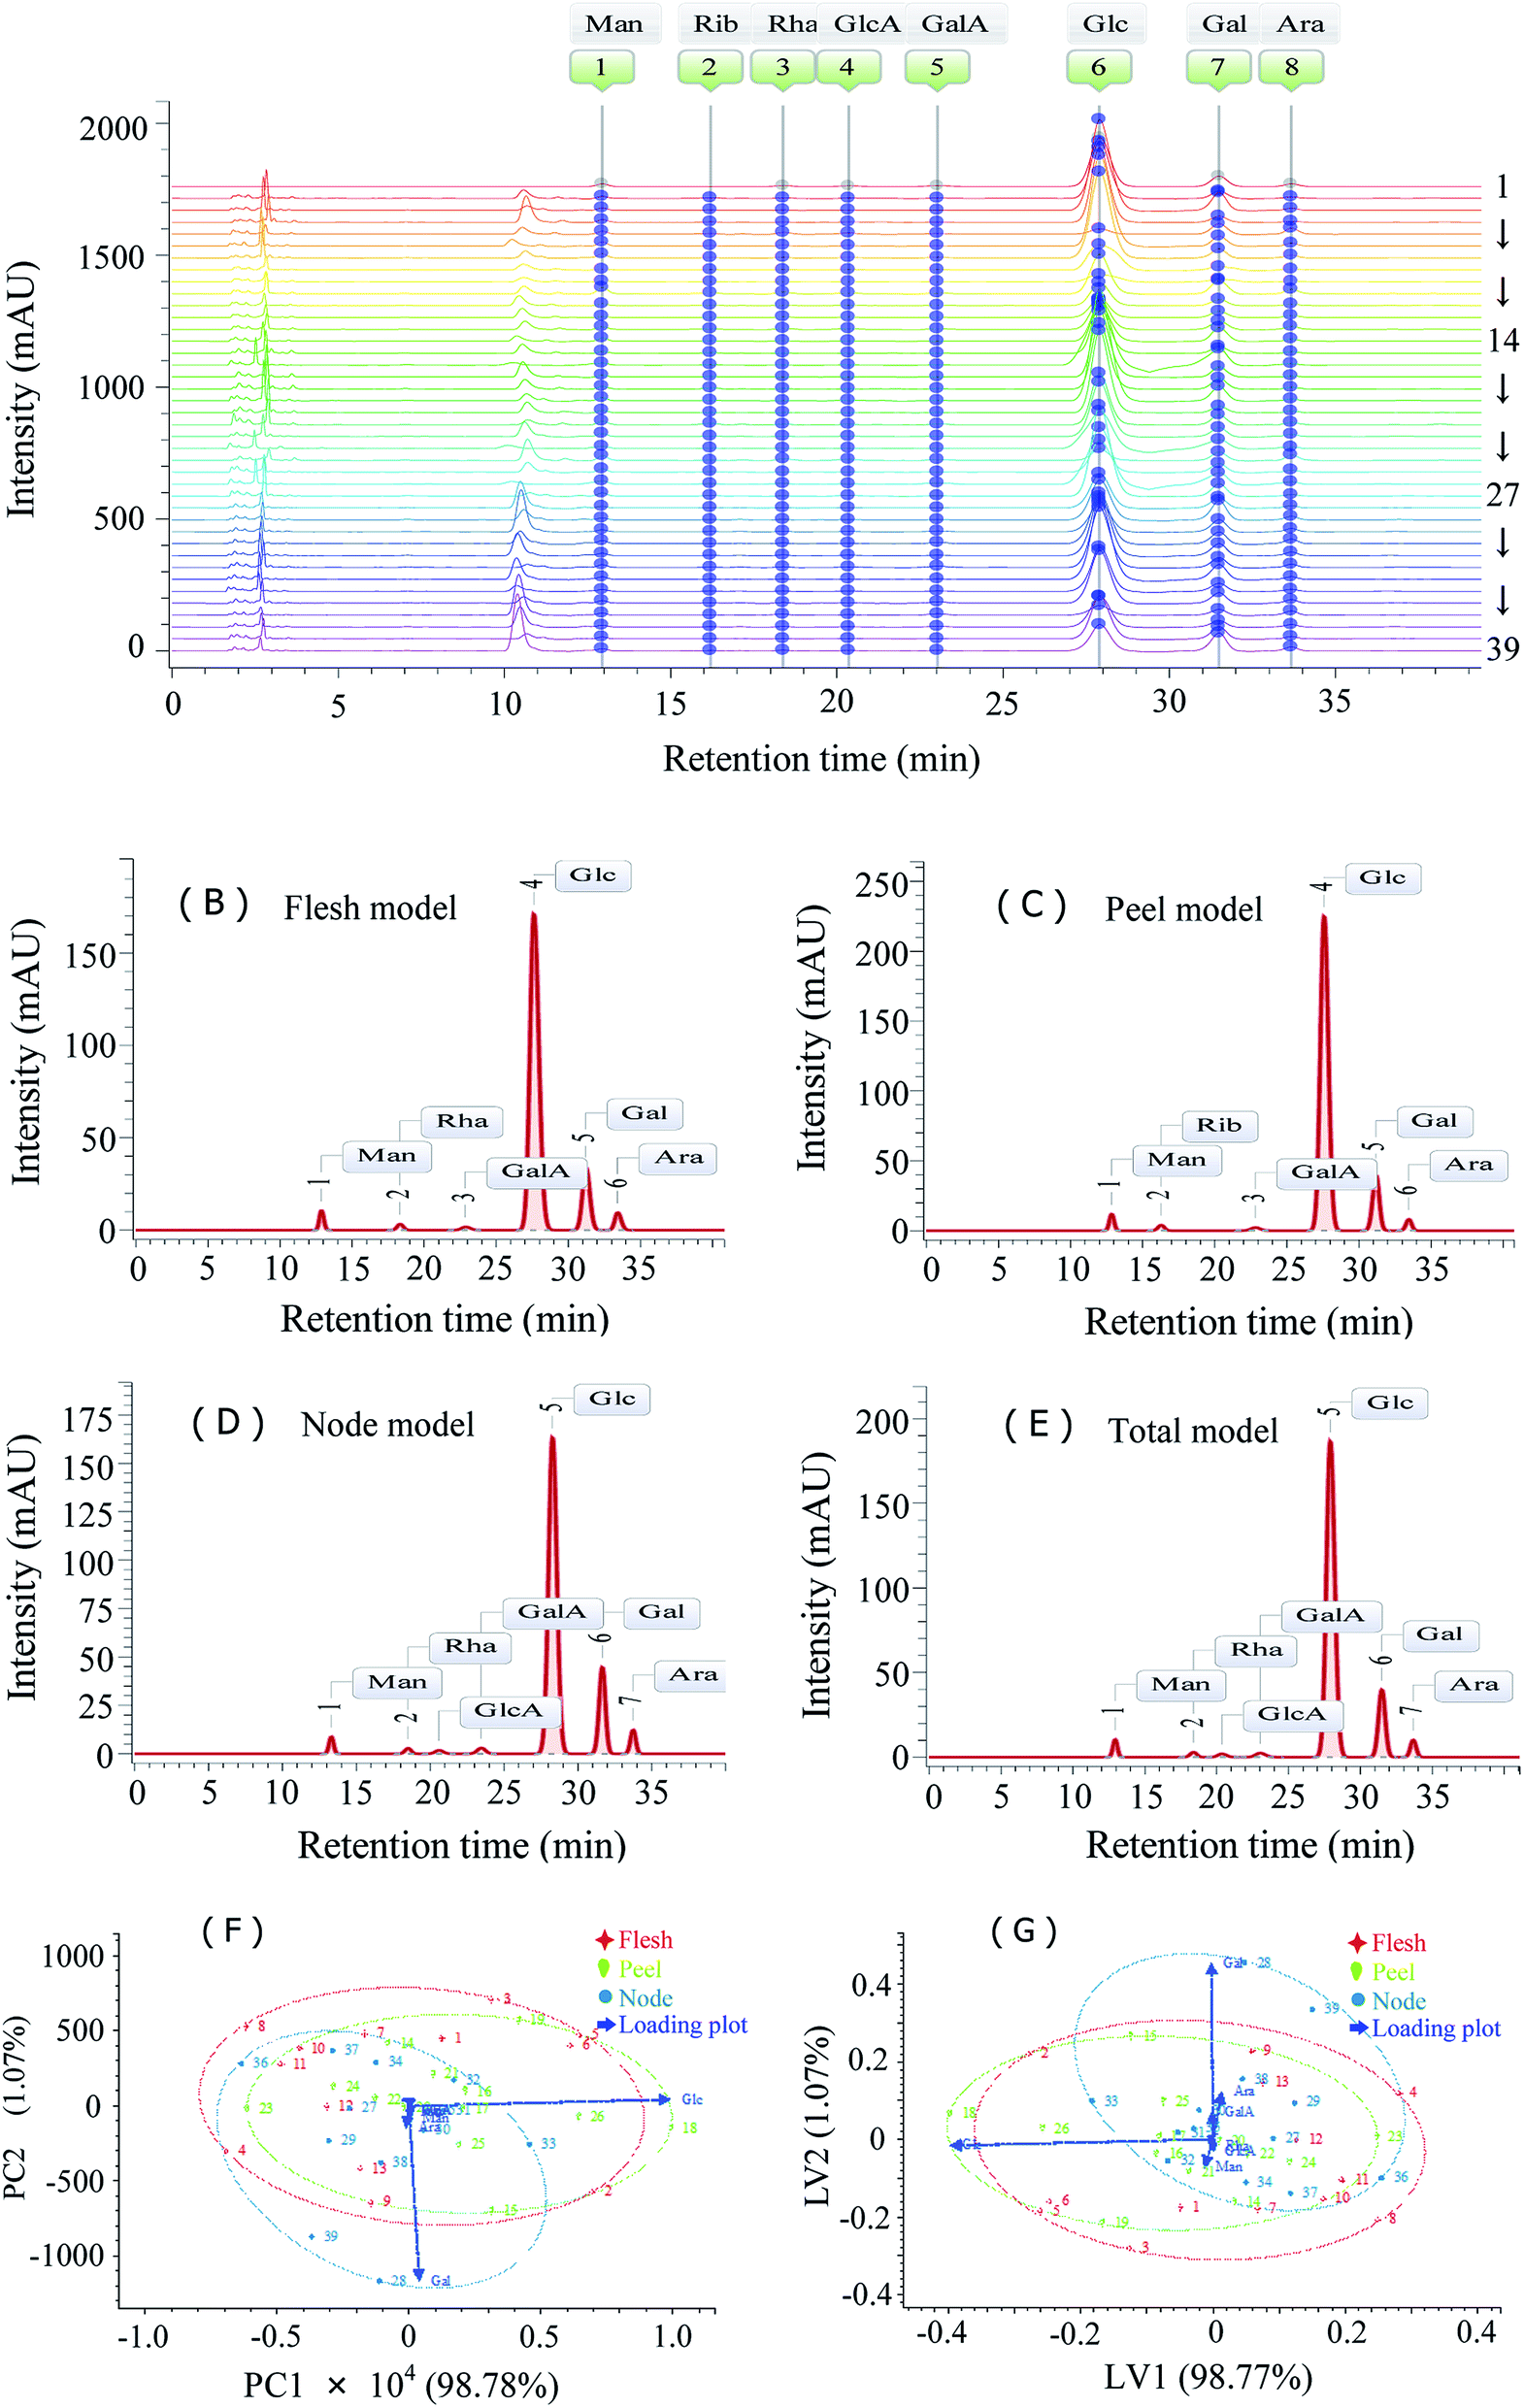 | ||
| Fig. 4 The PCD-HPLC fingerprints and chemometrics-based plots of LRPs: (A) the PCD-HPLC fingerprints of 39 LRPs; (B)–(D) the common PCD-HPLC fingerprint models corresponding to LRPs from different lotus root parts; (E) the common PCD-HPLC fingerprint model of 39 LRPs; (F) the PCA score plot and loading plot of LRPs; (G) the PLS-DA score plot and loading plot of LRPs. | ||
The common model of PCD-HPLC fingerprints was formed under the minimum common peak area percentage of 1%. The models of LRPs from different parts were similar (Fig. 4B–D). All the LRPs were mainly composed of Glc, Gal, Ara, Man and GalA, as seen in Fig. 5. Particularly, samples 4, 23 and 36 with lower molar percentage of Glc presented obvious differences in monosaccharide composition from others. The total common model of PCD-HPLC fingerprints contained 7 common peaks, which were respectively identified as Man, Rha, GlcA, GalA, Glc, Gal and Ara with the molar ratio of 0.19:0.14:0.08:0.17:6.49:1.00:0.16. Glc and Gal accounted for 91.81% of the total peak area. The similarity of the sample fingerprint to the total common model was calculated. The R values ranged from 0.51 to 1.00 with an average value of 0.98 and a variation coefficient of 8.19%. The cosθ values ranged from 0.64 to 1.00 with an average value of 0.98 and a variation coefficient of 6.25%. The PCD-HPLC fingerprint characteristics of LRPs were highly similar and could be used for the identification of LRPs.
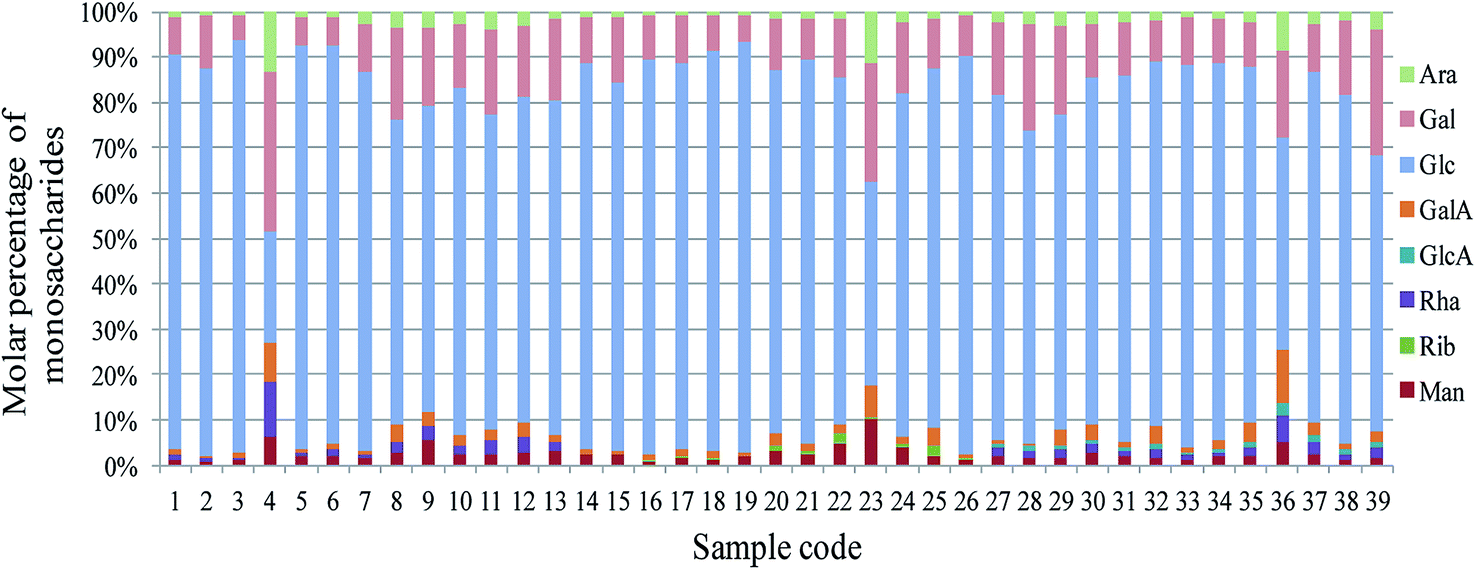 | ||
| Fig. 5 The molar percentage of monosaccharides in LRPs. | ||
The data matrix from PCD-HPLC fingerprints were constructed with PCA and PLS-DA. The corresponding score plots are shown in Fig. 4F and G. The PCA model containing two components explained 99.85% of the total variance, and the PLS model containing two latent variables also explained 99.84% of the total variance. LRPs from different parts could not be differentiated in the plots. As seen in the loading plots, Glc contributed positively to PC1 and negatively to LV1, and Gal contributed negatively to PC2 and positively to LV2. They were the main variables contributing to the deviation of certain samples from most of the others. In the PCA score plot, samples with a high molar ratio of Glc to Gal were distributed on the top right corner, and those with a low molar ratio were distributed on the bottom left corner. The distribution was opposite in the PLS-DA score plot.
3.5. HPSEC fingerprints of LRPs
Plant-derived natural polysaccharides are generally composed of several fractions with different molecular weights. The resulting diversity of molecular weight distribution can also be exploited for differentiating polysaccharides from different sources, and the HPSEC fingerprint has attracted much attention.14,19 The molecular weight distributions of LRPs were measured by a HPSEC-RI-PDA method, as shown in Fig. 6A and 7A. The RI signal positively responded to LRPs in a non-specifical concentration-dependent manner, and the PDA signal (280 nm) belonged to their free and polysaccharide-binding proteins. | ||
| Fig. 6 The HPSEC-RI fingerprints and chemometrics-based plots of LRPs: (A) the HPSEC-RI fingerprints of 39 LRPs; (B)–(D) the common HPSEC-RI fingerprint models corresponding to LRPs from different lotus root parts; (E) the common HPSEC-RI fingerprint model of 39 LRPs; (F) the PCA score plot and loading plot of LRPs; (G) the PLS-DA score plot and loading plot of LRPs. | ||
 | ||
| Fig. 7 The HPSEC-PDA fingerprints and chemometrics-based plots of LRPs: (A) the HPSEC-PDA fingerprints of 39 LRPs; (B)–(D) the common HPSEC-PDA fingerprint models corresponding to LRPs from different lotus root parts; (E) the common HPSEC-PDA fingerprint model of 39 LRPs; (F) the PCA score plot and loading plot of LRPs; (G) the PLS-DA score plot and loading plot of LRPs. The wavelength used for determination was 280 nm. | ||
The HPSEC-RI fingerprints contributed to a comprehensive understanding of the molecular weight distributions of LRPs (Fig. 6A). The fingerprints all had more than 5 peaks in the retention time range of 12.96–16.80 min. Their common models were established under the minimum common peak area of 5% for investigation of between-group variability (Fig. 6B–D). The models corresponding to LRPs from different parts all had the common peaks of 18.54 kDa (13.00 min), 11.57 kDa (13.82 min), 9.18 kDa (14.30 min), 5.94 kDa (15.47 min) and 5.30 kDa (15.90 min). However, their peak area ratios were significantly different: the flesh model was 4.63:27.10:3.03:35.04:27.16; the peel model was 4.18:34.49:7.05:24.19:25.55; and the node model was 2.83:24.23:3.38:44.34:14.43. In addition, node LRPs contained more fractions with low molecular weight (<5.0 kDa). Seven common peaks in the total HPSEC-RI fingerprint model (Fig. 6E) accounted for more than 90% of the total peak area. The HPSEC-RI fingerprint similarities of samples to the total common model were acceptable: the average R value was 0.81 with a variation coefficient of 25.67%; the average cosθ value was 0.90 with a variation coefficient of 12.33%. In particular, samples 4, 20, 23 and 36 remarkably differed from others.
PCA and PLS-DA were performed to build the score plot and loading plot to explore the potential factions responsible for the between-group variability of LRPs (Fig. 6F and G). The PCA score plot was established with three principal components explaining 88.16% of the total variance. LRPs from fleshes and peels could not be differentiated in the PCA model, but most of node LRPs were visually separated from them. The main factors contributing to the separation were variable 2 (peak 2T), variable 5 (peak 5T) and variable 6 (peak 6T): variable 2 and 5 primarily contributed to PC1 and PC3, while variable 5 and 6 primarily contributed to PC2. Obviously, samples no. 4, 23 and 36 clustered off center, possibly due to their common characteristics (the larger peak areas of peak 1T and 2T relative to peak 5T). The PLS-DA score plot was established with three latent variables explaining 82.97% of the total variance. The variables 5–7 contributed mainly to the dispersion of samples. Variable 6 and 7 contributed positively to LV 1, LV2 and LV3, while variable 5 contributed negatively to LV1 and LV2. Therefore, it was suggested that 5.94 kDa and 5.30 kDa fractions were mainly associated with the variation of molecular weight distribution of LRPs.
Previous studies indicated that lotus root polysaccharides were partly protein-bound complexes.3,9 LRPs all had small amounts of protein. Therefore, the HPSEC-PDA fingerprints complemented to the HPSEC-RI fingerprints were established to explore the molecular weight distribution of proteins in LRPs and to investigate the existence form of proteins (Fig. 7A). The HPSEC-PDA fingerprint characteristics distributed in the retention time range of 12.55–15.43 min, in which the 17.56 kDa (12.55 min) and 8.52 kDa (13.84 min) peaks were the common features indicating that the molecular weights of protein related fractions in LRPs from different parts were mostly close (Fig. 7B–D).
The total common model of HPSEC-PDA fingerprints was similar to the peel model, except for peak 5P′ which disappeared (Fig. 7E). Considering the gap between the signals of PDA and RI in HPSEC detection, the first common peak of the two total models was suggested to be same polysaccharide-protein complexes, with molecular weight close to that of the previous report.3 Likewise, the peaks 2T, 4T and 5T in the HPSEC-PDA total model respectively corresponded to the peaks 2T′, 3T′ and 6T′ in the HPSEC-RI total model could be also judged as polysaccharide-protein complexes.
The HPSEC-PDA fingerprint similarities of samples to total model was acceptable: the average R value was 0.88 with a variation coefficient of 24.75%; the average cosθ value was 0.92 with a variation coefficient of 15.10%. Particularly, samples 4, 23 and 36, in which the 17.56 kDa fraction contained most of the proteins, but not the 8.52 kDa fraction, were markedly different from others. The score plots of HPSEC-PDA fingerprints-based PCA and PLS-DA were built in order to visually differentiate samples between groups (Fig. 7F and G). The PCA score plot was formed by three principal components, explaining 90.27% of the total variance. Of these, PC1 and PC2 accounted for 64.38% and 17.74% of the variance, respectively. Most of the samples clustered together in the PCA model. Noticeably, samples 30, 31, 33 and 34 clustered together off center, and samples 4, 23 and 36 were dispersed away from the others. According to the loading plot derived from PCA model, the main factors leading to their separation were peaks 1T′ and 2T′. The principal contributors to PC1 were variables 1 and 4, those to PC2 were variables 2 and 3, and the ones to PC3 were variables 2 and 4. The PLS-DA score plot contained three latent variables explaining 90.25% of the total variance and showed a similar performance to the PCA score plot. The main contributors promoting the separation were variables 1–3. Therefore, the proteins existed in the fractions with molecular weight larger than 8.52 kDa should be mainly taken into account for exploring the diversity of LRPs.
In this work, the multiple fingerprints of LRPs were systematically investigated using the methods of FTIR, PCD-HPLC and HPSE-RI-PDA, which complemented each other. Although LPRs overall showed relatively high similarity in the four kinds of fingerprint, slight differences among those from different lotus root parts were found by comparing their common models with each other. The main factors contributing to the differences were further identified by the methods of PCA and PLS-DA, which deserved great attentions include: (1) the intensity ratio of absorption at 1650 cm−1 to that at 1075 cm−1 in the FTIR spectrum; (2) the molar ratio of Glc to Gal; (3) the peak area ratio of 5.94 kDa fraction to 5.30 kDa fraction in the HPSEC-RI chromatogram; (4) the peak area ratio of 17.56 kDa fraction to 8.52 kDa fraction in the HPSEC-PDA chromatogram. These factors can be the key to the quality control of LRPs or tracing back to their sources. In addition, the total common fingerprint models can be served as standard fingerprints for indentifying the authenticity of LPRs. However, the fingerprint methods established in the present work remain some limitations. In particular, the methods fail to effectively confirm the authenticity of some highly purified fractions of LRPs (data not shown). The unique structural features and chemical composition of polysaccharide resulted in a different fingerprinting profile are quite important for authentication.14 More efforts may be in urgent need of illuminating the fine structures of LRPs.
Moreover, some fingerprint features of polysaccharides may be associated with their specific functions.26 Fingerprint-based multivariate statistical analysis of LRPs has been applied to explore the crucial characteristics contributing to their antioxidant, cancer cell growth inhibitory and immunostimulatory activities, providing new insights in the structure–activity relationship of polysaccharides.27 Those characteristics are probably regarded as a guarantee of effective activities.
4. Conclusions
Thirty-nine polysaccharides, isolated from different parts of 13 lotus root varieties, were used for investigation on the authenticity and quality stability of LRPs. The physicochemical features of LRPs were determined comprehensively by the analyses of UV, FTIR, PCD-HPLC and HPSEC. The key findings on LRPs were as follows: LRPs contained mainly polysaccharides (5.94 kDa) and polysaccharide-protein complexes (11.57 kDa and 5.30 kDa); their carbohydrates were composed of Man, Rha, GlcA, GalA, Glc, Gal and Ara in the molar ratio of 0.19:0.14:0.08:0.17:6.49:1.00:0.16; and node LRPs possessed more binding proteins and uronic acids than flesh or peel LRPs. The fingerprints of FTIR, PCD-HPLC, HPSEC-RI and HPSEC-PDA were established to explore the similarity and variability of LRPs. The multiplex fingerprints of LRPs all exhibited relatively high similarity, and the corresponding common model could be used as standard fingerprint for the identification of LRPs. Both PCA and PLS-DA on the fingerprint data matrix failed to distinguish LRPs from different parts. The PLS-DA model of FTIR fingerprints successfully separated node LRPs from peel LRPs. In addition, the main characteristics contributing to the differentiation could potentially be used for the quality control of LRPs or tracing back to their sources. Multi-fingerprinting techniques combined with chemometrics provided a very precise, flexible and reliable method for the identification and quality control of lotus root polysaccharides.
Conflicts of interest
There are no conflicts to declare.Acknowledgements
This work was supported by the Youth Chenguang Program of Science and Technology in Wuhan (2016070204010154) and the Key Technology R&D Program of Hubei Province (2015BBA203).References
- N. An, H.-b. Guo and W.-d. Ke, Agric. Sci. China, 2009, 8, 31–39 CrossRef CAS.
- Y. Yi, J. Sun, J. Xie, T. Min, L.-M. Wang and H.-X. Wang, Molecules, 2016, 21, 863 CrossRef PubMed.
- Y. Jiang, T. B. Ng, Z. Liu, C. Wang, N. Li, W. Qiao and F. Liua, Biosci. Rep., 2011, 31, 381–390 CrossRef PubMed.
- D. Mukherjee, T. N. Khatua, P. Venkatesh, B. P. Saha and P. K. Mukherjee, J. Ethnopharmacol., 2010, 128, 490–494 CrossRef PubMed.
- M. Hu and L. H. Skibsted, Food Chem., 2002, 76, 327–333 CrossRef CAS.
- J. S. You, Y. J. Lee, K. S. Kim, S. H. Kim and K. J. Chang, Nutr. Res., 2014, 34, 258–267 CrossRef CAS PubMed.
- P. K. Mukherjee, K. Saha, M. Pal and B. P. Saha, J. Ethnopharmacol., 1997, 58, 207–213 CrossRef CAS PubMed.
- Y. Tsuruta, K. Nagao, B. Shirouchi, S. Nomura, K. Tsuge, K. Koganemaru and T. Yanagita, Biosci., Biotechnol., Biochem., 2012, 76, 462–466 CrossRef CAS PubMed.
- Z. Li, C. Lian, J. Sun, T. Min and Y. Yi, J. Food Sci. Technol., 2016, 34, 18–25 CAS.
- H. Li, MPhil, Huazhong Agricultural University, 2009.
- Y. Wang, J. Xian, X. Xi and X. Wei, Carbohydr. Polym., 2013, 92, 583–590 CrossRef CAS PubMed.
- Z. Li, X. Liu, R. W. Gituru, N. Juntawong, M. Zhou and L. Chen, Sci. Hortic., 2010, 125, 724–732 CrossRef CAS.
- Y.-C. Han, C.-Z. Teng, F.-H. Chang, G. W. Robert, M.-Q. Zhou, Z.-L. Hu and Y.-C. Song, Aquat. Bot., 2007, 87, 141–146 CrossRef CAS.
- W. Liu, J. Xu, R. Zhu, Y. Zhu, Y. Zhao, P. Chen, C. Pan, W. Yao and X. Gao, Int. J. Biol. Macromol., 2015, 78, 230–237 CrossRef CAS PubMed.
- X. Sun, H. Wang, X. Han, S. Chen, S. Zhu and J. Dai, Carbohydr. Polym., 2014, 114, 432–439 CrossRef CAS PubMed.
- L.-H. Pan, X.-F. Li, M.-N. Wang, X.-Q. Zha, X.-F. Yang, Z.-J. Liu, Y.-B. Luo and J.-P. Luo, Int. J. Biol. Macromol., 2014, 64, 420–427 CrossRef CAS PubMed.
- Y.-F. Zou, H. Barsett, G. T. T. Ho, K. T. Inngjerdingen, D. Diallo, T. E. Michaelsen and B. S. Paulsen, Carbohydr. Res., 2015, 403, 167–173 CrossRef CAS PubMed.
- D.-T. Wu, K.-L. Cheong, L.-Y. Wang, G.-P. Lv, Y.-J. Ju, K. Feng, J. Zhao and S.-P. Li, Carbohydr. Polym., 2014, 103, 100–109 CrossRef CAS PubMed.
- K.-L. Cheong, D.-T. Wu, Y. Deng, F. Leong, J. Zhao, W.-J. Zhang and S.-P. Li, Carbohydr. Polym., 2016, 153, 47–54 CrossRef CAS PubMed.
- L. Yan, S.-m. Zhang, F.-h. Zhang, B.-x. Shi, S.-y. Li and Q.-h. Li, Food Sci., 2007, 28, 226–230 CAS.
- M. Dubois, K. A. Gilles, J. K. Hamilton, P. A. Pebers and F. Smith, Anal. Chem., 1956, 28, 350–356 CrossRef CAS.
- J. Dai, Y. Wu, S.-w. Chen, S. Zhu, H.-p. Yin, M. Wang and J. Tang, Carbohydr. Polym., 2010, 82, 629–635 CrossRef CAS.
- M.-M. Han, Y. Yi, H.-X. Wang and F. Huang, Molecules, 2017, 22, 938 CrossRef PubMed.
- B. Worley, S. Halouska and R. Powers, Anal. Biochem., 2013, 433, 102–104 CrossRef CAS PubMed.
- X. Di, K. K. C. Chan, H. W. Leung and C. W. Huie, J. Chromatogr. A, 2003, 1018, 85–95 CrossRef CAS PubMed.
- Z. Li, K. Nie, Z. Wang and D. Luo, PLoS One, 2016, 11, e0163536 Search PubMed.
- Y. Yi, O. Lamikanra, J. Sun, L.-M. Wang, T. Min and H.-X. Wang, Carbohydr. Polym., 2018, 190, 67–76 CrossRef CAS PubMed.
Footnote |
| † These authors contributed equally to this work. |
| This journal is © The Royal Society of Chemistry 2018 |