DOI:
10.1039/C8RA01025K
(Paper)
RSC Adv., 2018,
8, 19868-19878
Fabrication and characterization of a folic acid-bound 5-fluorouracil loaded quantum dot system for hepatocellular carcinoma targeted therapy
Received
1st February 2018
, Accepted 2nd May 2018
First published on 29th May 2018
Abstract
In the present study, we covalently coupled folic acid (FA) and 5-fluorouracil acetic acid (FUA) on the surface of quantum dots (QDs) to produce a tumor targeting drug delivery system, FA-QDs-FUA. The QDs not only act as hepatocellular carcinoma (HCC)-targeted delivery vehicles, but also play a key role in imaging. The structural and optical properties of as-prepared FA-QDs-FUA were characterized using UV-visible spectra, fluorescence spectra, infrared spectra, particle size and zeta potential. In vitro hemolysis activity, cytotoxicity and targeting specificity of the FA-QDs-FUA system were also evaluated. The in vivo anti-tumor efficacy of FA-QDs-FUA in tumor-bearing mice was investigated. The average particle size and zeta potential of FA-QDs-FUA was 220.28 nm and −13.3 mV, respectively. The drug-loading content of FA-QDs-FUA was 36.85% ± 1.61% (n = 3). The in vitro release profile of 5-FU from FA-QDs-FUA demonstrated a slow and sustained release behaviour as compared to free 5-FU drug. The results of the in vitro cellular experiment demonstrated that FA-QDs-FUA reduced cytotoxicity as compared to free 5-FU and targeted more easily hepatocellular carcinoma cells (SMMC-7721 and HepG2) than normal cells. Mice treated with FA-QDs-FUA showed superior tumor suppression compared to those treated with free 5-FU at 4.72 mg kg−1 of 5-FU. Therefore, the FA-QDs-FUA system can be used as a promising candidate for improving 5-FU efficacy and tumor targeting specificity with limited toxicity.
Introduction
Hepatocellular carcinoma (HCC) is the fifth most common cancer and the third most cause of cancer-related death in men, with an increasing incidence worldwide.1,2 A number of therapeutic approaches for the treatment of HCC, which include liver resection, liver transplantation, transarterial chemoembolization, selective intra-arterial radiotherapy, chemotherapy, and immunotherapy, have become available.1–3 However, allocation of the available treatment options is influenced not only by HCC stage but also by the degree of liver dysfunction.3 The majority of HCC cases are firstly diagnosed in the intermediate or advanced stage when chemotherapy is often considered a suitable option.2,3
5-Fluorouracil (5-FU), which interferes with nucleic acid synthesis by blocking the production of pyrimidine nucleotide dTMP from dUMP in de novo DNA synthesis, is widely used in chemotherapy for the treatment of many types of cancer such as liver cancer, breast cancer, colon cancer, gastric cancer, etc.4–6 However, its practical applications and clinical therapeutic effectiveness are hampered by its wide side effects such as myelosuppression, gastrointestinal toxicity, hematologic disturbance, and severe bone marrow deficiency.7 Herein, the search for an effective therapeutic strategy for cancer treatment is ongoing in order to reduce toxicity and side effects of the antineoplastic agent 5-FU in normal tissues.
Specific modification on the surface of drug carriers with paired ligands or antibodies could enhance the tumor targeting delivery and the better treatment outcome through active targeting by binding to the receptors specific over-expressed on tumor-cell surfaces.8–10 Studies have shown that drug vehicles modified with specific ligands including lactobionic acid or lactose,10 pullulan,11 peptide12 and glycyrrhetinic acid13 effectively target drugs to liver cancer cells via different receptors-mediated. It is well known that folate receptor (FR) was highly expressed on the surface of a spectrum of malignant tissue and cells,14–16 which provides unique opportunity to specifically target cancer cells by virtue of its high affinity for folic acid (FA) and folate analogs. Until now, FR targeting has been frequently exploited for a spectrum of solid tumor therapies, such as liver cancer,17 oral epidermoid carcinoma,18 cervical cancer,19 colorectal cancer,20 neuroblastoma,21 breast cancer,22 etc. In the current study, FA had been exploited for target therapies geared toward over-expressed folate receptors on liver cancer cells.
During the past several decades, various types of nanovehicles, including albumin nanoparticles,4 polymer nanoparticle,5,6 lipid nanoparticles,23 dendrimer,24 inorganic nanocarriers,18,25–27 have shown great promise in the delivery of anti-cancer drugs. Quantum dots (QDs), an alternative luminescent inorganic nanomaterial with rich surface chemistry and unique optical properties, have already been widely used in a number of biomedical studies.27–29 However, non-specific internalization and the toxicity of QDs may limit some in vivo biomedical applications.30,31 Poly (ethylene glycol) (PEG) dramatically suppresses the nonspecific interactions as well as provides additional degrees of freedom for the drug derivative to interact with its cellular target.30 And QDs modified with a variety of targeting ligands can selectively deliver therapeutic drugs into tumor sites and improve their bioavailability and safety.6,32,33 Herein, the terminus of the PEG chain is designed with a chemical functionality to facilitate attachment to the QDs surface in order to reduce the nonspecific interactions of QDs in our work.
This study aims to enhance the tumor targeting ability of 5-FU and further improve their therapeutic efficacy against tumors. To achieve this goal, FA-modified amino-surface functionalized QDs with PEG linker chains (FA-PEG-QDs) was synthesized and then was used together with FUA to prepare FA-mediated drug delivery systems (FA-QDs-FUA). The in vitro characterization, cytotoxicity, drug release profile, targeting specificity, and in vivo anti-tumor efficacy of the resulting system FA-QDs-FUA were discussed in detail.
Material and methods
Reagents and materials
Water-soluble amino-PEG-modified ZnCdSe/ZnS quantum dots(NH2-PEG-QDs) were supplied by Wuhan jiyuan quantum dot co. LTD. Boronic acid, sodium tetraborate, 1-ethyl-3-(3-dimethylaminopropyl) carbodiimide hydrochloride (EDC), N-hydroxysuccinimide (NHS) dimethyl sulfoxide (DMSO) and 5-fluorouracil (5-FU) were obtained from Sigma-Aldrich (St Louis, MO, USA). Dulbecco's Modified Eagle's Medium (DMEM), penicillin, streptomycin and fetal bovine serum (FBS) were purchased from Gibco (Grand Island, NY, USA). All other reagents were of analytical grade and used as received. Deionized water from a Milli-Q device (18.2 MΩ; Millipore, Molsheim, France) was used throughout this study. The normal hepatocyte line L02, the human hepatocellular carcinoma cell line HepG2 and SMMC-7721 were obtained from the Shanghai cell bank of Chinese Academy of Science (Shanghai, China). Balb/c Nod/Scid mice were purchased from Beijing Vital River Laboratory Animal Technology Co., Ltd. Sprague-Dawley (SD) rats were supplied by Laboratory Animal Center, University of South China, China. All animals were kept in a pathogen-free environment and fed ad lib. All animal procedures were strictly performed in accordance with the National Institutes of Health Guidelines for the Care and Use of Laboratory Animals (NIH Publication No. 85-23 Rev. 1985) and was approved by the Animal Use and Protection Committee of the University of South China (Hengyang, China).
Preparation of FA-QDs-FUA
5-fluorouracil acetic acid (FUA) was prepared according to our previous publication.34 The purified FUA (0.752 mg, 4 μmol) and FA (0.18 mg, 0.4 μmol) were activated in the presence of 40 mM EDC and 20 mM NHS for 30 min, respectively. Then, the resulting activated FA were added in the NH2-PEG-QDs (40 nM) solution dropwise at a molar ratio of 10![[thin space (1/6-em)]](https://www.rsc.org/images/entities/char_2009.gif) :1 (FA:PEG-QDs) in 20 mM boric acid buffer (pH 8.4) for 2 h at 37 °C. The FA-QDs conjugates were obtained by FA covalently linked onto the amino-surface functionalized QDs. Next step, the activated FUA were added into above reactants (FA-PEG-QDs) at a molar ratio of 100:1 (FUA:FA-PEG-QDs) in 20 mM boric acid buffer (pH 8.4) for 2 h at 37 °C. Finally, the final reactants FA-QDs-FUA system was purified by ultrafiltration (100 KDa, 12000 rpm, 15 min) using amicon ultra-4 centrifugal filter devices.
:1 (FA:PEG-QDs) in 20 mM boric acid buffer (pH 8.4) for 2 h at 37 °C. The FA-QDs conjugates were obtained by FA covalently linked onto the amino-surface functionalized QDs. Next step, the activated FUA were added into above reactants (FA-PEG-QDs) at a molar ratio of 100:1 (FUA:FA-PEG-QDs) in 20 mM boric acid buffer (pH 8.4) for 2 h at 37 °C. Finally, the final reactants FA-QDs-FUA system was purified by ultrafiltration (100 KDa, 12000 rpm, 15 min) using amicon ultra-4 centrifugal filter devices.
Characterization of FA-QDs-FUA
The UV-vis spectra of the FA-QDs-FUA solutions were scanned within the wavelength range of 200–500 nm at 25 °C and automatically corrected for the solutions, using a Shimadzu UV-1750 spectrophotometer (Shimadzu Instruments Corporation, Japan). The fluorescence spectra were recorded at an emission of 607 nm and the slit width of 5 nm using an F-7000 fluorescence spectrophotometer (Shimadzu Instruments Corporation, Japan). The conjugation of FUA to the FA-PEG-QDs matrix was confirmed using a Perkin-Elmer FT-IR spectrometer (Perkin Elmer Co., UK). The FA-QDs-FUA solutions were freeze-dried. And the dried samples were ground with KBr powder and compressed into pellets. The pellets were scanned from 4000 to 550 cm−1. The surface morphology of the FA-QDs-FUA was observed using scanning electron microscopy (SEM) (SU8010, Hitachi, Tokyo, Japan). Before observed the SEM, the sample was sputter-coated with gold. Particle size and zeta potential of FA-QDs-FUA was determined at 25 °C using Nano ZS90 Zeta sizer (Malvern Instruments Ltd, Malvern, UK). The concentration of drug from FA-QDs-FUA was determined in triplicate by a Shimadzu UV-1750 ultraviolet-visible spectrophotometer at 273 nm. The drug-loading content (%) was calculated as eqn (1):| |
 | (1) |
In vitro drug release studies of FA-QDs-FUA
The in vitro drug release experiment was carried out using a simple dialysis membrane method. Briefly, 3 mL of FA-QDs-FUA was dialyzed against a 20 mM Tris buffer with pH 5.0, pH 6.8 and pH 7.4 and transferred into a dialysis bag (MWCO, 8000–14000, Millipore, Boston, USA) at 37 °C under agitation using water bath, respectively. At the predetermined time interval (0.5, 1, 2, 4, 6, 8, 12, 24 h and thereby after every 24 h up to 144 h), about 3 mL releasing medium was collected and the amount of 5-FU in the releasing medium was determined spectrophotometrically by absorbance measurement at 273 nm. From the standard calibration curve obtained for 5-FU, the cumulative amount of 5-FU that got released from the FA-QDs-FUA composite was calculated using the eqn (2).35 At each subsequent time interval, an equivalent amount of the sample medium was replaced with fresh varying pH Tris solution so as to maintain the total volume to be same for all the measurements.| |
 | (2) |
where V0 is the volume of Tris medium at the time t, V is the volume of sampling Tris medium taken out at each interval, Ct is the concentration of 5-FU in Tris medium at time t, C is the concentration of 5-FU in the sampling Tris solution, W is the amount of FA-QDs-FUA, X is the drug loading of FA-QDs-FUA system.
Hemolysis toxicity test of FA-QDs-FUA
To investigate the hemolytic toxicity of FA-QDs-FUA, six New Zealand white rabbits (half male and half female) were randomly selected. Five milliliter blood was drawn from their auricular vein and 0.2 mL anticoagulant was then added. The mixture was washed in PBS followed by centrifuge (800 rpm) to concentrate the red blood cells. This process was repeated several times until the supernatant was no longer red. A 2% red blood cell suspension was prepared by PBS dilution. All samples were stored at 4 °C until analysis. 0.5 mL FA-QDs-FUA and free 5-FU at different concentrations were mixed with 0.5 mL of the red blood cell suspension, respectively. The mixtures were incubated at 37 °C in a water bath for 3 h and centrifuged at 3000 rpm for 10 min. Afterwards, 100 mL of the supernatant of each sample was loaded into a 96-well plate. Optical density was measured by the absorbance at 540 nm on a microplate reader (Labsystems Multiskan, Bio-chromatic Labsystem, Osaka, Japan). Isotonic PBS solution and distilled water were used as negative and positive controls, respectively. The hemolysis ratio of red blood cells was calculated with the following equation:| |
 | (3) |
In vitro cell viability and proliferation assay
It is well known that QDs have a certain extent of toxicity to cells. Low cytotoxicity and high transfection efficiency are the crucial needs of an efficient drug carrier. In vitro cytotoxicity of the PEG-QDs and FA-PEG-QDs nanoparticles in the normal hepatocyte line L02 was examined by MTT assay. The antiproliferative activity of conjugates FA-QDs-FUA was also tested in three different cell lines (L02, HepG2 and SMMC-7721) in vitro and compared with the activity of free 5-FU. This three cells (2 × 10⁵ cells per mL) were cultured in DMEM supplemented with 10% FBS at 37 °C and 5.0% CO2 in 96-well plates. After an incubation of 24 h, the cells were washed with sterilized PBS (pH 7.4, thrice) and then incubated with 100 μL of fresh DMEM or medium containing PEG-QDs or FA-PEG-QDs (1, 10, 20, 40, 80, 160 or 320 nM), FA-QDs-FUA and free 5-FU (0.48, 0.96, 1.92, 3.84, or 7.69 mM) for 24 h, 48 h and 72 h, respectively. Subsequently, 20 μL MTT solutions (5 mg mL−1) was added to each well and cultured for 4 h at 37 °C. Then the supernatant was removed and replaced with 150 μL of DMSO for 15 min until crystals were dissolved. MTT quantification was measured at 540 nm using a Synergy HT Multi Mode microplate reader (Biotek Instruments Ltd, USA). The percentage cell viability was then calculated with respect to the control and the values were taken as mean ± SD of three replicate experiments.
In vitro targeting specificity
In vitro targeting efficacy of FA-QDs-FUA was carried out fluorescent imaging using Olympus inverted fluorescent microscope and Image J image analysis software to calculate fluorescence intensity. The cells were plated on 6-well culture plates at a density of 2 × 10⁵ cells per mL for live cell imaging. After 24 h of incubation at 37 °C and 5.0% CO2, the cells were washed with PBS and fresh serum-free media containing FA-PEG-QDs at 40 nM. The nanoparticle was incubated with the cells for 2 h. After that, the cells were fixed by 4% paraformaldehyde for 15 minutes. Then, the nuclei were stained with 4′,6-diamidino-2-phenylindole (DAPI) for 5 min. The samples were viewed with a 20× objective lens and 10× ocular lenses and the exposure times for each filter were kept constant for each image series.
In vivo toxicity test of FA-QDs-FUA in healthy rats
For toxicity evaluation of FA-QDs-FUA on the liver, kidney and heart of healthy mice, 24 male SD rats weighing 180–200 g were distributed randomly into 3 groups of 8 rats each and were injected with the respective samples via intra peritoneal (i.p.) route for 4 consecutive days based on the following groupings: Group 1, control group (normal saline of 10 mL kg−1 body weight); Group 2, free 5-FU (9.6 mg kg−1); Group 3, FA-QDs-FUA (26 mg kg−1 body weigh, equivalent to 9.6 mg kg−1 of 5-FU), respectively. On the day after the last treatment, the blood of each rat was collected by cardiac puncture into a coagulation-promoting tube. And then, the blood was centrifuged at 4000 rpm for 10 min to obtain plasma for serum biochemistry profiling. The serum was then analysed for aspartate aminotransferase(AST), alanine aminotransferase (ALT), and blood urea nitrogen (BUN), creatinine (Cr), creatine kinase (CK), creatine kinase-MB (CK-MB) and lactate dehydrogenase (LDH) by using automatic analyzer 7600 series(Hitachi, Japan).
In vivo antineoplastic efficacy and toxicity study in tumor-bearing mice
To further corroborate the antineoplastic efficacy of FA-QDs-FUA in vivo, we selected Balb/c Nod/Scid mice half males and half females imprinting control region mice (aged 5–6 weeks, weighing 18–20 g) to test. All animals were kept in a pathogen-free environment and fed ad lib. The procedures for care and use of animals were approved by the Ethics Committee of the University of South China (Hengyang, China) and all applicable institutional and governmental regulations concerning the ethical use of animals were followed.
To develop tumor-bearing mice model, SMMC-7721 cells (1.0 × 10⁷ cells per 100 μL) were injected subcutaneously into the left flank of athymic nude mice. When the tumor size reached to 50 mm3, tumor-bearing mice were randomly divided into 5 groups and 6 mice per group were used. All mice were injected with the respective samples via tail vein injection. The groups were as following: Group 1 mice were administered normal saline (10 mL kg−1) and were used as controls; Groups 2 mice were injected with free 5-FU (4.8 mg kg−1), while Group 3–5 mice were injected with FA-QDs-FUA (high dose group, 12.8 mg kg−1, equivalent to 4.72 mg kg−1 of 5-FU; middle dose group, 6.4 mg kg−1, equivalent to 2.36 mg kg−1 of 5-FU; low dose group, 3.2 mg kg−1, equivalent to 1.18 mg kg−1 of 5-FU). The injection was carried out 4 times per week for 3 consecutive weeks. Tumor size was measured using electronic caliper every other day and tumor volume (V) was calculated using following formula: π × (long diameter) × (short diameter2)/6.32 The body weight of each mouse in various treatment groups was recorded.
To further evaluate the in vivo anticancer activity and toxicity of FA-QDs-FUA, the tumor, liver and kidney from each group mice (normal saline group, free 5-FU and high dose FA-QDs-FUA group) were collected for cytological and histopathological analysis after treatment. In brief, the excised tumor, liver and kidney samples randomly were rinsed several times in ice-cold normal saline, then fixed in 4% paraformaldehyde and embedded in paraffin. Paraffin embedded specimen were cut into 5 mm sections and stained with haematoxylin/eosin (H&E). All H&E stained tissue slices were taken photos using Olympus inverted microscope.
In vivo biodistribution assays
The quantitative information of the drug or drug carrier which accumulated in the tumor and the animal is pivotal for evaluation on the antitumor efficacy of the drug delivery system. In order to evaluate quantitatively the tissue distribution of the FA-QDs-FUA in vivo, the graphite furnace atomic absorption spectroscopy (GFAAS) equipped with a 228.8 nm cadmium(Cd) hollow cathode lamp (A3, Puxi, Beijing, China) was used to determine the content of Cd derived from drug carriers (ZnCdSe/ZnS QDs) which accumulated in the tumor and the organs of the tumor-bearing mice. The reference conditions for the atomic absorption spectrophotometer as these: wavelength was 228.8 nm, drying temperature was 105 °C, ashing temperature was 500 °C, ashing time was 30 s, and atomization temperature was 1900 °C. A series of standard solutions containing 0 ng mL−1, 0.50 ng mL−1, 1.0 ng mL−1, 1.5 ng mL−1, 2.0 ng mL−1, and 3.0 ng mL−1 Cd2+ was prepared with nitric acid solution (1%).
The tumor-bearing mice were sacrificed after they were injected with saline (10 mL kg−1) or FA-QDs-FUA (12.8 mg kg−1) 4 times per week for 3 consecutive weeks. And the tumor, hearts, livers, and kidneys of the tumor-bearing mice were subsequently dissected. The dissected tissue samples of 500 mg each were accurately weighed in the digestion container, followed by the addition of 5 mL nitric acid–perchloric acid mixed solution (the ratio was 9:1) and several glass beads. The samples were digested on an electric plate until the digested solution is colorless and transparent or slightly yellow. After cooling, the digested solution was transferred into a 10 mL volumetric flask and adjusted to 10 mL with 1% nitric acid solution. The samples were filtered through a 0.45 μm membrane filter before detection by GFAAS.
Statistical analysis
All the values are expressed as mean value ± SD of at least three independent experiments. Statistical analysis was performed using the one-way ANOVA with Dunnet's test, Bonferroni t test, and Student's t-tests. P < 0.05 was the criterion for statistical significance (* for p < 0.05, ** for p < 0.01, *** for p < 0.001).
Results and discussion
Preparation of FA-QDs-FUA system
The fabrication of the FA-QDs-FUA for targeting delivery therapeutic drugs into tumor cell was carried out using an amine coupling method through EDC/NHS, as is shown in Scheme 1. It is important to note that the addition of EDC and NHS to folic acid forms a highly reactive intermediate (FA-NHS), which can subsequently react with the free amino group present in PEG-QDs to form the resulting FA-PEG-QDs. In the design, water-dispersed QDs were selected as substrates for FUA conjugation. Folic acid is essential for cell growth, proliferation, and survival,36 and sufficient folic acid can also promote tumor cell growth. Herein, the content of folic acid in the drug delivery system is controlled within 10% in present study, which the 10% or less folic acid in drug delivery systems can target delivery drugs into tumor sites.36 The synthesis conditions of the FA-QDs-FUA system were systematically optimized and the reaction time of 2 h, the reaction temperature of 37 °C and the optimal proportion of FA:PEG-QDs:FUA = 10:1:100 was ultimately determined.
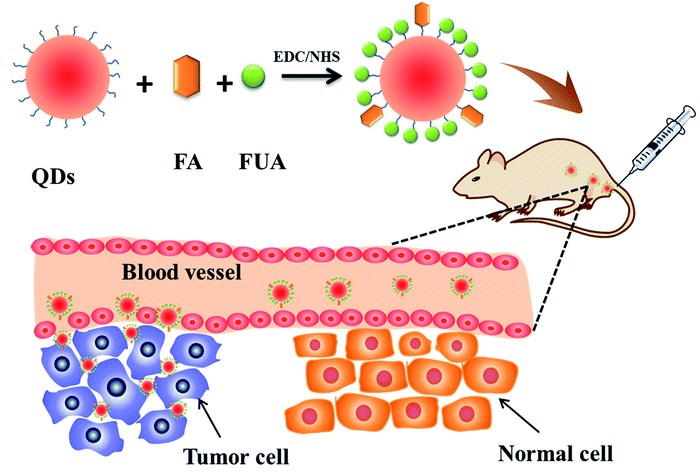 |
| | Scheme 1 Schematic diagram of designing FA-conjugated QDs-FUA nanoparticles, targeting toward tumor. | |
Characterization of the FA-QDs-FUA
The optical properties, morphology, average size and drug loading content of as-synthesized FA-QDs-FUA composite have been characterized carefully in this paper. As shown in Fig. 1A, the absorption peak (281 nm) of the FA-QDs-FUA suspensions show a slight red shift compared with that of the FUA (273 nm), which could be attributable to their different particle sizes. The fluorescence properties of FA-QDs-FUA (Fig. 1B) did not show significant changes compared with free PEG-QDs, demonstrating that the conjugation process did not change the fluorescence characteristics of the QDs. The FTIR spectra of FA, FUA and FA-QDs-FUA were depicted in Fig. 1C. FA exhibited absorption bands at 3324 cm−1 (–COOH stretch) and 1603 cm−1 (–NH2 stretch). FUA exhibited absorption bands at 3124 cm−1 (–COOH stretch) and 987 cm−1 (–CF![[double bond, length as m-dash]](https://www.rsc.org/images/entities/char_e001.gif) CH– stretch). Compared to FA and FUA, the peaks of amides I and II for FA-QDs-FUA were different, being slightly shifted to 1643 cm−1 and 1408 cm−1, respectively. This proved that FA was successfully coupled to the PEG-QDs through chemical bonds. The peak at 3349 cm−1 for FA-QDs-FUA noted that the stretching vibration of N–H. The characteristic absorption band of FA-QDs-FUA was present at 987 cm−1 (–CFCH– stretch) in the spectrum; this proved that FUA was coupled to the FA-PEG-QDs through chemical bonds.
CH– stretch). Compared to FA and FUA, the peaks of amides I and II for FA-QDs-FUA were different, being slightly shifted to 1643 cm−1 and 1408 cm−1, respectively. This proved that FA was successfully coupled to the PEG-QDs through chemical bonds. The peak at 3349 cm−1 for FA-QDs-FUA noted that the stretching vibration of N–H. The characteristic absorption band of FA-QDs-FUA was present at 987 cm−1 (–CFCH– stretch) in the spectrum; this proved that FUA was coupled to the FA-PEG-QDs through chemical bonds.
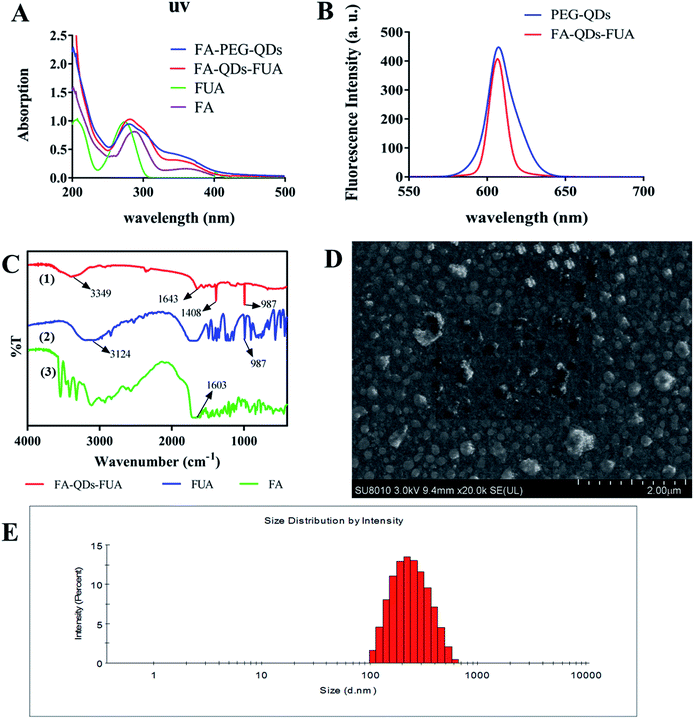 |
| | Fig. 1 The characterization of FA-QDs-FUA. (A) The ultraviolet absorption spectrum of FA-QDs-FUA; (B) the fluorescence spectrum of FA-QDs-FUA; (C) the FTIR of FA-QDs-FUA, FA and FUA; (D) the SEM image of FA-QDs-FUA; (E) the particle size of FA-QDs-FUA. | |
Fig. 1D showed that the prepared FA-QDs-FUA was almost homogeneously spherical-shaped and the diameter of the particles was about 200 nm, which was consistent with the diameters measured by zeta sizer nanoparticle analyzer. Fig. 1E showed the size distribution of the system dispersed in water at room temperature. The finally prepared FA-QDs-FUA displayed a good distribution, and the average particle size was about 220.28 nm with PDI of 0.49 ± 0.008. Drug-loading content of FA-QDs-FUA, by ultraviolet analyses, was found to be 36.85% ± 1.61% (n = 3).
Drug release studies of FA-QDs-FUA
The selected pH values of the release media mimics microenvironment under normal physiological conditions (pH 7.4) or in the endo/lysosomes (pH 4.5–5.5). The measure wavelength of FUA released from the FA-QDs-FUA was selected at 273 nm. The linear standard curve of FUA was determined to be y = 0.0547x − 0.0005 (R2 = 0.9996), where x is the concentration and y is the absorbance. As shown in Fig. 2, the initial burst releases of FUA were clearly observed at three different pH values. Cumulative FUA release increased to 52% within 8 h when tested in the pH of 5.0, 6.8 and 7.4 and incubation temperature of 37 °C. A sustained slow release was recorded between 8 and 72 h, with a cumulative release percentage of 52.94–70.63%. This indicated that the FA-QDs-FUA had a prolonged release for 8–72 h. After 72 h, the release reached a plateau, with a cumulative release percentage of >80% at 144 h. As depicted in the release profile, a biphasic drug release pattern with an initial burst release and followed by sustained release were presumably attributed to the system matrix imparting a barrier to drug release. Compared with pH 5.0, the drug release was considerably faster at pH 7.4, which indicates a good stability of FA-QDs-FUA under acidic conditions. The acidic intracellular environment of most cancer cells will facilitate the sustained and slow release of FA-QDs-FUA.
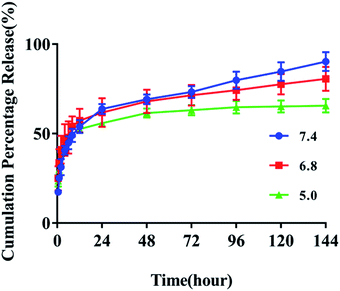 |
| | Fig. 2 In vitro drug releases behaviour of FA-QDs-FUA at different pH (7.4, 6.8 and 5.0) values (n = 3). | |
Hemolytic toxicity test of FA-QDs-FUA
Interaction of system with erythrocytes can lead to adverse reactions and percentage of hemolysis from 1 to 25% is accepted as “no concern” in vitro.37 As depicted in Fig. 3, the percent hemolysis ratio increased with increasing concentration and was below 7% even at the high concentration (1000 μg mL−1) of FA-QDs-FUA system, which showed very little hemolysis and were considered safe for intravenous administration.
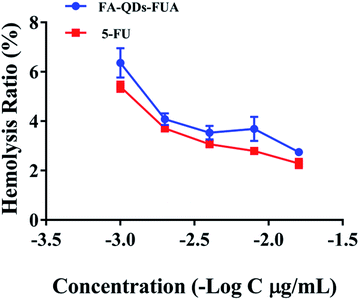 |
| | Fig. 3 In vitro percent hemolysis of FA-QDs-FUA and free 5-FU at different concentration. (n = 3). | |
In vitro cell viability and proliferation assay
MTT proliferation assay was carried out to assess the cytotoxicity of L02, HepG2 and SMMC-7721 cells following the treatment of PEG-QDs, FA-PEG-QDs, 5-FU (pure drug), FA-QDs-FUA. Fig. 4 demonstrated low concentrations (<40 nM) of PEG-QDs and FA-PEG-QDs did not produce noticeable reduction in cell viability during 24 h of incubation. In addition, the FA-PEG-QDs produced lower cytotoxicity compared with free ZnCdSe/ZnS QDs at the same concentration. Folic acid is essential for the biosynthesis of nucleotide bases and it is consumed in elevated quantities by proliferating cells.38 We speculate that the reason FA-PEG-QDs were less cytotoxic compared to ZnCdSe/ZnS QDs is that FA can promote cell growth and FA bound to the surface of the ZnCdSe/ZnS QDs, which can also reduce the leakage of Cd. Herein, the optimal concentration of 40 nM for PEG-QDs was chosen in the subsequent experiment.
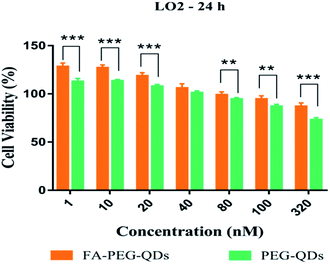 |
| | Fig. 4 In vitro cell viability studies (MTT assay) following the treatment of PEG-QDs and FA-PEG-QDs on L02 cells. All the results presented are the mean ± SD (n = 3) of three replicate analysis. *** corresponds to highly significant (p < 0.001), ** for significant (p < 0.01) values. | |
As shown in Fig. 5, the cell viability percent of FA-QDs-FUA on the three liver cells (L02, HepG2, SMMC-7721) were greater than that of free 5-FU on the three cells. The results showed that the FA-QDs-FUA produced lower cytotoxicity compared with the free 5-FU of the three liver cells. However, the cell viability percent of free 5-FU and FA-QDs-FUA reduced gradually and the difference in the cell viability between free 5-FU and FA-QDs-FUA became smaller and smaller as the spiked free 5-FU and FA-QDs-FUA concentration and incubation time increased. As shown in Table 1, the cell viability percent of the L02 cells were greater than that of the SMMC-7721 and HepG2 incubated with 100 μL medium containing 3.84 mM FA-QDs-FUA. And the significant difference (p < 0.05) in cell viability was observed between the L02 cells and SMMC-7721 cells incubated with the same concentration FA-QDs-FUA. Based on the above experimental results, we can conclude that there was a difference in viability between non-cancerous L02 cells and the hepatocarcinoma-derived cells (HepG2 and SMMC-7721).
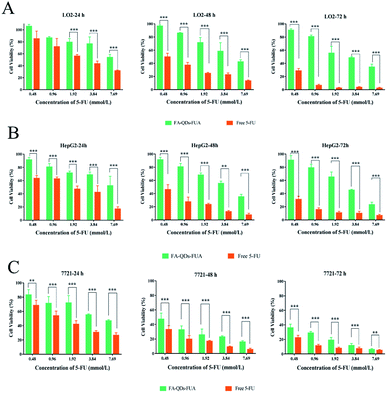 |
| | Fig. 5 In vitro cytotoxicity studies (MTT assay) following the treatment of FA-QDs-FUA and free 5-FU to L02 (A), HepG2 (B), and SMMC-7721 (C) cells for 24 h, 48 h and 72 h. All the results presented are the mean ± SD of three replicate analyses. *** corresponds to highly significant (p < 0.001), ** for significant (p < 0.01) values. | |
Table 1 Cell viability rate (%) of L02, HepG2 and SMMC-7721 incubated with 100 μL medium containing FA-QDs-FUAa (3.84 mmol L−1)
| Group |
24 h |
48 h |
72 h |
| Data are expressed as mean ± SD, n = 3. *P < 0.05 vs. HepG2 cells, #P < 0.05 vs. L02 cells. |
| SMMC-7721 |
55.014 ± 1.51# |
22.668 ± 1.662*# |
11.517 ± 2.841*# |
| HepG2 |
68.689 ± 4.247 |
55.356 ± 3.643 |
45.112 ± 1.365 |
| L02 |
76.540 ± 11.724 |
58.239 ± 13.17 |
48.480 ± 8.592 |
In vitro targeting specificity
FA-PEG-QDs were used to investigate the targeting specificity in L02, HepG2, and SMMC-7721 cells for 2 h at 37 °C. As shown in Fig. 6A, the strongest red fluorescent signals derived from QDs were observed on SMMC-7721 cells and there was no red fluorescent signal on normal liver cells (L02) under the same experimental conditions. Furthermore, it can be observed from Fig. 6B that the fluorescence intensity in the SMMC-7721 cells (155.66 ± 7.06) and HepG2 cells (41.58 ± 3.19) was higher than that of L02 cells (0.001 ± 0.0) incubated with FA-PEG-QDs for 2 h and there was a highly significant difference (p < 0.001) in fluorescence intensity between L02 cells and the hepatocarcinoma cells (HepG2 and SMMC-7721), confirming that FA-PEG-QDs can target more easily cancer cells than normal cells. This could be attributed to the difference in expression levels of FR between cancer cell and normal cell, which was consistent with the results that SMMC-7721 cell has shown a remarkable affinity toward FA-modified nanoscale vectors as reported in the literature.17 The results further indicated that the FA-PEG-QDs could be used as effective carriers targeted liver cancer cells.
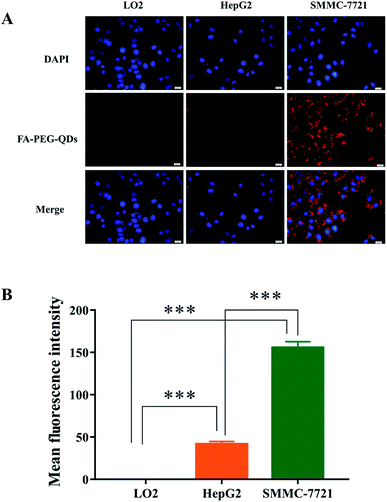 |
| | Fig. 6 (A) In vitro fluorescence microscopy images and (B) quantification of L02, HepG2, and SMMC-7721 cells after incubation with FA-PEG-QDs for 2 h. Original magnifications are 200×. The scale bar represents 20 μm. *** corresponds to highly significant (p < 0.001). | |
In vivo toxicity test of FA-QDs-FUA in healthy rats
In general, the levels of ALT, AST and AST/ALT enzyme activity are widely used as indicators for monitoring the hepatocellular related injury or necrosis.39 As is well-known, the values (BUN and Cr) are related to kidney, and the parameters (CK-MB, CK and LDH) are connected with heart. Hence, we measured the levels of ALT, AST, BUN, Cr, CK-MB, CK and LDH following the treatment of 5-FU and FA-QDs-FUA. As shown in Fig. 7, the parameters of the SD rat treated with the free 5-FU drug were observed with a slight elevation of AST (mean value 149.07 ± 2.64, U L−1), BUN (mean value 9.03 ± 0.49, mM), CK (mean value 3012.67 ± 238.39, U L−1) and LDH values (2109.33 ± 201.68) in plasma as compared to the normal control groups, which is indicative of early signs of liver, kidney and heart damage. And the parameters of SD rat treated with the FA-QDs-FUA groups including the AST (mean value 138.03 ± 35.71, U L−1), BUN (mean value 6.60 ± 0.0.49, mM), CK (mean value 1881.33 ± 849.25, U L−1) and LDH (1754.33 ± 521.81) was lower than free 5-FU groups. This result indicates that FA-QDs-FUA was able to reduce the possible toxicity associated with the free 5-FU towards the kidney.
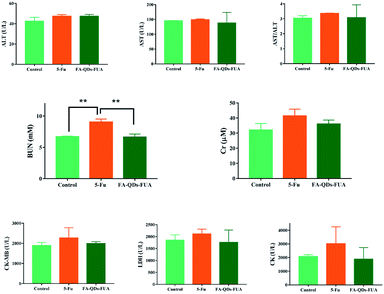 |
| | Fig. 7 Evaluation of ALT, AST, BUN, Cr, LDH, CK and CK-MB plasma levels after all the treatments of saline, free 5-FU, and FA-QDs-FUA. (n = 8) ** for significant (p < 0.01) values. | |
In vivo antineoplastic efficacy and toxicity study in tumor-bearing mice
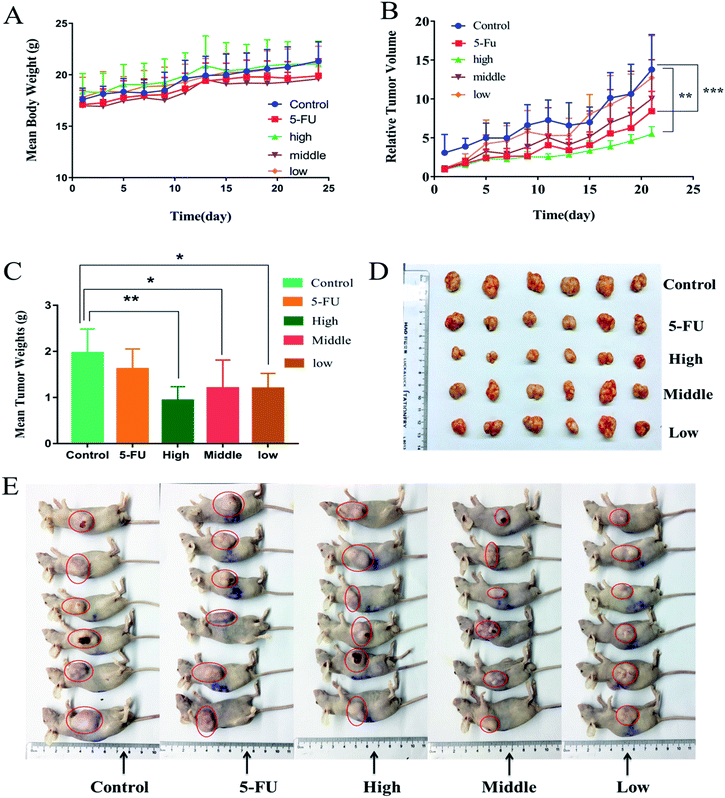
Fig. 8(A–E) vividly demonstrated the comparative effects of FA-QDs-FUA versus free 5-FU drugs and its impact in the tumor-bearing mice body weight, tumor volume and weight respectively. As shown in Fig. 8A, all mice showed increment in body weight throughout the study period. And the groups treated with the free 5-FU and different dose FA-QDs-FUA conjugate were able to regulate/maintain the body weight close to the values observed on the control groups. As depicted in the Fig. 8B, the untreated groups, and the groups treated with free 5-FU and three different doses of FA-QDs-FUA showed a progressive increase in the tumor volume. But, the groups treated with the high-dose FA-QDs-FUA showed a significant (p < 0.01) reduction in the tumor volume when compared against the control groups. The gross tumors after harvesting the tumor from the mice at the endpoint (day 23) are depicted in Fig. 7C. The tumor weight treated with the free 5-FU groups decreased to about 1.515 g when compared against 1.963 g recorded for the control groups. However, the groups treated with FA-QDs-FUA in different doses (high, middle and low groups) showed a superior tumor reduction of about 1.073 g, 1.202 g and 1.210 g, respectively. From the results, the relative reduction in the tumor weight of three different doses of FA-QDs-FUA treated groups compared to the groups injected with the free 5-FU could be ascribed to the FA-FRs mediation, localizing the 5-FU conjugate through cellular uptake largely towards the FRs expressing liver cancer cells. These results further demonstrated that the drug delivery vehicles FA-QDs-FUA increases the drug bioavailability and retention time and also supports the targeting efficiency when compared to the pure/conventional drug administration.
 |
| | Fig. 8 Tumor growth inhibition after intravenous injection of FA-QDs-FUA and free 5-FU in tumor-bearing mice. Data are shown as the mean ± standard deviation (n = 8).*p < 0.05, **p < 0.01, statistically significant compared with normal saline control. | |
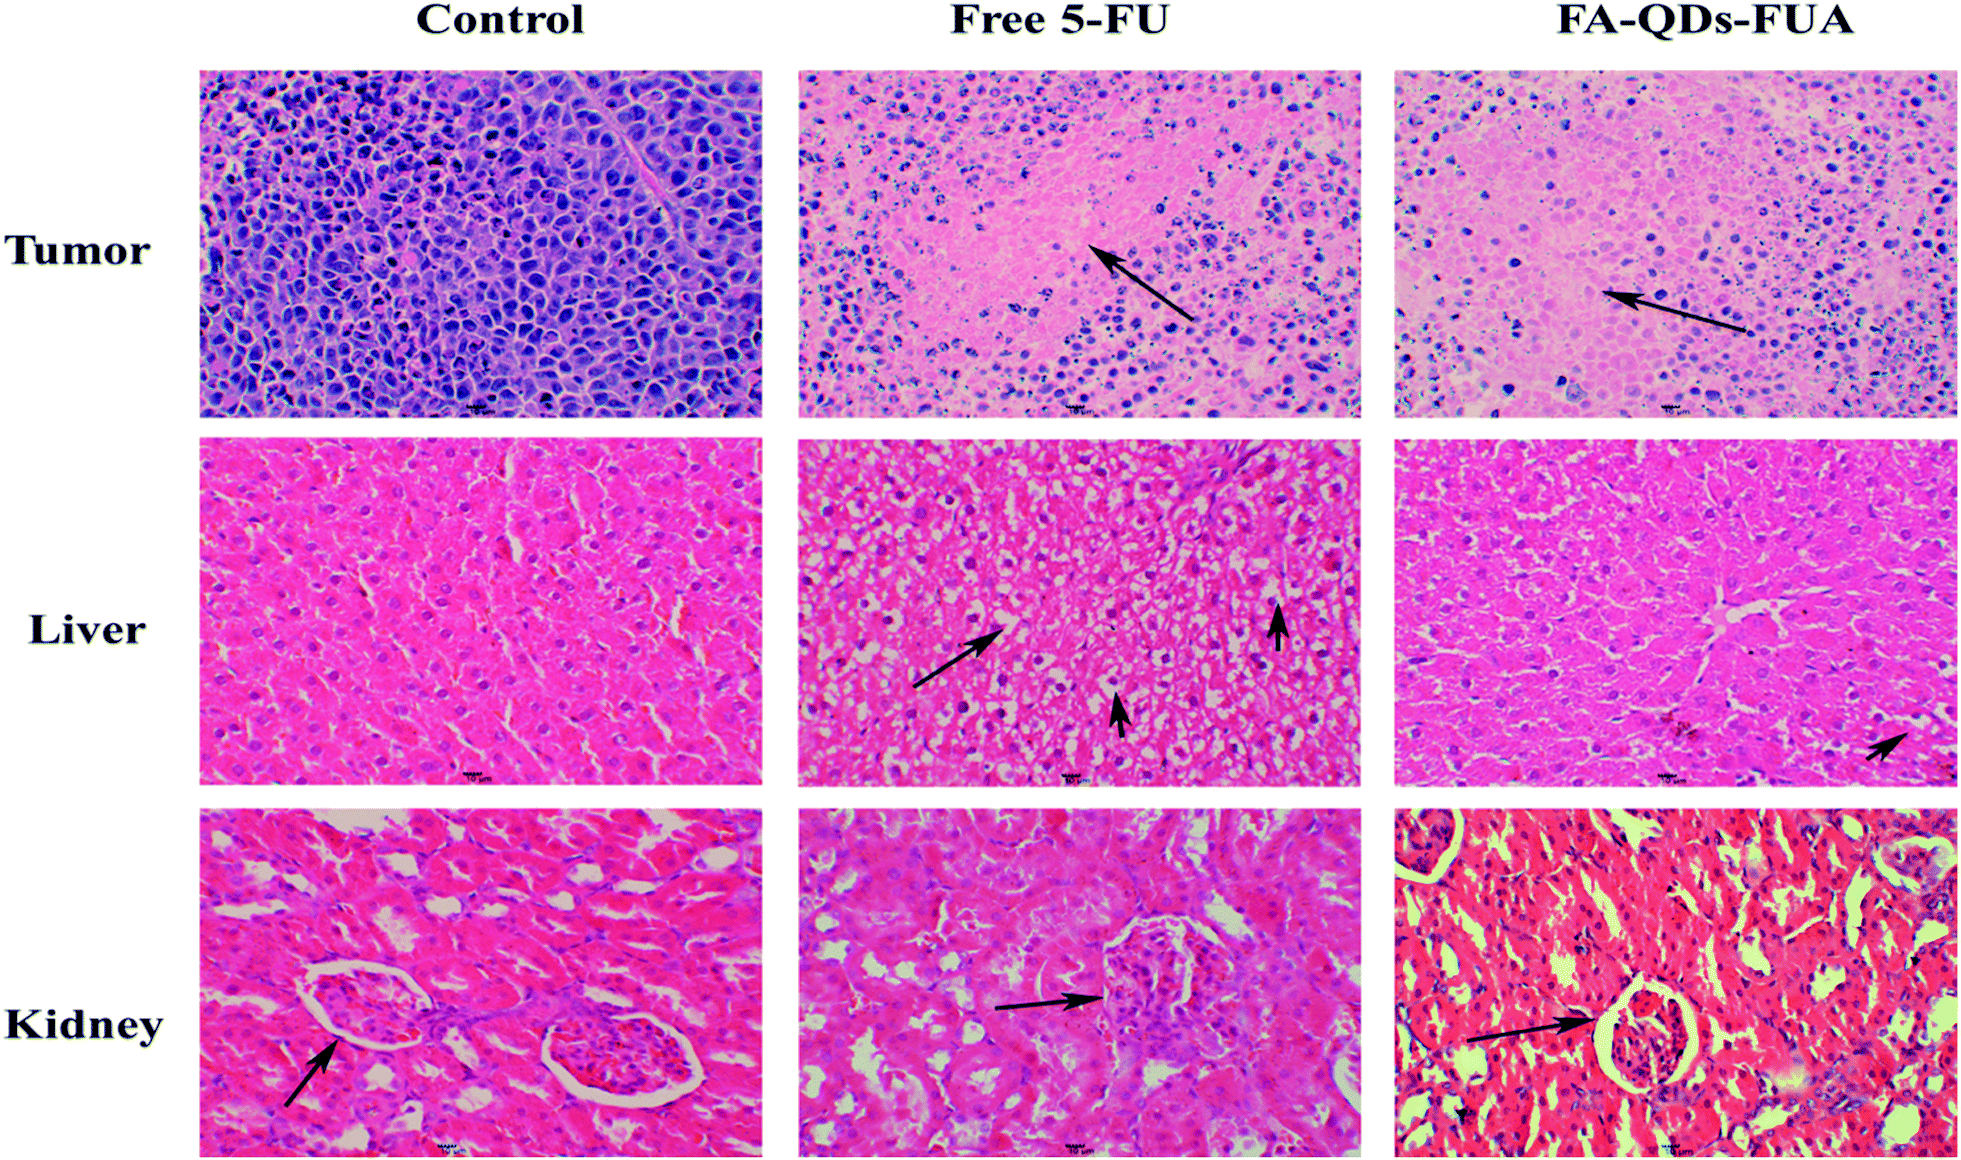
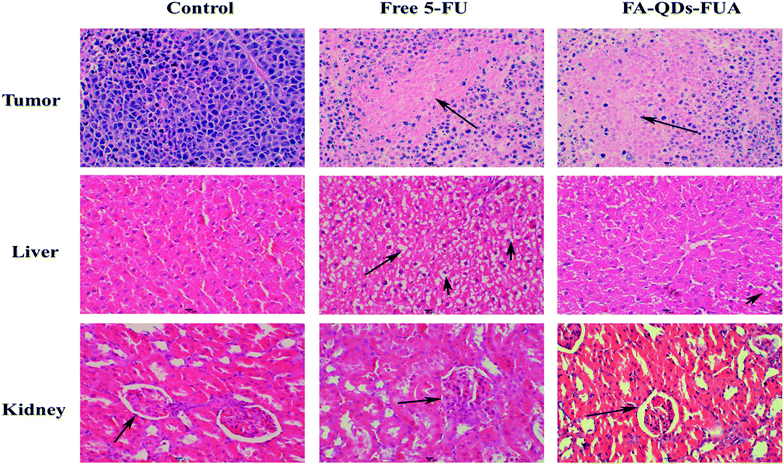
The excised tumor, liver and kidney from the mice randomly selected from each experimental group at the endpoint (day 23) stained by H&E were shown in Fig. 9. As depicted in the Fig. 9, the tumor treated with normal saline (control groups) showed large number of live cancer cells with low differentiated with high nuclear-cytoplasmic ratio, which implies escalation in the growth of tumor cells. And tumor treated with 5-FU and FA-QDs-FUA have caused noticeable significant morphological changes compared to the saline group. And a remarkable rise in necrotic area of tumor in the mice that were injected with FA-QDs-FUA compared to free 5-FU groups indicated better interstitial diffusion within the tumor confirming its superior efficacy. The liver treated with normal saline showed hepatocytes were closely packed. And treatments with FA-QDs-FUA for 23 days have not caused any significant morphological changes in liver compared to the saline group. However treatments with the free 5-FU group showed a lot of lipid droplets, indicating that the liver has lipid-like lesions (as indicated by the arrow). The kidney treated with normal saline showed the glomerular cavities in the kidney were prominent and the glomerular cyst was visible in the FA-QDs-FUA group and was not significantly different from that in the control group (as indicated by the arrow). However, the free 5-FU group showed that glomerular adhesions (as indicated by the arrow). This showed that the FA-QDs-FUA has less damage in the kidney than the free 5-FU group.
 |
| | Fig. 9 H&E analyses of tumor, liver and kidney of nude mice bearing SMMC-7721 cell xenograft after treatments with saline, free 5-FU and FA-QDs-FUA for 24 days. Original magnifications are 400×. The scale bar represents 10 μm. | |
In vivo distribution assays
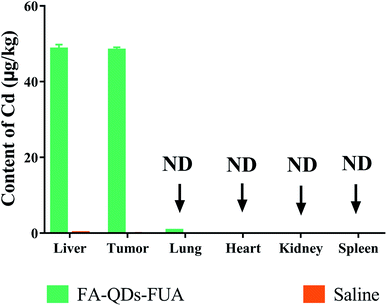
The regression equation of Cd was A = 0.0172 × C + 0.0561 (R2 = 0.996) with calculated detection limit of 0.16 ng mL−1. The content of Cd derived from QDs which accumulated in various tissues after tail vein injection saline or FA-QDs-FUA is presented in Fig. 10. The highest Cd content was found in the liver and it was 48.55 ± 1.23 μg kg−1. The second highest Cd content was accumulated in the tumor and it was 48.26 ± 0.82 μg kg−1. The value in lung was 0.66 ± 0.04 μg kg−1. Cd was even not detected in heart, spleen and kidney, indicating that Cd has no accumulation in heart, spleen and kidney and it did not damage these organs of mice in the treatment duration. The experimental results suggested that the FA-QDs-FUA system has accumulated mainly in the liver and tumor and it was good for targeted therapy of liver cancer. This could be attributed to two main possible reasons. One possible explanation is that there are highly expressed FRs on the surface of liver cancer cells which provides unique opportunity to specifically target liver cancer cells by virtue of the high affinity of FRs for FA-QDs-FUA system. The other is that most administered nanoparticles will accumulate and sequester in the liver after administration into the body.40
 |
| | Fig. 10 The content of Cd derived from the drug carrier(ZnCdSe/ZnS QDs) which accumulated in the liver, tumor, lung, heart, kidney and spleen after tail vein i.v. injection with saline or FA-QDs-FUA (ND-not detected). | |
Conclusion
In this study, we prepared 5-FU-loaded FA-PEG-QDs based system for theranostics applications of liver cancer cell diagnosis and treatment by following a simple wet chemistry method. FA-PEG-QDs system exhibited a satisfactory loading capacity. In comparison to free 5-FU, the FA-PEG-QDs showed a lower cytotoxicity in L02 cells in vitro following MTT assay. FA-PEG-QDs not only targeted more easily hepatocellular carcinoma (SMMC-7721 and HepG2) cells than normal cells in vitro but also have accumulated mainly in the liver and tumor in vivo. In conclusion, the formed FA-PEG-QDs in comparison to the free 5-FU drug were observed to exert reduced toxic side effects and better anti-tumor efficacy. From the outcome of this study, we expect that the targeted drug delivery using functionalized folate-decorated QDs system could support targeted delivery of therapeutics agents in hepatocellular carcinoma therapy.
Conflicts of interest
There are no conflicts to declare.
Acknowledgements
The authors gratefully acknowledged financial supports from Innovation platform Open Foundation of education department of Hunan province (contract grant number 16K079, 17K082), Hunan Provincial Innovation Foundation For Postgraduate (contract grant number CX2016B472) and the Natural Science Foundation of Hunan province (contract grant number 16JJ66126).
References
- D. Galun, T. Srdic-Rajic, A. Bogdanovic, Z. Loncar and M. Zuvela, Hepatocell. Carcinoma, 2017, 4, 93 CrossRef PubMed.
- S. Lin, K. Hoffmann and P. Schemmer, Liver Cancer, 2012, 1, 144 CrossRef PubMed.
- J. Trojan, S. Zangos and A. A. Schnitzbauer, Visc Med., 2016, 32, 116 CrossRef PubMed.
- B. Wilson, T. V. Ambika, R. D. Patel, J. L. Jenita and S. R. Priyadarshini, Int. J. Biol. Macromol., 2012, 51, 874 CrossRef PubMed.
- M. Cheng, B. He, T. Wan, W. Zhu, J. Han, B. Zha, H. Chen, F. Yang, Q. Li, W. Wang, H. Xu and T. Ye, PLoS One, 2012, 7, e47115 Search PubMed.
- I. B. Bwatanglang, F. Mohammad, N. A. Yusof, J. Abdullah, N. B. Alitheen, M. Z. Hussein, N. Abu, N. E. Mohammed, N. Nordin, N. R. Zamberi and S. K. Yeap, J. Colloid Interface Sci., 2016, 480, 146 CrossRef PubMed.
- Y. Wettergren, G. Carlsson, E. Odin and B. Gustavsson, Cancer, 2012, 118, 2935 CrossRef PubMed.
- T. Kang, F. Li, S. Baik, W. Shao, D. Ling and T. Hyeon, Biomaterials, 2017, 136, 98 CrossRef PubMed.
- E. Luque-Michel, E. Imbuluzqueta, V. Sebastián and M. J. Blanco-Prieto, Expert Opin. Drug Delivery, 2017, 14, 75 CrossRef PubMed.
- X. Zhou, M. Zhang, B. Yung, H. Li, C. Zhou, L. J. Lee and R. J. Lee, Int. J. Nanomed., 2012, 7, 5465 Search PubMed.
- D. Wang, S. Zhang, T. Zhang, G. Wan, B. Chen, Q. Xiong, J. Zhang, W. Zhang and Y. Wang, Int. J. Nanomed., 2017, 12, 8649 CrossRef PubMed.
- J. M. Shen, X. X. Li, L. L. Fan, X. Zhou, J. M. Han, M. K. Jia, L. F. Wu, X. X. Zhang and J. Chen, Int. J. Nanomed., 2017, 12, 1183 CrossRef PubMed.
- Y. Lv, J. Li, H. Chen, Y. Bai and L. Zhang, Int. J. Nanomed., 2017, 12, 4361 CrossRef PubMed.
- J. Fraczyk, M. Walczak, L. Szymanski, Z. Kolacinski, H. Wrzosek, I. Majsterek, K. Przybylowska-Sygut and Z. J. Kaminski, Nanomedicine, 2017, 12, 2161 CrossRef PubMed.
- M. P. Alvarez-Berríos and J. L. Vivero-Escoto, Int. J. Nanomed., 2016, 11, 6251 CrossRef PubMed.
- C. Marchetti, I. Palaia, M. Giorgini, C. De Medici, R. Iadarola, L. Vertechy, L. Domenici, D. V. Di, F. Tomao, L. Muzii and P. P. Benedetti, OncoTargets Ther., 2014, 7, 1223 CrossRef PubMed.
- Z. Ji, G. Lin, Q. Lu, L. Meng, X. Shen, L. Dong, C. Fu and X. Zhang, J. Colloid Interface Sci., 2012, 365, 143 CrossRef PubMed.
- R. K. Thapa, J. Y. Choi, B. K. Poudel, H. G. Choi, C. S. Yong and J. O. Kim, Int. J. Nanomed., 2016, 11, 2799 Search PubMed.
- H. Li, L. Piao, B. Yu, B. C. Yung, W. Zhang, P. G. Wang, J. L. Lee and R. J. Lee, Biomaterials, 2011, 32, 6614 CrossRef PubMed.
- X. Lei, K. Li, Y. Liu, Z. Y. Wang, B. J. Ruan, L. Wang, A. Xiang, D. Wu and Z. Lu, Int. J. Nanomed., 2017, 5701 CrossRef PubMed.
- C. Feng, T. Wang, R. Tang, J. Wang, H. Long, X. Gao and S. Tang, Pediatr. Surg. Int., 2010, 26, 1185 CrossRef PubMed.
- T. Santiago, R. S. DeVaux, K. Kurzatkowska, R. Espinal, J. I. Herschkowitz and M. Hepel, Int. J. Nanomed., 2017, 12, 7763 CrossRef PubMed.
- B. Lasa-Saracibar, A. de E. Mendoza, M. Guada, C. Dios-Vieitez and M. J. Blanco-Prieto, Expert Opin. Drug Delivery, 2012, 9, 1245 CrossRef PubMed.
- H. Yang, Nanomedicine, 2016, 12, 309 CrossRef PubMed.
- D. J. Lim, M. Sim, L. Oh, K. Lim and H. Park, Arch. Pharmacal Res., 2014, 37, 43 CrossRef PubMed.
- S. Huang, C. Li, W. Wang, H. Li, Z. Sun, C. Song, B. Li, S. Duan and Y. Hu, Int. J. Nanomed., 2017, 12, 5163 CrossRef PubMed.
- K. T. Yong, Y. Wang, I. Roy, H. Rui, M. T. Swihart, W. C. Law, S. K. Kwak, L. Ye, J. Liu, S. D. Mahajan and J. L. Reynolds, Theranostics, 2012, 2, 681 CrossRef PubMed.
- Y. G. Irina, S. S. Elena and V. G. Valentina, Trends Anal. Chem., 2015, 66, 53 CrossRef.
- D. X. He, D. X. Wang and X. X. Shi, RSC Adv., 2017, 7, 12374–12381 RSC.
- T. A. Kelf, V. K. Sreenivasan, J. Sun, E. J. Kim, E. M. Goldys and A. V. Zvyagin, Nanotechnology, 2010, 21, 285 CrossRef PubMed.
- H. He, M. Feng, J. Hu, C. Chen, J. Wang, X. Wang, H. Xu and J. R. Lu, ACS Appl. Mater. Interfaces, 2012, 4, 6362 Search PubMed.
- N. S. Rejinold, T. Baby, S. V. Nair and R. Jayakumar, J. Biomed. Nanotechnol., 2013, 9, 1657 CrossRef PubMed.
- I. B. Bwatanglang, F. Mohammad, N. A. Yusof, J. Abdullah, M. Z. Hussein, N. B. Alitheen and N. Abu, Int. J. Nanomed., 2016, 11, 413 Search PubMed.
- C. Y. Yu, N. M. Li and S. Yang, J. Polym. Sci., 2015, 42625 Search PubMed.
- X. M. Guo, B. Guo, Q. Zhang and X. Sun, Dalton Trans., 2011, 40, 3039 RSC.
- N. Gonen and Y. G. Assaraf, Drug Resist. Updates, 2012, 15, 183 CrossRef PubMed.
- E. Jin, B. Zhang, X. Sun, Z. Zhou, X. Ma, Q. Sun, J. Tang, Y. Shen, E. Van Kirk, W. J. Murdoch and M. Radosz, J. Am. Chem. Soc., 2013, 135, 933 CrossRef PubMed.
- Y. Lu and P. S. Low, Adv. Drug Delivery Rev., 2002, 54, 675 CrossRef PubMed.
- A. U. Kura, B. Saifullah, P. S. Cheah, M. Z. Hussein, N. Azmi and S. Fakurazi, Nanoscale Res. Lett., 2015, 10, 1 CrossRef PubMed.
- Y. N. Zhang, W. Poon, A. J. Tavares, I. D. McGilvray and W. C. W. Chan, J. Controlled Release, 2016, 240, 33 Search PubMed.
Footnote |
| † These authors contributed equally to this work. |
|
| This journal is © The Royal Society of Chemistry 2018 |
Click here to see how this site uses Cookies. View our privacy policy here. 
 Open Access Article
 This Open Access Article is licensed under a Creative Commons Attribution-Non Commercial 3.0 Unported Licence
 *ab,
Guotao Tang†
*ab,
Guotao Tang†