DOI:
10.1039/C8RA01001C
(Paper)
RSC Adv., 2018,
8, 12841-12847
TiN nanosheet arrays on Ti foils for high-performance supercapacitance†
Received
1st February 2018
, Accepted 13th March 2018
First published on 4th April 2018
Abstract
A simple template-free method of preparing mesoporous TiN nanostructures directly on Ti foils is developed by combining hydrothermal, ion exchange and nitridation reactions. The as-prepared TiN nanosheet arrays on Ti foils can be directly used as an electrode without any subsequent processing, and are found to be a good capacitance material. The specific capacitance of the TiN nanosheets electrode measured at the current density of 0.5 A g−1 reaches 81.63 F g−1, and the capacitance retention is still 75% after 4000 cycles. The symmetric supercapacitor made up of two TiN nanosheet electrodes sandwiching a solid electrolyte (polyvinyl alcohol in KOH) shows a specific capacitance of 0.42 F cm−3, and retains 77.6% of the capacitance even at the current density of 12.5 mA cm−3.
Introduction
Supercapacitors, namely, electrochemical capacitors, have several advantages over secondary batteries such as high power density and long cycle life.1,2 In addition, their ability for facile charging/discharging can meet the demand for increased power and energy needed for next generation lightweight electronics.3–5 A variety of materials have been employed for supercapacitors, for example, carbon-based materials such as carbon nanotubes and graphene,6–8 transition metal oxides such as MnO2, NiO and CoO,9–11 and conducting polymers.12,13 These materials have some deficiencies. For example, the carbon-based materials have relatively low specific capacitance and energy density, the transition metal oxide materials are poor electrical conductors, and the conducting polymer materials have low cycling stability.14 Considering these facts, other materials are necessary to be explored for high-performance supercapacitors.
Transition metal nitrides (VN, TiN, MoN etc.) are suitable supercapacitor materials, because they have good electrical conductivity and can adopt the morphology with high specific surface areas, and because they are chemically stable in electrolytes and are inexpensive.15–18 In particular, titanium nitride (TiN) is attractive because it is facile to be prepared, strongly resistant to chemicals and environmentally safe, and has a high rate of charging/discharging capability and a long recycling life.19–21 A good supercapacitor material should possess a high specific surface area and rapid charge separation, which is generally achieved by fabricating nanostructures. Up to now, various TiN nanostructures such as nanoparticles,22 nanorods,23 and nanofibers,24 etc., have been prepared by nitridating titanium dioxide (TiO2) at high temperature.25–28 However, the fabrication of TiN mesoporous nanostructures is still a challenging task, because the porous nanostructures of the TiO2 precursors can easily collapse during conversion and recrystallization at high temperature.29,30 Although, some mesoporous TiN nanostructures have been synthesized by template or template-free methods, these approaches usually require a complex and time-consuming process.30,31 Furthermore, most of the TiN nanostructures used as supercapacitor materials exist as powders.22–24,32 The working electrodes based on such materials are prepared by mixing the powder samples with a conducting material (e.g., carbon black) and an adhesive (e.g., polytetrafluoroethylene, PTFE) and then by pressing the mixture onto a metal substrate. As a result, part of the exposed surface of the TiN nanostructures could be blocked and the charge transfer could be hindered due to the presence of various interfaces and binders. Therefore, if a free-standing TiN material with well-maintained mesoporous nanostructures can be made, it would provide not only a network for rapid charge transfer, but also a larger surface area for surface reactions, which would be preferable for electrochemical storage applications.33,34
In this work, we developed a simple template-free method to prepare free-standing TiN nanosheet arrays with mesoporous nanostructure on the Ti foil by combining hydrothermal, ion exchange and nitridation reactions. The as-prepared TiN nanosheet arrays on Ti foils can not only be used directly as an electrode, but also possess a high specific surface areas and intimate contact between TiN and Ti foil, which are beneficial for the diffusion of electrolyte and the charge transfer in the electrode.35 As a result, the TiN nanosheet electrode exhibits good specific capacitance and cycling stability. And this synthetic strategy could be extended to prepare other nanosheet-like metal nitrides for high performance supercapacitors.
Experimental
Preparation of TiN nanosheet arrays
A Ti foil (1 cm × 1 cm) was pre-cleaned with acetone, diluted hydrochloric acid and ethanol, and then dried at room temperature. A hydrothermal method was employed to grow a Na2Ti2O4(OH)2 film on the Ti foil.36 The clean Ti foil was immersed into 3 M NaOH aqueous solution (30 mL) and then transferred into a Teflon-lined stainless-steel autoclave (45 mL volume). The sealed autoclave was heated at three different temperatures T (=150, 180, and 200 °C) for the duration of several different hours t. Then the surface of the Ti foil interacts with the NaOH solution become a Na2Ti2O4(OH)2 film. For the convenience of our discussion, we will use the notation “(T, t)-Na2Ti2O4(OH)2” film to indicate the film produced on Ti foil by the hydrothermal reaction at temperature T °C for the duration of t hours. For our study, we prepared two (150, t)-Na2Ti2O4(OH)2 films (t = 12, 24), four (180, t)-Na2Ti2O4(OH)2 films (t = 12, 24, 30, 48), and four (200, t)-Na2Ti2O4(OH)2 films (t = 24, 48, 72, 96). Then, these films on Ti foil were allowed to cool down slowly at room temperature, and were removed and washed with deionized (DI) water. Subsequently, they were immersed in aqueous solution of HCl (1 vol%) overnight for the H+ ↔ Na+ exchange to produce the corresponding (T, t)-H2Ti2O4(OH)2 films, which were thoroughly washed with DI water, and then air dried.
We obtained TiN films on Ti foil in two different ways: (a) the two-step method: (T, t)-H2Ti2O4(OH)2 films were first heated at 550 °C for 1 h under air to obtain the corresponding (T, t)-TiO2 films, which were subsequently heated to 800 °C (at a rate of 6.5 °C min−1 and were maintained at the temperature for 1 h) under a flow of NH3 gas to obtain the corresponding (T, t)-TiN films on Ti foil. (b) The one-step method: the (T, t)-H2Ti2O4(OH)2 films were heated to 800 °C (at a rate of 6.5 °C min−1 and were maintained at the temperature for 1 h) under a flow of NH3 gas to directly obtain (T, t)-TiN films on Ti foil. The mass loading of TiN films (m) obtained by scraping the TiN layer off from the Ti foil, and the active material mass loading of (200, t)-TiN films per square centimeter is about 1 mg.
Material characterization
The surface morphology and microstructure of H2Ti2O4(OH)2 and TiN films on Ti foil were investigated by using scanning electron microscopy (SEM, Hitachi S-4800 microscope, 5 kV) and high resolution transmission electron microscopy (HR-TEM, JEOL-2100, 200 kV). The crystal structures of the TiN films were characterized by Powder X-ray diffraction (XRD, a Bruker D8-Avance Advanced X-ray diffractometer with monochromatized Cu-Kα radiation) at room temperature.
Electrochemical measurements
The electrochemical properties of the as-prepared TiN films on Ti foil were measured in a standard three-electrode system to evaluate the electrochemical performances by cyclic voltammetry (CV) and galvanostatic charge/discharge (GCD) measurements using CHI660E Electrochemical Working Station (ChenHua, China) with a Pt plate as the counter electrode, a Ag/AgCl (KCl-saturated) electrode as the reference electrode, and the as-prepared TiN films on Ti foil as the working electrode. The CV measurements were carried out with a potential window from −0.6 to 0.2 V with respect to the Ag/AgCl electrode (with the scan rate from 10 to 200 mV s−1). The galvanostatic charge/discharge measurements carried out from −0.6 to 0.2 V with different current densities, and at a current density of 3 A g−1 for 2500 cycles to test the stabilities of the TiN film electrodes. These experiments were carried out in 1.0 M KOH aqueous solution.
Results and discussion
Fabrication of nanoporous TiN on Ti foil
Nanoporous TiN film was fabricated through a simple template-free method by employing a Ti foil as substrate. The fabrication procedure was illustrated in the schematic diagram as shown in Fig. 1. In detail, a Ti foil (1 cm × 1 cm) was firstly immersed in 3 M NaOH solution to form a Na2Ti2O4(OH)2 film on the Ti foil. The Na2Ti2O4(OH)2 film was subsequently converted to H2Ti2O4(OH)2 by ion exchange in aqueous solution of HCl (1 vol%), finally the H2Ti2O4(OH)2 film was nitridated under NH3 flow to form a mesoporous TiN nanosheet film on the Ti foil.
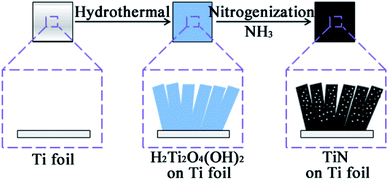 |
| | Fig. 1 The schematic diagram to illustrate the fabrication procedure of TiN film on Ti foil. | |
Structure and morphology
We examine the morphologies of the (150, t)-, (180, t)- and (200, t)-H2Ti2O4(OH)2 films on Ti foil by SEM. The H2Ti2O4(OH)2 films obtained from the hydrothermal reaction at low temperature, namely, the (150, t)-H2Ti2O4(OH)2 films on Ti (t = 12, 24) are fibrous (Fig. S1 in the ESI†). Those obtained at a slightly higher temperature, i.e., the (180, t)-H2Ti2O4(OH)2 films, have irregular shapes for t = 12 and 24 (Fig. S2a and b†), mostly sheets with some fibers for t = 36 (Fig. S2c†), and only sheets when t = 48 (Fig. S2d†). These results suggest that the H2Ti2O4(OH)2 films on Ti will consist of nanosheets for large values of T and t. Indeed, this is the case as shown by the SEM images of the (200, t)-H2Ti2O4(OH)2 films for t = 24, 48 and 72 (Fig. S3a–c†). However, for a very large t, the nanosheets are broken and become agglomerated (e.g., for t = 96) (Fig. S3d†).
The SEM images of the TiN films (Fig. S4†) obtained from the (200, t)-H2Ti2O4(OH)2 films are very similar in nature to the SEM images of the corresponding (200, t)-H2Ti2O4(OH)2 films (Fig. S3†). The SEM images of H2Ti2O4(OH)2 and TiN show that the films consist of nanosheets, but the nanosheets of the former are smooth while those of the latter have many holes. The SEM image of the (200, 96)-TiN film shows the presence of broken TiN nanosheets fallen off from the Ti foil, so that this film on Ti foil is not a good electrode material.
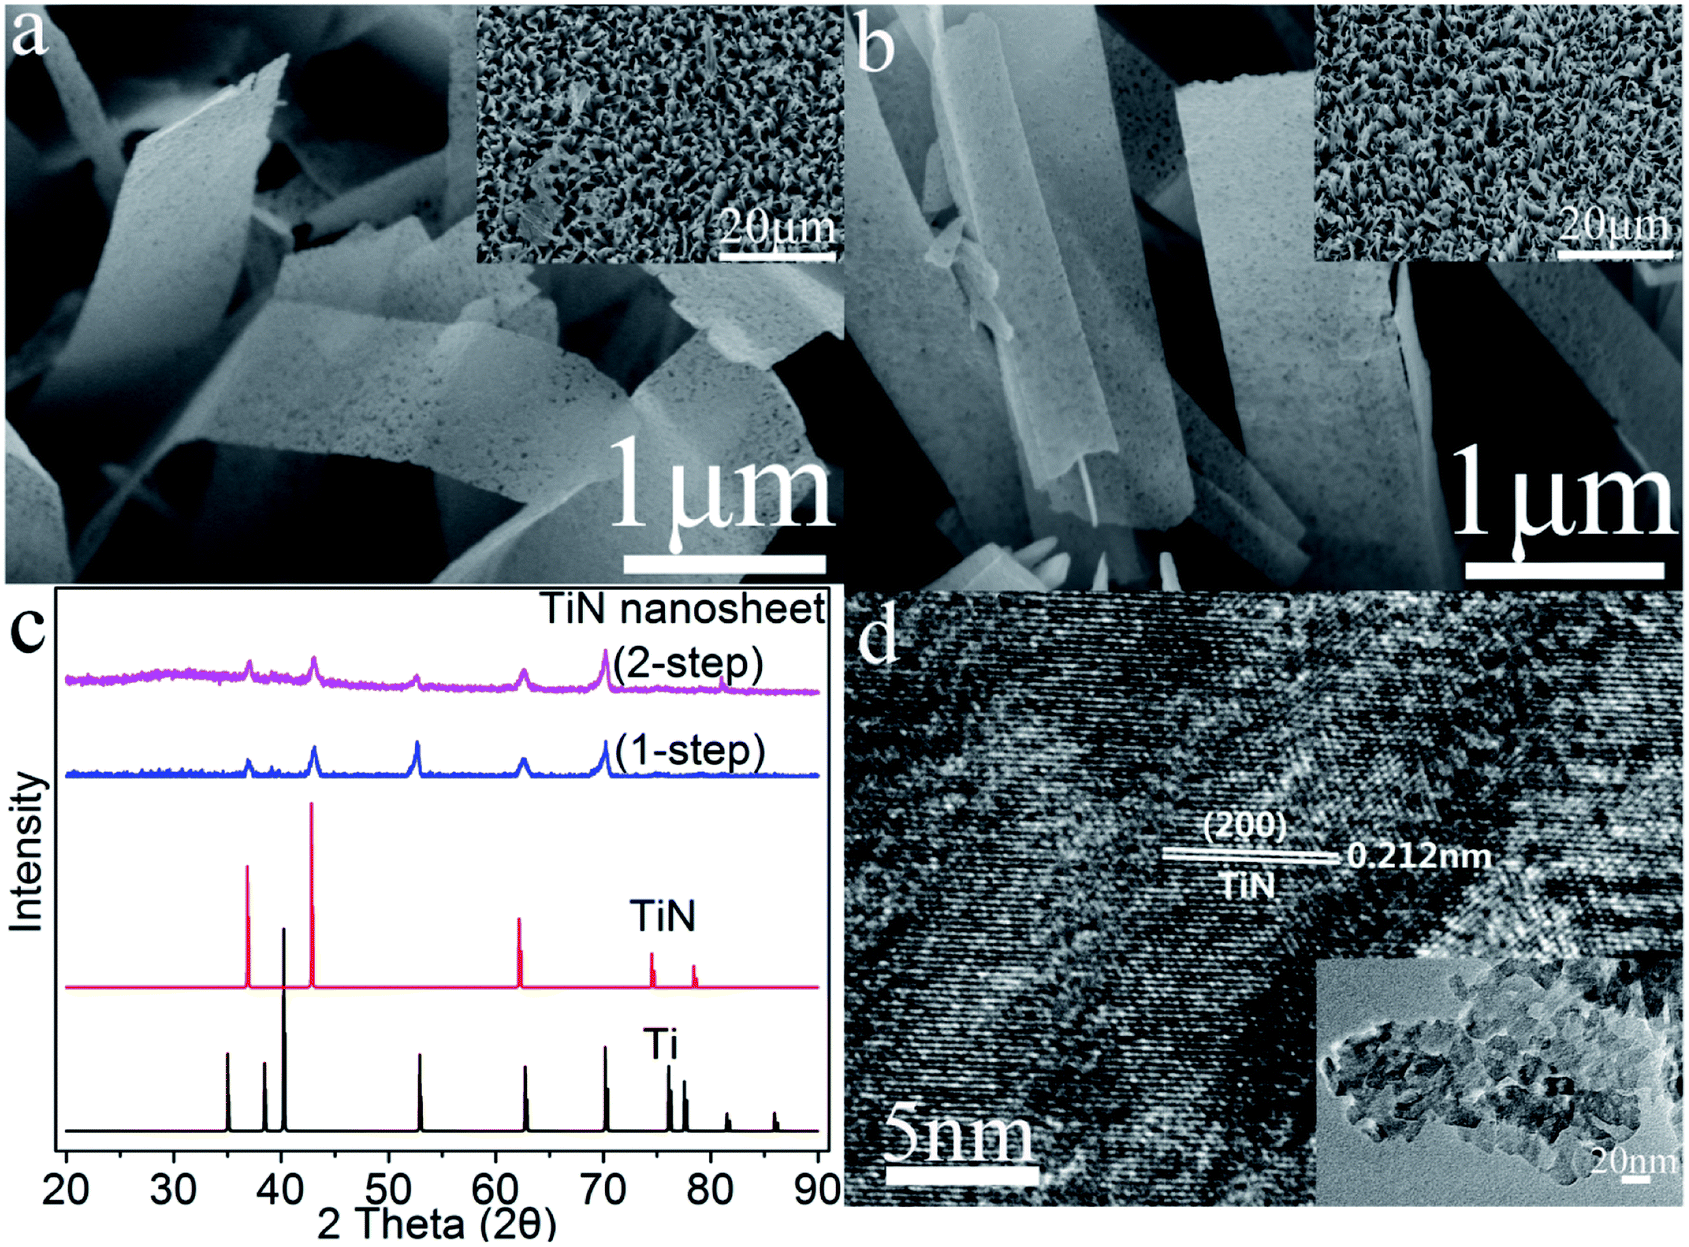
The SEM images of the TiN films obtained from the (200, 48)-H2Ti2O4(OH)2 film using the one-step and two-step methods are presented in Fig. 2a and b. They look very similar not only to each other, but also to the corresponding SEM images of (200, 48)-H2Ti2O4(OH)2 films, suggesting that the two different methods of nitridation do not much affect the morphologies of the H2Ti2O4(OH)2 films. The XRD profiles of the TiN nanosheets on Ti foil obtained by the two different methods are compared with those of bulk TiN and Ti metal in Fig. 2c. The TiN nanosheets obtained from the two different methods have the nearly identical XRD profiles, indicating that the two different methods of nitridation do not much affect the surface appearance of the H2Ti2O4(OH)2 films. The XRD peaks of the two different TiN nanosheets at 2θ = 36.85 ± 0.3°, 42.78 ± 0.3° and 61.96 ± 0.3° match well with those of bulk TiN at 2θ = 36.97°, 43.00° and 62.40°, respectively. These correspond to the reflections of the (111), (200) and (220) planes of cubic TiN, thus indicating that the cubic TiN phase is formed from H2Ti2O4(OH)2 by the nitridation. The HR-TEM image of the (200, 48)-TiN nanosheets obtained using the one-step method (Fig. 2d) show that the nanosheets have a lattice fringe of 0.212 nm, which corresponds to the (200) planes of the cubic TiN.
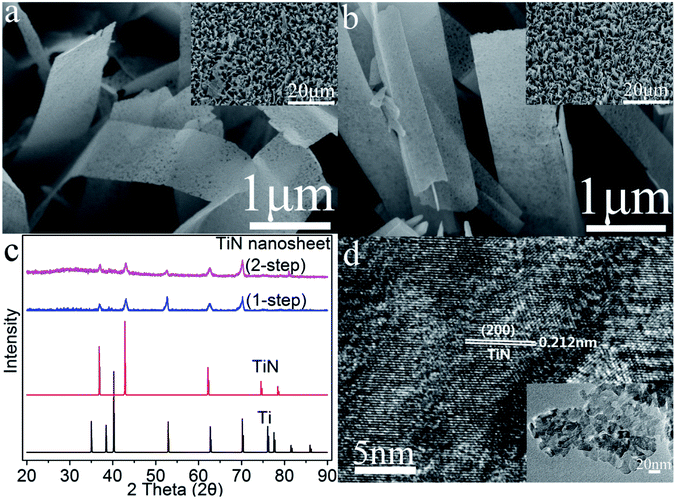 |
| | Fig. 2 SEM images of the TiN nanosheet arrays on Ti foil obtained by (a) the one-step method and (b) the two-step method at 800 °C from the (200, 48)-H2Ti2O4(OH)2 nanosheets on Ti foil. (c) XRD patterns of Ti metal, bulk TiN, and the TiN nanosheet arrays on Ti foil obtained by using two methods. (d) HR-TEM image of the lattice fringe of TiN nanosheet arrays. The inset shows a HR-TEM image. | |
Performance as a single electrode
As already mentioned, the TiN nanosheets obtained by the one-step and two-step methods are indistinguishable by the SEM and XRD measurements. However, the TiN nanosheet electrode from the one-step method exhibits a slightly better electrochemical performance than does that from the two-step method, as can be seen from the CV plots in Fig. S5.† Thus, in the remainder of this work, we will discuss our results based solely on the (200, t)-TiN nanosheet samples prepared by using the one-step nitridation method.
We now evaluate the performances of the (200, t)-TiN nanosheet samples as a working electrode in 1 M KOH solution with a Pt plate as the counter-electrode and an Ag/AgCl electrode as the reference. As already pointed out, the (200, 96)-TiN film on Ti foil is not a good electrode material because the TiN nanosheets are mechanically unstable. Thus, our results are presented only for the (200, 24)-, (200, 48)- and (200, 72)-TiN samples in the remainder of this work.
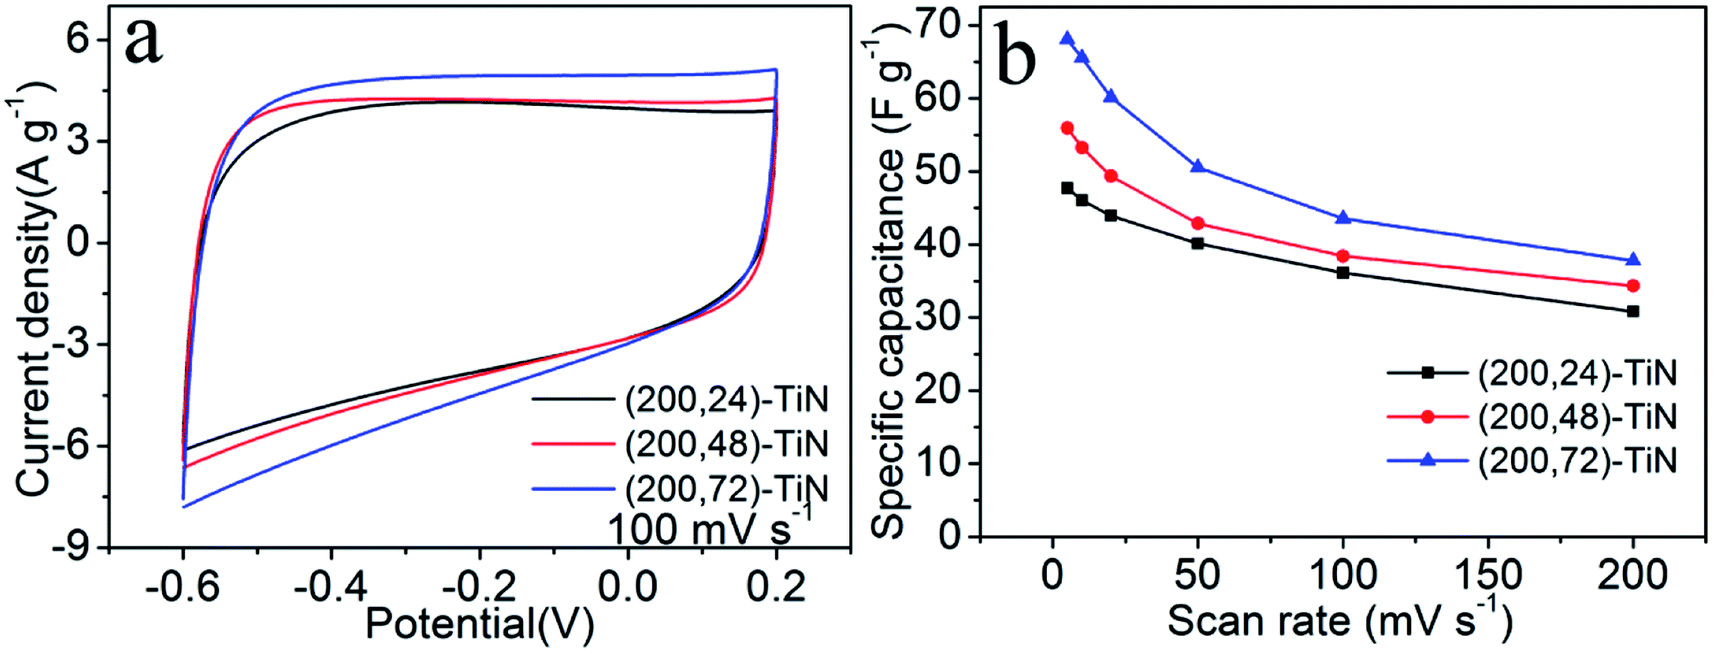
The CV curves of the three (200, t)-TiN nanosheet electrodes measured at different scan rates from 5 to 200 mV s−1 are presented in Fig. S6.† With increasing the scan rate, the CV curves maintain a quasi-rectangular shape even at the very fast scan rate of 200 mV s−1. The current density increases as the scan rate is increased. Fig. 3a shows the CV curves measured at the scan rate of 100 mV s−1 for the (200, t)-TiN nanosheet electrodes. All the CV curves have a quasi-rectangular shape indicating that the capacitance behavior of each TiN nanosheet electrode arises from an electrical double-layer capacitance, with the highest current density from the (200, 72)-TiN nanosheet electrode. The specific capacitance Cs (in F g−1) of each (200, t)-TiN nanosheet electrode was calculated by using the expression24
where
I is the average current of charge and discharge,
φ is the potential range,
m (in g) the mass of the TiN nanosheet,
v is the scan rate, and Δ
V (in V) is the potential window (
Fig. 3b). Among the three (200,
t)-TiN electrodes the highest specific capacitance at all scan rates is found for the (200, 72)-TiN electrode, which has the specific capacitance of 68.1 F g
−1 at the scan rate of 5 mV s
−1. This value is higher than those from the TiN/carbon nanotube and TiN nanorods, comparable to that from the TiN nanoparticles, and lower than those from the TiN nanofibers and nanowires (
Table 1). However, it should be noted that the TiN nanomaterials reported by others exist as powder samples, so the working electrodes are prepared by mixing the powder with a conducting material and an adhesive and then by pressing the mixture onto a metal substrate. In contrast, the TiN nanosheet electrodes on Ti foil prepared in this work can be used directly as an electrode because the TiN nanosheets are grown on a Ti foil.
 |
| | Fig. 3 (a) CV curves collected for the (200, t)-TiN nanosheet electrodes in 1 M KOH electrolyte at a scan rate of 100 mV s−1. (b) Specific capacitances measured for the (200, t)-TiN nanosheet electrodes as a function of scan rates. | |
Table 1 Specific capacitances Cs of the TiN electrodes determined from CV measurements
| |
Scan rate (mV s−1) |
Electrolyte KOH |
Cs (F g−1) |
Ref. |
| The TiN sample is powder. Thus, each electrode was made by mixing the TiN sample, acetylene black and polytetrafluoroethylene (PTFE), and then by coating a Ni foam. |
| TiN nanoparticlesa |
10 |
7.5 M |
11.5 |
22 |
| TiN nanorodsa |
2 |
2 M |
40 |
23 |
| TiN nanofibersa |
50 |
1 M |
97 |
24 |
| TiN nanowires |
10 |
1 M |
123 |
37 |
| TiN nanosheet |
5 |
1 M |
68.1 |
This work |
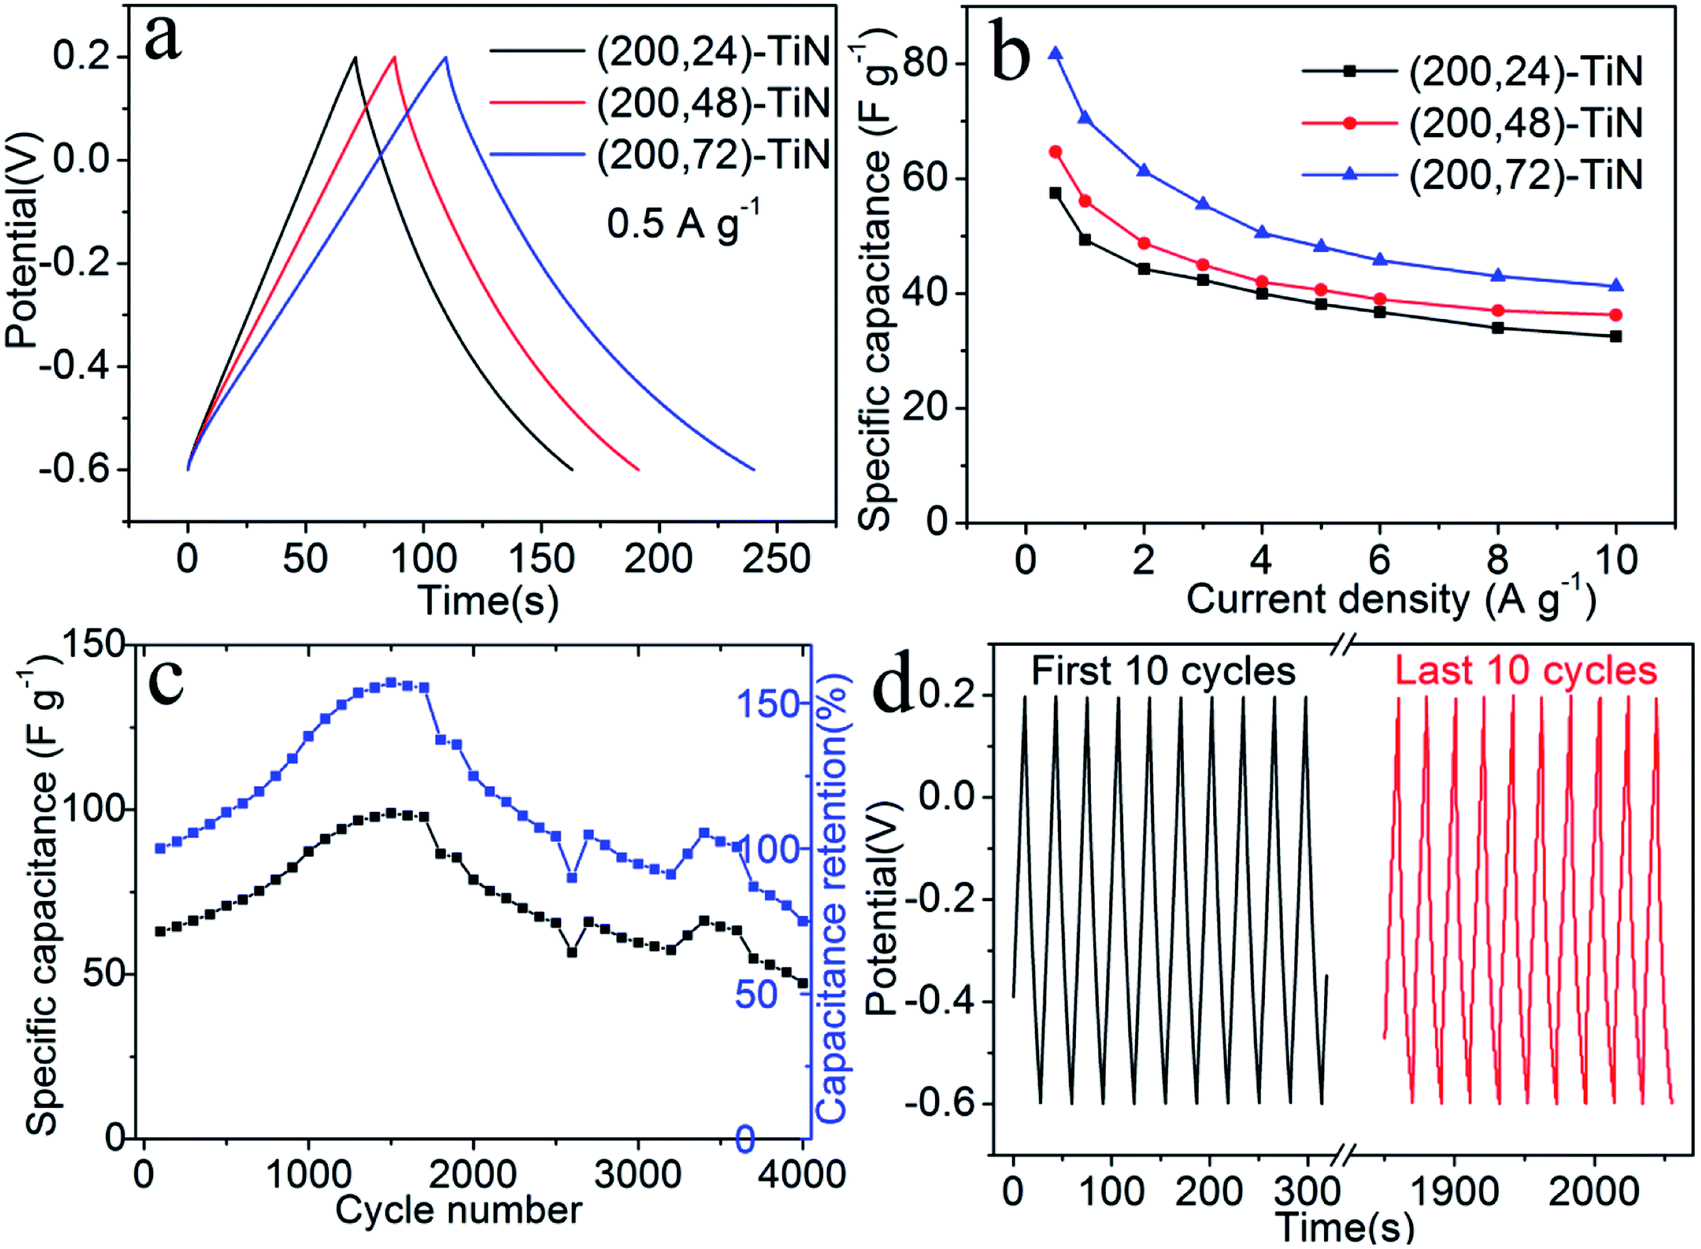
We further characterize the (200, t)-TiN nanosheet electrodes by galvanostatic charge/discharge measurements between the −0.6 to 0.2 V at a current density of 0.5 A g−1 (Fig. 4a). The charge/discharge curves are nearly symmetric, indicating their good capacitive behavior. The charge/discharge times for the (200, t)-TiN electrodes increase with increasing the hydrothermal reaction time t. From the charge/discharge curves determined at different current densities (Fig. S6†), we calculate the specific capacitance Cs of the TiN nanosheet electrode using the expression38
where
I is the discharge current (in A), and Δ
t the discharge time (in s). Our results, summarized in
Fig. 4b, show that the (200, 72)-TiN electrode has the highest
Cs among the three (200,
t)-TiN electrodes at all current densities. At the current density of 0.5 A g
−1, the
Cs values of the (200,
t)-TiN electrodes are 57.5, 64.7, and 81.6 F g
−1 for
t = 24, 48 and 72, respectively. The
Cs values determined from the galvanostatic charge/discharge measurements are slightly larger than those from the CV measurements, as is generally found.
39
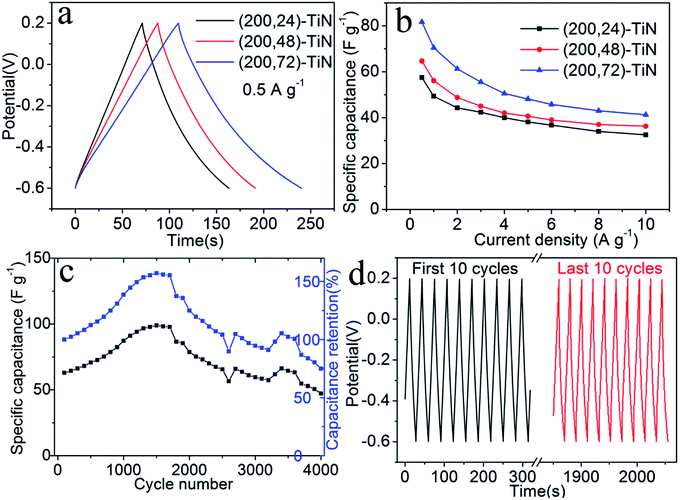 |
| | Fig. 4 (a) Galvanostatic charge/discharge curves collected for the (200, t)-TiN nanosheet electrodes at a current density of 0.5 A g−1 for the electrodes. (b) Calculated specific capacitances (based on the discharge curves) of the electrodes plotted as a function of current density. (c) Cycling performance collected at a current density of 3 A g−1 for the (200, 72)-TiN nanosheet electrode. (d) First 10 and last 10 charge–discharge cycle curves of the (200, 72)-TiN nanosheet electrode. | |
An important feature required for high performance electrode materials is the cycle stability. We examine the cycle stability of the (200, 72)-TiN electrode in aqueous electrolytes (1 M KOH) by galvanostatic charge/discharge measurements at a current density of 3 A g−1 for 4000 cycles (Fig. 4c and d). The (200, 72)-TiN electrode exhibits a slight increase in the total capacitance with the cycle number during the first 1250 cycles due to a self-activation process,39 and then attains a steady level. The reason is probably due to the gradual penetration of the electrolyte into the pores over time. The capacitance of the electrode decreases after 1750 cycles, but still maintains the 100% retention after 2500 cycles, demonstrating its stability and durability. When the cycle experiment was carried out to 4000 cycles, the capacitance retention of the electrode was 75%. The change of the galvanostatic charge/discharge behavior with the increasing of cycle numbers for TiN nanosheet electrode suggests that the ion intercalation/deintercalation under highly basic (pH 14) 1 M KOH electrolyte leads to the chemical instability of the TiN nanosheets causing some changes in the surface composition and appearance (Fig. S7†).
Performance as a supercapacitor
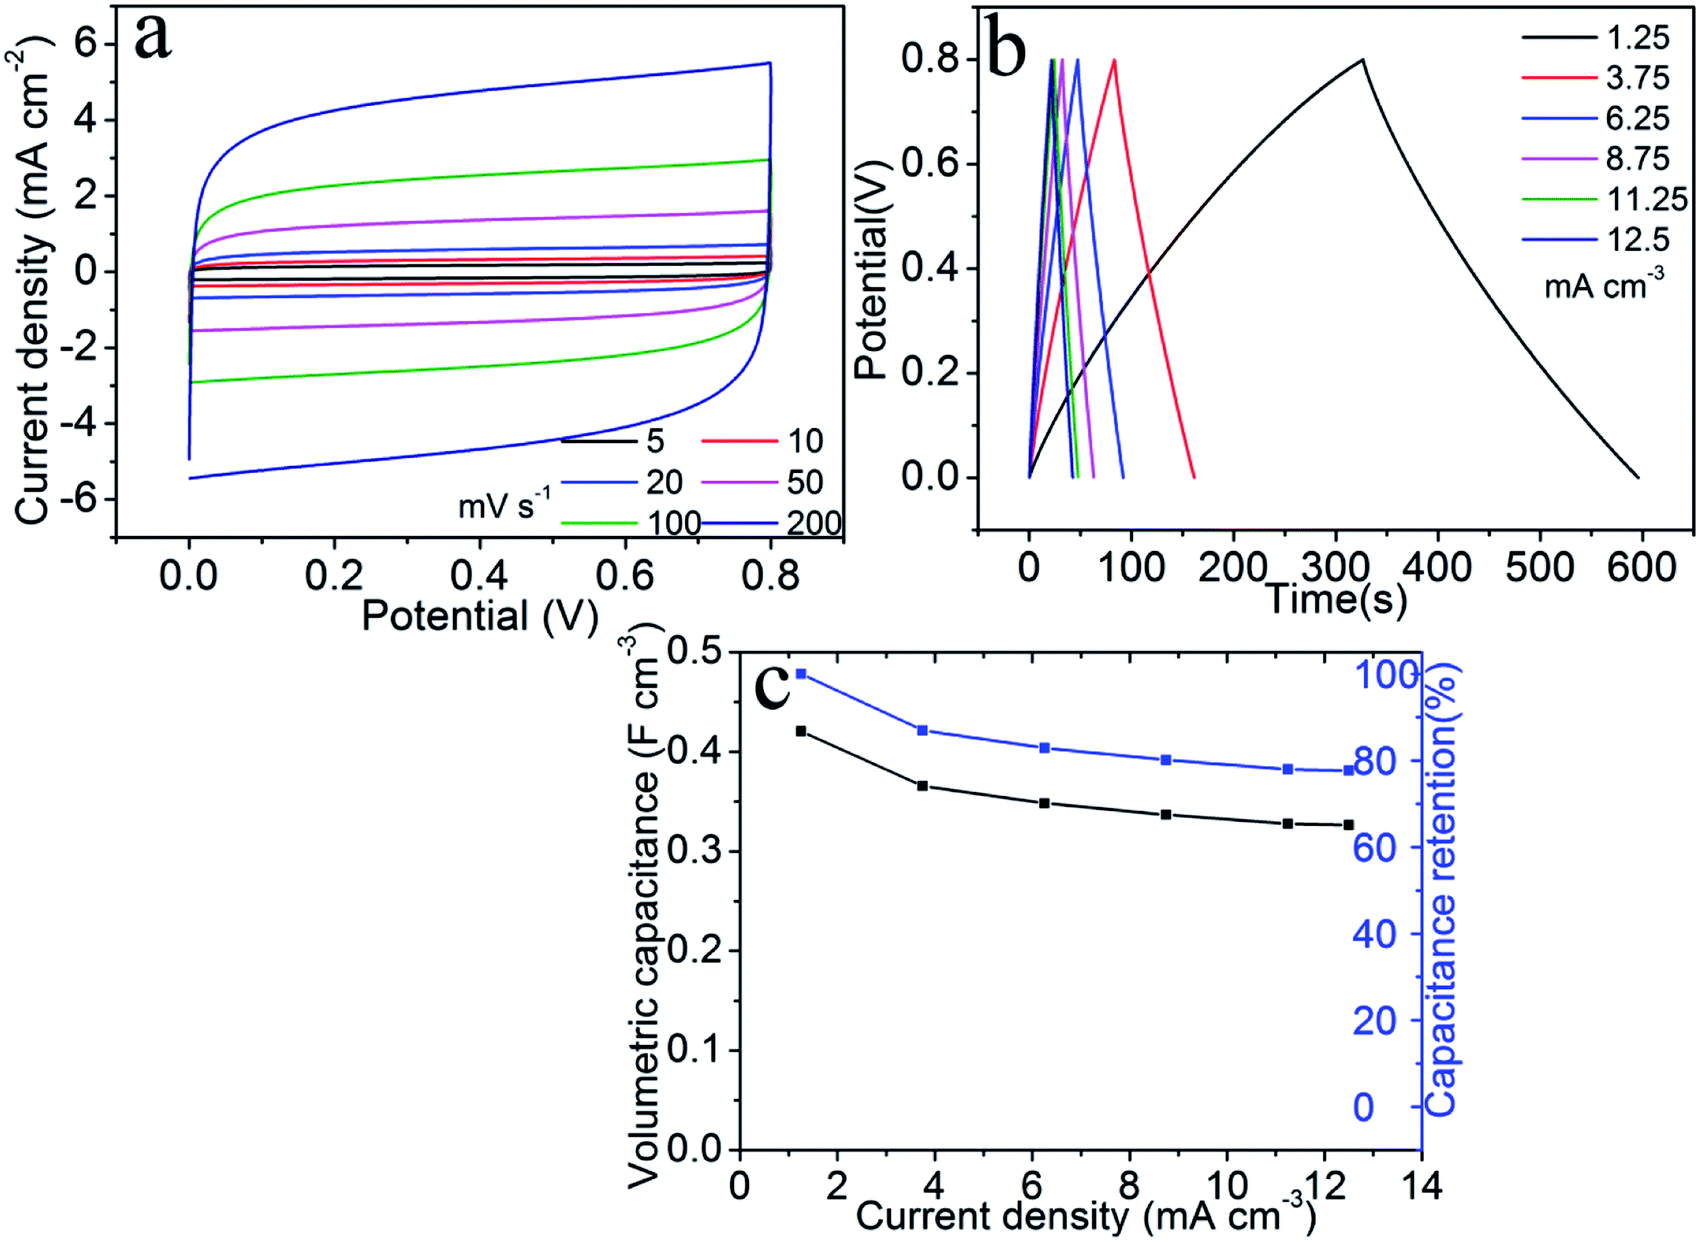
We assembled a symmetric supercapacitor consisting two (200, 72)-TiN nanosheet electrodes sandwiching a solid-state electrolyte [i.e., polyvinyl alcohol (PVA) dissolved in aqueous KOH solution]. This supercapacitor will be referred to as the symmetric TiN supercapacitor, which has a typical thickness of ∼0.8 mm. Fig. 5a shows the CV curves recorded with a potential window from 0 to 0.8 V at different scan rates from 5 to 200 mV s−1. As the scan rate is increased, the CV curves exhibit quasi-rectangular shapes even at a very fast rate of 200 mV s−1. The galvanostatic charge/discharge curves of the supercapacitor recorded at a current density from 1.25 to 12.5 mA cm−3 are presented in Fig. 5b. The charge/discharge curves maintain a symmetric triangle shape at all current densities. Specific capacitances were calculated based on the device volume according to the following formula37
where V refers to the device volume including the active TiN layer, the Ti foil and the solid state electrolyte. When the current density is 1.25 mA cm−3, the specific capacitance of the supercapacitor is calculated to be 0.42 F cm−3 (Fig. 5c), which is comparable to those obtained for graphene-based supercapacitors (0.42 F cm−3 with electrolyte PVA/H3PO4).40 Furthermore, the symmetric TiN supercapacitor retains approximately 77.6% capacitance even at the current density of 12.5 mA cm−3. These good performances of the symmetric TiN supercapacitor are attributed to the high electrical conductivity of the TiN nanosheet electrode as well as the unique structure of nanosheets with large surface area. For supercapacitors, the energy density and the power density are the important measures for their electrochemical performance. The energy density and the power density supercapacitors can be calculated by using the following expressions,37
where E (in W h cm−3) is the energy density, Cv (in mF cm−3) the specific capacitance, ΔV (in V) the potential window of discharge, P (in W cm−3) is the power density, RESR is the internal resistance of the device which is calculated from the voltage drop (Vdrop) at the beginning of the discharge curve, using the formula RESR = Vdrop/(2I), I is the constant current density. The E and P values of the symmetric TiN supercapacitor were compared with those of other supercapacitors in Table 2, which indicates that TiN nanosheet electrodes can be used as a high-energy supercapacitor material.
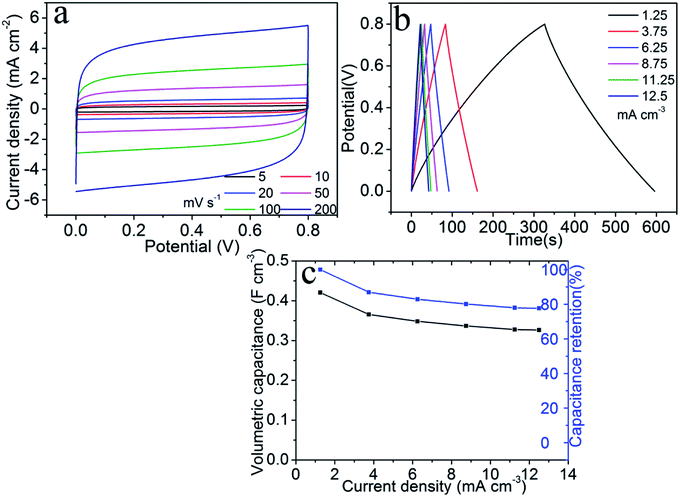 |
| | Fig. 5 (a) Cyclic voltammetry (CV) curves collected with a potential window from 0 V to 0.8 V at different scan rates from 5 to 200 mV s−1. (b) Galvanostatic charge/discharge curves of the TiN-SCs collected at current density from 1.25 to 12.5 mA cm−3. (c) Volumetric specific capacitance and specific capacitance retention of the solid-state TiN-SC. | |
Table 2 Energy and power densities of the symmetric TiN supercapacitor and other supercapacitors
| Supercapacitor |
Energy density (m W h cm−3) |
Power density (W cm−3) |
Ref. |
| Symmetric TiN supercapacitor |
0.0374 |
66.7 |
This work |
| Symmetric TiN supercapacitor |
0.0325 |
109.1 |
This work |
| Symmetric TiN supercapacitor |
0.0310 |
133.3 |
This work |
| Symmetric TiN supercapacitor |
0.0299 |
164.7 |
This work |
| Symmetric TiN supercapacitor |
0.0291 |
189.5 |
This work |
| Symmetric TiN supercapacitor |
0.0290 |
200 |
This work |
| Multiple-walled carbon nanotube supercapacitor |
0.0084 |
1.1 |
41 |
| Single-walled carbon nanotube supercapacitor |
0.0200 |
20 |
40 |
| TiN nanowire supercapacitor |
0.0500 |
120 |
21 |
| Graphene supercapacitor |
0.0600 |
200 |
37 |
Conclusions
In summary, we developed a simple template-free method of preparing mesoporous TiN nanostructures directly on Ti foils. The highly conductive Ti foil enables an efficient charge transport, and the direct connection between TiN nanosheets and Ti foil without binder can effectively promote the interfacial charge transfer. Thus, the TiN nanosheets on the Ti plate can be used as an electrode directly without any subsequent processing. As a result, the specific capacitance of TiN nanosheets electrode measured at the current density of 0.5 A g−1 reaches 81.63 F g−1, and the capacitance retention is still 100% after 2500 cycles. The symmetric TiN supercapacitor shows a specific capacitance of 0.42 F cm−3, and retains 77.6% of the capacitance even at the current density of 12.5 mA cm−3. This method is expected to be useful in fabricating other high-performance metal nitride materials for supercapacitors.
Conflicts of interest
The authors declare no competing financial interest.
Acknowledgements
This work was financially supported by the National Natural Science Foundation of China (No. 21333006, 21573135, 11374190, 51602179 and 51321091). B. B. H acknowledged the support from Taishan Scholar Foundation of Shandong Province, China. Z. Y. W. acknowledged the support from Young Scholars Program (2015WLJH35).
References
- N.-L. Wu, ICMAT 2001 Symp. C Nov. Adv. Ceram., 2002, vol. 75, pp. 6–11 Search PubMed.
- R. N. Reddy and R. G. Reddy, J. Power Sources, 2003, 124, 330–337 CrossRef CAS.
- K. Wang, W. Zou, B. Quan, A. Yu, H. Wu, P. Jiang and Z. Wei, Adv. Energy Mater., 2011, 1, 1068–1072 CrossRef CAS.
- J. Xiao and S. Yang, J. Mater. Chem., 2012, 22, 12253 RSC.
- X. Lu, M. Yu, G. Wang, T. Zhai, S. Xie, Y. Ling, Y. Tong and Y. Li, Adv. Mater., 2013, 25, 267–272 CrossRef CAS PubMed.
- L. L. Zhang and X. S. Zhao, Chem. Soc. Rev., 2009, 38, 2520 RSC.
- G. Wang, Y. Ling, F. Qian, X. Yang, X.-X. Liu and Y. Li, J. Power Sources, 2011, 196, 5209–5214 CrossRef CAS.
- H. Gwon, H.-S. Kim, K. U. Lee, D.-H. Seo, Y. C. Park, Y.-S. Lee, B. T. Ahn and K. Kang, Energy Environ. Sci., 2011, 4, 1277 CAS.
- X. Wang, G. Li, Z. Chen, V. Augustyn, X. Ma, G. Wang, B. Dunn and Y. Lu, Adv. Energy Mater., 2011, 1, 1089–1093 CrossRef CAS.
- C. Guan, J. Liu, C. Cheng, H. Li, X. Li, W. Zhou, H. Zhang and H. J. Fan, Energy Environ. Sci., 2011, 4, 4496 CAS.
- Q. Li, Z.-L. Wang, G.-R. Li, R. Guo, L.-X. Ding and Y.-X. Tong, Nano Lett., 2012, 12, 3803–3807 CrossRef CAS PubMed.
- G. Wang, L. Zhang and J. Zhang, Chem. Soc. Rev., 2012, 41, 797–828 RSC.
- Z.-L. Wang, R. Guo, G.-R. Li, H.-L. Lu, Z.-Q. Liu, F.-M. Xiao, M. Zhang and Y.-X. Tong, J. Mater. Chem., 2012, 22, 2401 RSC.
- C. Zhu, P. Yang, D. Chao, X. Wang, X. Zhang, S. Chen, B. K. Tay, H. Huang, H. Zhang, W. Mai and H. J. Fan, Adv. Mater., 2015, 27, 4566–4571 CrossRef CAS PubMed.
- X. Lu, M. Yu, T. Zhai, G. Wang, S. Xie, T. Liu, C. Liang, Y. Tong and Y. Li, Nano Lett., 2013, 13, 2628–2633 CrossRef CAS PubMed.
- P. Simon and Y. Gogotsi, Nat. Mater., 2008, 7, 845 CrossRef CAS PubMed.
- D. Choi, G. E. Blomgren and P. N. Kumta, Adv. Mater., 2006, 18, 1178–1182 CrossRef CAS.
- A. M. Glushenkov, D. Hulicova-Jurcakova, D. Llewellyn, G. Q. Lu and Y. Chen, Chem. Mater., 2010, 22, 914–921 CrossRef CAS.
- H.-Y. Wang, B. Li, J.-X. Teng, H.-L. Zhu, Y.-X. Qi, L.-W. Yin, H. Li, N. Lun and Y.-J. Bai, Electrochim. Acta, 2017, 257, 56–63 CrossRef CAS.
- H. Shi, H. Zhang, Z. Chen, T. Wang, L. Wang, W. Zeng, G. Zhang and H. Duan, Chem. Eng. J., 2018, 336, 12–19 CrossRef CAS.
- X. Lu, G. Wang, T. Zhai, M. Yu, S. Xie, Y. Ling, C. Liang, Y. Tong and Y. Li, Nano Lett., 2012, 12, 5376–5381 CrossRef CAS PubMed.
- L. Jiang and L. Gao, J. Am. Ceram. Soc., 2006, 89, 156–161 CrossRef CAS.
- D. Sun, J. Lang, X. Yan, L. Hu and Q. Xue, J. Solid State Chem., 2011, 184, 1333–1338 CrossRef CAS.
- X. Zhou, C. Shang, L. Gu, S. Dong, X. Chen, P. Han, L. Li, J. Yao, Z. Liu, H. Xu, Y. Zhu and G. Cui, ACS Appl. Mater. Interfaces, 2011, 3, 3058–3063 CAS.
- H. Chen, A. Nambu, J. Graciani, J. C. Hanson, E. Fujita and J. A. Rodriguez, J. Phys. Chem. C, 2007, 111, 1366–1372 CAS.
- J. Buha, I. Djerdj, M. Antonietti and M. Niederberger, Chem. Mater., 2007, 19, 3499–3505 CrossRef CAS.
- B. Mazumder and A. L. Hector, J. Mater. Chem., 2009, 19, 4673 RSC.
- Q. W. Jiang, G. R. Li and X. P. Gao, Chem. Commun., 2009, 6720 RSC.
- Y.-S. Jun, W. H. Hong, M. Antonietti and A. Thomas, Adv. Mater., 2009, 21, 4270–4274 CrossRef CAS.
- S. Dong, X. Chen, L. Gu, X. Zhou, H. Xu, H. Wang, Z. Liu, P. Han, J. Yao, L. Wang, G. Cui and L. Chen, ACS Appl. Mater. Interfaces, 2011, 3, 93–98 CAS.
- B. M. Gray, S. Hassan, A. L. Hector, A. Kalaji and B. Mazumder, Chem. Mater., 2009, 21, 4210–4215 CrossRef CAS.
- D. Choi and P. N. Kumta, J. Electrochem. Soc., 2006, 153, A2298 CrossRef CAS.
- Y. Yu, L. Gu, C. Zhu, S. Tsukimoto, P. A. van Aken and J. Maier, Adv. Mater., 2010, 22, 2247–2250 CrossRef CAS PubMed.
- Y. Ren, L. J. Hardwick and P. G. Bruce, Angew. Chem., 2010, 122, 2624–2628 CrossRef.
- P. Sun, R. Lin, Z. Wang, M. Qiu, Z. Chai, B. Zhang, H. Meng, S. Tan, C. Zhao and W. Mai, Nano Energy, 2017, 31, 432–440 CrossRef CAS.
- J.-Y. Liao, B.-X. Lei, H.-Y. Chen, D.-B. Kuang and C.-Y. Su, Energy Environ. Sci., 2012, 5, 5750–5757 CAS.
- M. F. El-Kady, V. Strong, S. Dubin and R. B. Kaner, Science, 2012, 335, 1326 CrossRef CAS PubMed.
- G. Zhang, Y. Song, H. Zhang, J. Xu, H. Duan and J. Liu, Adv. Funct. Mater., 2016, 26, 3012–3020 CrossRef CAS.
- X. Lu, D. Zheng, T. Zhai, Z. Liu, Y. Huang, S. Xie and Y. Tong, Energy Environ. Sci., 2011, 4, 2915 CAS.
- M. Kaempgen, C. K. Chan, J. Ma, Y. Cui and G. Gruner, Nano Lett., 2009, 9, 1872–1876 CrossRef CAS PubMed.
- Y. J. Kang, H. Chung, C.-H. Han and W. Kim, Nanotechnology, 2012, 23, 289501 CrossRef.
Footnote |
| † Electronic supplementary information (ESI) available: Ss. See DOI: 10.1039/c8ra01001c |
|
| This journal is © The Royal Society of Chemistry 2018 |
Click here to see how this site uses Cookies. View our privacy policy here. 
 Open Access Article
 This Open Access Article is licensed under a Creative Commons Attribution-Non Commercial 3.0 Unported Licence
 a,
Xiaoyan Qina,
Xiaoyang Zhanga,
Ying Dai
a,
Xiaoyan Qina,
Xiaoyang Zhanga,
Ying Dai