DOI:
10.1039/C8RA00954F
(Paper)
RSC Adv., 2018,
8, 16973-16990
Copper complexes as prospective anticancer agents: in vitro and in vivo evaluation, selective targeting of cancer cells by DNA damage and S phase arrest†
Received
31st January 2018
, Accepted 29th April 2018
First published on 9th May 2018
Abstract
A series of six new bis(thiosemicarbazone)copper(I) complexes of the type [Cu(L1–6)2Cl] (1–6) have been synthesized and characterized. The molecular structure of the ligand L4 was determined by the single crystal XRD method. All the complexes adopted trigonal planar (Y-shaped) geometry. All the complexes strongly bind with CT-DNA via intercalative mode, which was further supported by molecular docking studies. Further, the complexes were effectively bind with BSA as observed by UV-Vis and fluorescence spectra. All the complexes effectively cleave pBR322 DNA through hydrolytic pathway as evidenced from T4 ligase experiments. All the complexes interact with the anticancer receptor focal adhesion kinase (FAK) via electrostatic, van der Waals, hydrogen bonding, σ–π and π–π interactions. In vitro cytotoxicity of the complexes were assessed by MTT assay against four cancer cell lines such as human breast adenocarcinoma (MCF-7), cervical (HeLa), epithelioma (Hep-2) and Ehrlich ascites carcinoma (EAC), and two normal cell lines namely normal human dermal fibroblasts (NHDF) and L6 myotubes with respect to the commercially used anticancer drug cisplatin. All the complexes induce apoptosis in EAC cells, which was confirmed by AO/EB, Hoechst 33258 and PI staining methods. The complexes block cell cycle progression of EAC cells in S phase (DNA synthesis). The cellular uptake studies confirmed the ability of the complexes to go into the cytoplasm and accumulation in the cell nuclei. In the in vivo anticancer studies, the complexes significantly reduce the tumour volume in female Swiss albino mice. Overall, our results ensure the role of thiosemicarbazone-based copper(I) complexes as prospective anticancer agents, induction of apoptosis and S phase arrest with the mitochondrial controlled pathway.
Introduction
Thiosemicarbazones and its derivatives have attracted scholarly attention because of their structure and prominent role in cancer chemotherapy.1,2 For example, 3-aminopyridine-2-carboxaldehyde thiosemicarbazone (triapine) is a potential inhibitor of ribonucleotide reductase, which exhibits promising anticancer activity in several clinical trials on patients with hematological diseases. Similarly, di-2-pyridylketone-4,4-dimethyl-3-thiosemicarbazone (Dp44mt) and di-2-pyridylketone-4-cyclohexyl-4-methyl-3-thiosemicarbazone (DpC) are examined as drug candidates and entered into the phase I clinical trials.3 In addition, the di-2-pyridylketone thiosemicarbazones (DpT) have showed significant in vitro and in vivo antitumor activity against various cancer cell lines.1 On the other hand, CuII-diacetyl-bis(N4-methylthiosemicarbazone) radiolabeled with copper radioactive isotopes is entered in human clinical trials as an imaging agent of hypoxia in head and neck cancer.4 The bis(thiosemicarbazonato)copper(II) complexes have also been investigated as an effective therapeutic agent for the treatment of neurodegenerative disorders,5 and further, such complexes robustly inhibit the oxidative phosphorylation and DNA synthesis.6,7 In vitro and in vivo studies of glyoxal-bis[N(4)-methylthiosemicarbazonato]copper(II) complexes have demonstrated the strong inhibition of the growth of brain tumor and prostate cancer cells,8 delivers Cu into neurons, activating PI3K and inhibiting GSK3, resulting in the reduction of neurotoxic Aβ trimers and τ-phosphorylation and improving cognition in APP/PS1 mice.5 In addition, the significant therapeutic potential of thiosemicarbazone-based copper complexes for Parkinson's and Alzheimer's diseases in animal models are also reported.5,9 The thiosemicarbazone-based copper(II) complexes significantly inhibit topoisomerase-IIα when compared to the free thiosemicarbazones. Such complexes were also inhibit the proliferation of breast cancer cells (MCF-7).10 Further, the thiosemicarbazone-based copper(II) complexes containing anthracene moiety strongly interact with DNA/BSA and exhibit remarkable anticancer activity against HeLa cancer cell line.11 It was recently reported that the iminodiacetate thiosemicarbazones-based copper(II) complexes functions as ribonucleotide reductase R2 inhibitors.12
As a whole, the thiosemicarbazones and bis(thiosemicarbazones)-based copper(II) complexes are broadly interrogated. However, the reports of bis(thiosemicarbazones)-based copper(I) complexes are very limited.13,14 Notably, three coordinate copper(I) complexes have been investigated for DNA interaction, antibacterial and anticancer activity on human colon and breast cancer cells.15–18 The copper(I) chelator MT-3 (metallothionein-3) was significantly protecting cells from Cu-Aβ toxicity compared to copper(II) chelator HSA (Human Serum Albumin). For this reason, +I state of Cu is as much biologically relevant as the +II state.19 Many Cu(I) complexes are found to strongly inhibit the ribo nucleoside diphosphate reductase.20 The redox cycling applications between Cu2+ and Cu+ can begin the production of highly reactive hydroxyl radicals, which can subsequently damage biomolecular species such as lipids, proteins and DNA.21 The N,N′-disubstituted thioureas-based copper(I) complexes showed moderate cytotoxicity against A498, EVSA-T, H226, IGROV, M19, MCF-7 and WIDR cell lines.22 The Cu(I) ions are famous for their high cytotoxicity as an impact of oxidative damage (particularly against eukaryotic and prokaryotic cells), while as Cu(I) helicates might be accurately directed to molecular targets into the shilpit cells.23 Numerous organisms encode a small cytoplasmic high affinity Cu(I) fastening protein, termed a copper chaperone that assumes a role in constraining the collateral damage of copper toxicity.24 Recently, the copper(I) phosphine complexes were reported, which shows significant cytotoxic and anti-angiogenic property and induced a marked reduction of tumor mass in in vivo experiments without a significant body weight loss with smaller adverse side effects than cisplatin.25 To the best of our knowledge, DFT calculations, DNA/BSA interaction, in vitro and in vivo anti-proliferative, cell cycle arrest, generation of ROS, Western blot and molecular modeling studies of bis(thiosemicarbazones)-based copper(I) complexes and their derivatives are scare in literature.17
Based on the above information, we are prompted to target selected cancer cells by both in vitro and in vivo, and study their mechanism of action. To achieve this, we have synthesized new thiosemicarbazone based-copper(I) complexes. In vitro cytotoxicity of the complexes was tested against four human breast adenocarcinoma (MCF-7), cervical (HeLa), epithelioma (Hep-2) and Ehrlich ascites carcinoma (EAC) cancerous and two normal (normal human dermal fibroblasts (NHDF) and L6 myotubes) cell lines. In vivo anticancer activity of the complexes was tested against EAC tumor model using female Swiss albino mice. We have also explored the DFT calculations to elucidate the details of the geometry optimization, electronic structures and frontier molecular orbitals (FMOs). The DNA and focal adhesion kinase (FAK) receptor docking studies were performed by using AutoDock 4.2 tools.
Experimental
Materials
Thiosemicarbazide, acetophenone, 4-chloroacetophenone, 4-hydroxyacetophenone, 4-methylacetophenone, 4-methoxyacetophenone and 4-nitroacetophenone used for ligand synthesis were purchased from Sigma-Aldrich (USA). Solvents of analytical grade were purchased from E. Merck, and used as received without further purification. Agarose (molecular biology grade) and ethidium bromide were procured from Sigma-Aldrich (USA). Calf-thymus DNA (CT-DNA) and supercoiled pBR322 DNA were purchased from Bangalore Genei (India). Tris(hydroxymethyl)aminomethane-hydrochloride (Tris–HCl) buffer (pH, 7.3) was used for all DNA binding and cleavage studies.
The ligands 2-(1-phenylethylidene)hydrazinecarbothioamide (L1), 2-(1-(4-tolyl) ethylidene)hydrazinecarbothioamide (L2), 2-(1-(4-methoxyphenyl)ethylidene)hydrazinecarbothioamide (L3), 2-(1-(4-hydroxyphenyl)ethylidene)hydrazinecarbothioamide (L4), 2-(1-(4-nitrophenyl)ethylidene)hydrazinecarbothioamide (L5) and 2-(1-(4-chlorophenyl)ethylidene)hydrazinecarbothioamide (L6) were synthesized by following the procedure as described in the literature.26
Physical measurements
The elemental analysis (CHN) of the compounds was carried out with a Carlo Erba model-1106 elemental analyzer. IR spectra were recorded on a Perkin-Elmer FT IR 8300 model spectrophotometer using KBr disc technique in the range 4000–400 cm−1. Electronic absorption spectra were recorded using Perkin-Elmer Lambda-35 spectrophotometer in the range 200–800 nm. 1H NMR spectral data were collected on Varian-VNMRS-400 in CDCl3 and DMSO(d6) solution with tetramethylsilane (TMS) as an internal standard at ambient temperature. Fluorescence spectra were recorded on a Horiba Jobin Yvon FluoroLog SPEX-F311 spectrofluorometer. Circular dichroic spectra were recorded in the spectral region 200–300 nm with a Jasco J-815 spectropolarimeter at 25 °C using 0.1 cm path quartz cell. Electrospray ionization (ESI) mass spectra were recorded on Q-Tof mass spectrometer using acetonitrile as a carrier solvent.
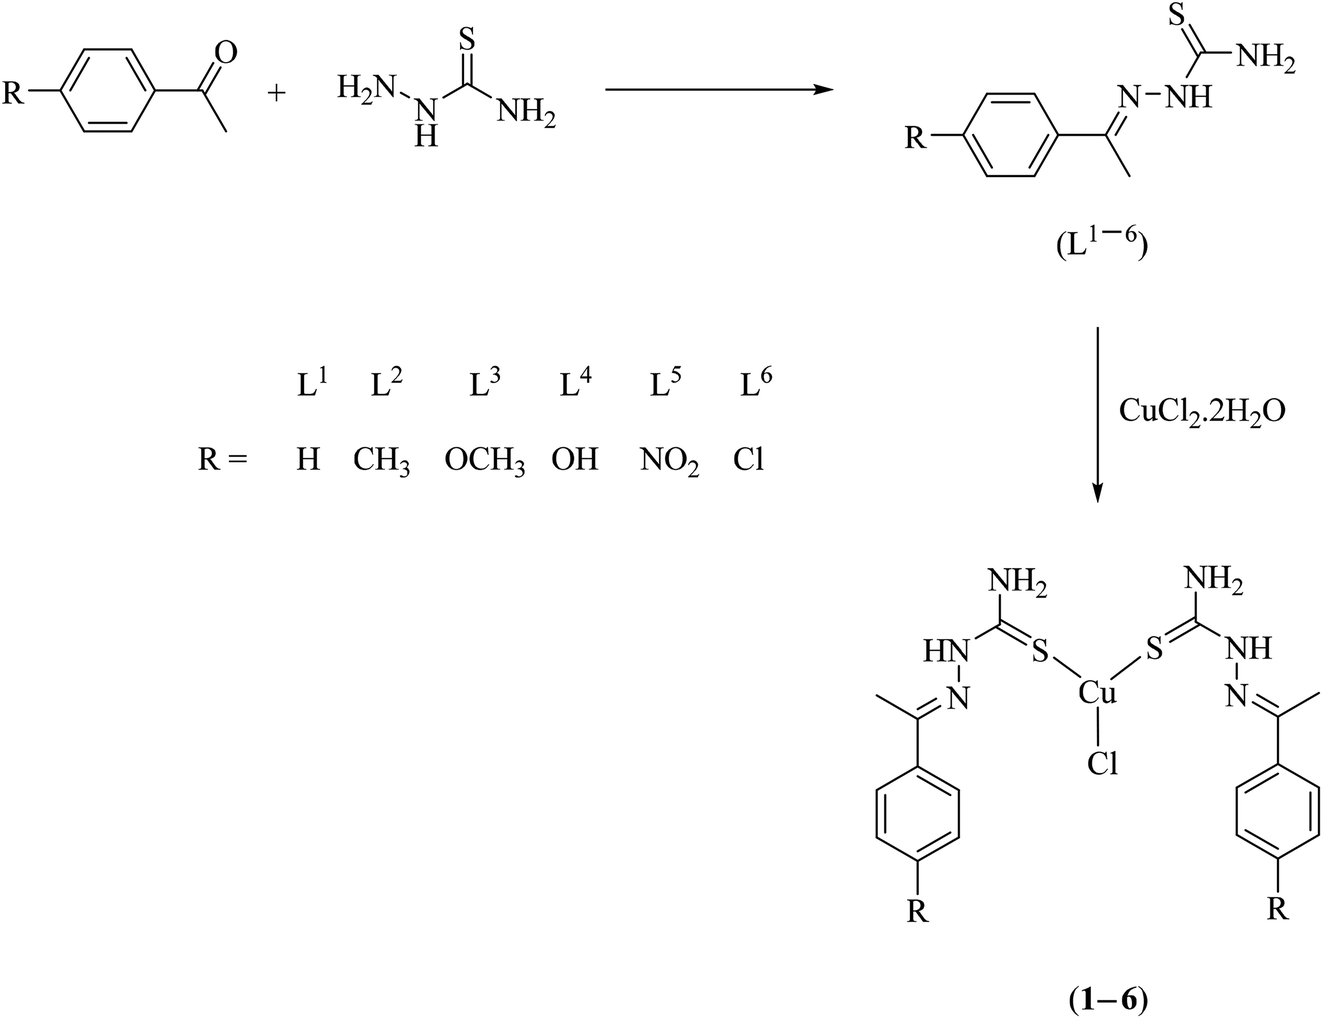
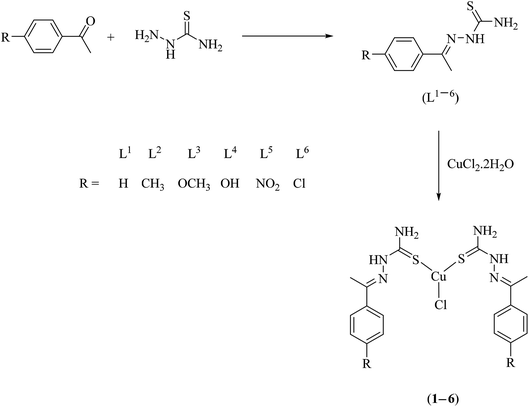
General procedure for synthesis of bis(thiosemicarbazone)copper(I) complexes (1–6)
A methanolic solution (20 mL) of 4-substituted-thiosemicarbazone (L1–6, 1 mmol) was added slowly with constant stirring to a methanolic solution (20 mL) of CuCl2·2H2O (0.09 g, 0.5 mmol), and the resulting solution was refluxed for 4 h. After cooling the reaction mixture to room temperature, the solid product obtained was collected by filtration, washed with diethyl ether, dried under vacuum, and recrystallized from methanol.
[Cu(L1)2Cl] (1). Yield: 0.47 g, (96.8%); colour: colourless; anal. calc. for: C18H22N6S2ClCu (485.54): C, 44.53; H, 4.57; N, 17.31; found: C, 44.32; H, 5.09; N, 17.13%. Selected IR data (KBr, ν/cm−1): 3409 ν(N–H)asym, 3336 ν(N–H)sym, 3161 ν(C–H), 1606 ν(C![[double bond, length as m-dash]](https://www.rsc.org/images/entities/char_e001.gif) N), 1587 ν(N–H)bending, 832 ν(CS). UV-Vis [λmax (nm) (ε, M−1 cm−1)] in MeOH: 228 (36
N), 1587 ν(N–H)bending, 832 ν(CS). UV-Vis [λmax (nm) (ε, M−1 cm−1)] in MeOH: 228 (36![[thin space (1/6-em)]](https://www.rsc.org/images/entities/char_2009.gif) 760; π–π*), 346 (3370; n–π*). 1H NMR (400 MHz, CDCl3) (d ppm): 9.69 (s, 1H, NH), 8.99 (s, 1H, NH2), 7.45–7.56 (m, 5H, aromatic), 2.36 (s, 3H, Me). ESI-MS (m/z): 485.54 [Cu(L1)2Cl]+.
760; π–π*), 346 (3370; n–π*). 1H NMR (400 MHz, CDCl3) (d ppm): 9.69 (s, 1H, NH), 8.99 (s, 1H, NH2), 7.45–7.56 (m, 5H, aromatic), 2.36 (s, 3H, Me). ESI-MS (m/z): 485.54 [Cu(L1)2Cl]+.
[Cu(L2)2Cl] (2). Yield: 0.49 g, (95.4%); colour: colourless; anal. calc. for: C20H26N6S2ClCu (513.59); C, 46.77; H, 5.10; N, 16.36; found: C, 46.42; H, 5.29; N, 16.11%. Selected IR data (KBr, ν/cm−1): 3411 ν(N–H)asym, 3341 ν(N–H)sym, 3169 ν(C–H), 1610 ν(CN), 1567 ν(N–H)bending, 828 ν(CS). UV-Vis [λmax (nm) (ε, M−1 cm−1)] in MeOH: 227 (35290; π–π*), 351 (3560; n–π*). 1H NMR (400 MHz, CDCl3) (d ppm): 9.74 (s, 1H, NH), 8.94 (s, 1H, NH2), 7.17–7.86 (m, 5H, aromatic), 2.31 (s, 3H, Me). ESI-MS (m/z): 513.59 [Cu(L2)2Cl]+.
[Cu(L3)2Cl] (3). Yield: 0.51 g, (93.5%); colour: colourless; anal. calc. for: C20H26N6O2S2ClCu (545.59); C, 44.03; H, 4.80; N, 15.40; found: C, 44.38; H, 4.61; N, 15.22%. Selected IR data (KBr, ν/cm−1): 3417 ν(N–H)asym, 3343 ν(N–H)sym, 3178 ν(C–H), 1631 ν(CN), 1596 ν(N–H)bending, 836 ν(CS). UV-Vis [λmax (nm) (ε, M−1 cm−1)] in MeOH: 234 (39580; π–π*), 348 (3480; n–π*). ESI-MS (m/z): 545.60 [Cu(L3)2Cl]+.
[Cu(L4)2Cl] (4). Yield: 0.48 g, (92.7%); colour: colourless; anal. calc. for: C18H22N6O2S2ClCu (517.54); C, 41.77; H, 4.28; N, 16.24; found: C, 41.94; H, 4.09; N, 16.16%. Selected IR data (KBr, ν/cm−1): 3419 ν(N–H)asym, 3346 ν(N–H)sym, 3176 ν(C–H), 1633 ν(CN), 1573 ν(N–H)bending, 831 ν(CS). UV-Vis [λmax (nm) (ε, M−1 cm−1)] in MeOH: 231 (39100; π–π*), 353 (3610; n–π*). ESI–MS (m/z): 517.54 [Cu(L4)2Cl]+.
[Cu(L5)2Cl] (5). Yield: 0.53 g, (92.1%); colour: colourless; anal. calc. for: C18H20N8O4S2ClCu (575.53); C, 37.56; H, 3.50; N, 19.47; found: C, 37.27; H, 3.42; N, 19.28%. Selected IR data (KBr, ν/cm−1): 3418 ν(N–H)asym, 3329 ν(N–H)sym, 3159 ν(C–H), 1608 ν(CN), 1579 ν(N–H)bending, 1521 ν(NO2)asym, 1372 ν(NO2)sym, 840 ν(CS). UV-Vis [λmax (nm) (ε, M−1 cm−1)] in MeOH: 236 (39840; π–π*), 349 (3510; n–π*). ESI-MS (m/z): 575.52 [Cu(L5)2Cl]+.
[Cu(L6)2Cl] (6). Yield: 0.52 g, (93.7%); colour: colourless; anal. calc. for: C18H20N6S2Cl3Cu (554.43); C, 38.99; H, 3.64; N, 15.16; found: C, 38.54; H, 3.71; N, 15.39%. Selected IR data (KBr, ν/cm−1): 3412 ν(N–H)asym, 3327 ν(N–H)sym, 3128 ν(C–H), 1605 ν(CN), 1598 ν(N–H)bending, 842 ν(CS). UV-Vis [λmax (nm) (ε, M−1 cm−1)] in MeOH: 229 (38210; π–π*), 354 (3680; n–π*). ESI-MS (m/z): 554.44 [Cu(L6)2Cl]+.
X-ray crystallography studies
X-ray diffraction intensity data of the ligand L4 was collected at room temperature (293 K) on a Bruker APEX 2 single crystal X-ray diffractometer equipped with graphite monochromatic Mo Kα (λ = 0.71073 Å) radiation and CCD detector. The crystal dimension of 0.25 × 0.19 × 0.04 mm3 was mounted on a glass fiber using cyanoacrylate adhesive. The unit cell parameters were determined from 36 frames measured (0.5° phi-scan) from three different crystallographic zones using the method of difference vectors. The intensity data were collected with an average four-fold redundancy per reflection and optimum resolution (0.75 Å). The intensity data collection, frames integration, Lorentz and polarization corrections and decay correction were carried out using SAINT-NT (version 7.06a) software.27 An empirical absorption correction (multi-scan) was performed using the SADABS program.27 The crystal structure was solved by direct methods using SHELXS-97 (ref. 28) and SHELXS-2014,29 and refined by full-matrix least-squares using SHELXL-2014, SHELXL-2016 (ref. 29) and Olex2.30 Molecular geometry was calculated using PARST programme.31 All non-hydrogen atoms were refined using anisotropic thermal parameters. The hydrogen atoms were included in the structure factor calculation at idealized positions using a riding model, but not refined. Images were created with the ORTEP-PLATON program.32,33
DNA/BSA binding, DNA cleavage and in silico studies
DNA/BSA binding, DNA cleavage and in silico studies of DNA and focal adhesion kinase (FAK) receptor were carried out by following the procedure reported in our earlier publications.34,35
In vitro and in vivo anti-proliferative studies
Lipophilicity, MTT assay, apoptosis, cell cycle, cellular uptake, ROS generation, Western blot and in vivo anticancer analyses were carried out by following the procedure reported in our earlier publications.36,37 The study protocol of the in vivo experiments was approved by the Institutional Animal Ethical Committee (IAEC) (No. SVCP/016/2015-16 dated 18-02-2016) and all the animal experiments were carried out in accordance with the guidelines of the Committee for the Purpose of Control and Supervision of Experiments in Animals (CPCSEA), India. For the determination of LD50, OECD guideline AOT 423 was followed.38
Results and discussion
Synthesis and characterization of bis(thiosemicarbazone)copper(I) complexes
A series of bis(thiosemicarbazone)copper(I) complexes of the type [Cu(L1–6)2Cl] (1–6) were synthesized in good yields and pure forms by the reaction of thiosemicarbazone ligands (L1–6) with CuCl2·2H2O in mole ratio of 2:1 (Scheme 1). The reaction may be promoted by the thione-thiol tautomerism of thiosemicarbazones,39,40 the thiol form possibly acting as the reductant. The possibility of redox reaction with Cu(II) salts affording the Cu(I) complexes is known for certain thiosemicarbazones.41 The synthesized complexes were characterized by elemental analysis, FT IR, UV-Vis, 1H NMR and ESI-MS spectral analysis. The structure of ligand L4 was confirmed by single crystal XRD technique.
 |
| | Scheme 1 Synthesis of thiosemicarbazone ligands (L1–6) and their copper(I) complexes (1–6). | |
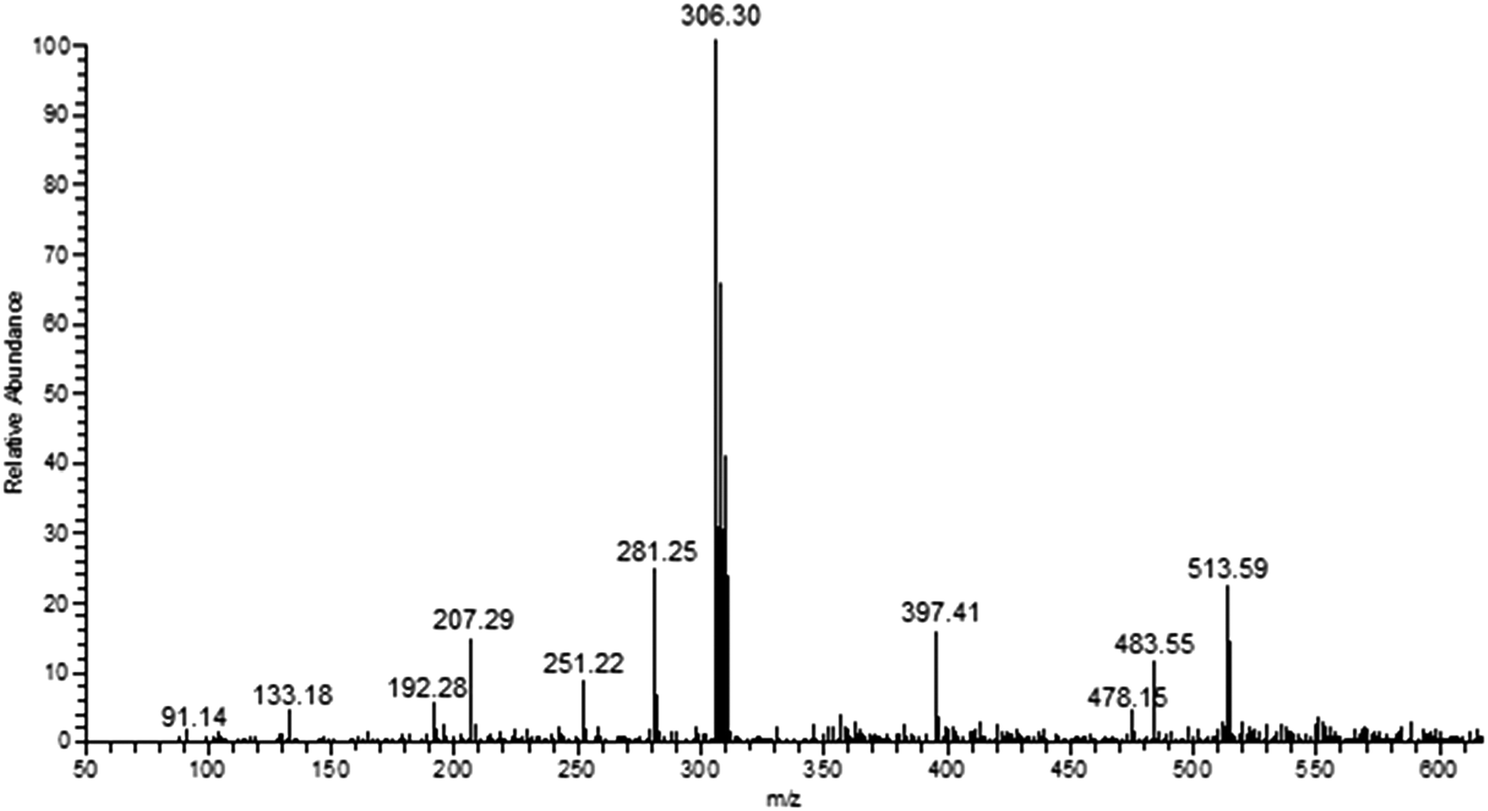
FT IR spectra provide valuable information regarding the formation of thiosemicarbazone ligands and their copper(I) complexes (Fig. S1†). The ligands (L1–6) exhibit characteristic bands in the range 3338–3324, 3167–3113, 1635–1608 and 865–839 cm−1 attributed to ν(N–H), ν(C–H), ν(CN) and ν(CS) stretching vibrations, respectively. The ligand L4 shows broad band at 3409 cm−1 corresponding to ν(O–H) stretching of phenolic group. All the complexes exhibit ν(CS) stretching vibration at 819–838 cm–1, which is lower than that of the free thiosemicarbazone ligands representing the coordination of the copper ion with the sulphur atoms. The formation and stoichiometric composition of the synthesized copper(I) complexes were established by ESI-MS mass spectra. The observed molecular ion peaks confirmed the proposed empirical molecular formulae. For example, complexes 1–6 show molecular ion peak at m/z 485.54, 513.59, 545.60, 517.54, 575.52 and 554.44 due to [Cu(L1−6)2Cl]+, respectively, which is corresponding to their molecular weight (Fig. 1 & S2–S4†). The base peak at m/z 292.24, 306.30, 322.30, 308.25, 337.28 and 326.72 corresponds to [Cu(L1–6)Cl]+, respectively. The observed mass spectral data confirmed the proposed molecular formulae of the synthesized copper(I) complexes. The electronic spectra, which give more information about the structural and geometrical properties of the complexes showed an intense absorption peak at 227–236 nm due to intra-ligand charge transfer transition (π–π*). The medium intense absorption band observed at 341–353 nm is attributed to LMCT or MLCT transition. The non-appearance of band over 400 nm are due to d10 electronic configuration of copper(I) complexes (Fig. S5†).
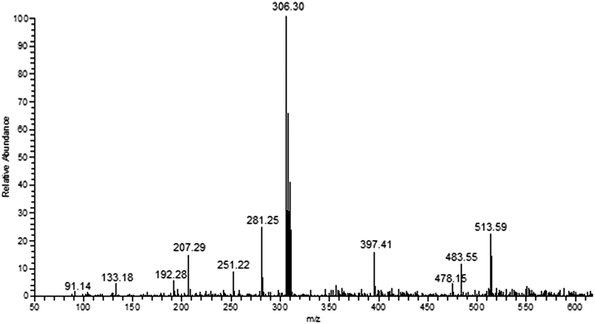 |
| | Fig. 1 ESI mass spectrum of complex 2. | |
The 1H NMR spectra of the ligands L1&2 and complexes 1 & 2 were recorded to authenticate the coordination of the thiosemicarbazone ligands to the copper(I) ion (Fig. S6 & S7†). The ligands L1&2 showed singlet signal at 2.36 and 2.31 ppm, respectively, corresponding to methyl (CH3) protons. The multiplets observed in the region 7.17–7.86 ppm for the ligands L1&2 have been assigned to the aromatic protons of thiosemicarbazone moiety. The signal positions of methyl and aromatic protons were observed at almost same positions without any appreciable shifts for the complexes. The NH2 protons of ligands L1&2 observed at 8.47 and 8.28 ppm, respectively, with a downfield shift for complexes 1 and 2 (δ = 8.99 and 8.94 ppm). The NH proton of ligands L1&2 observed at δ = 10.30 and 10.20 ppm, respectively, with upfield shift for complexes 1 and 2 (δ = 9.69 and 9.74 ppm). The observed NMR data gave additional information about the structure of the ligands as well as complexes.
Structural description of ligand L4
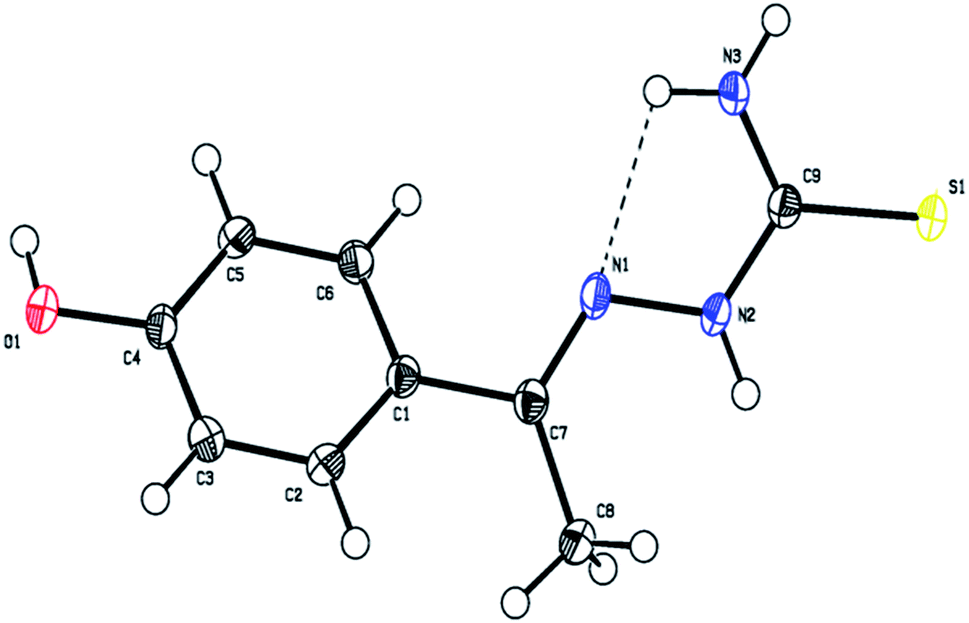
The ligand L4 crystallizes in the triclinic P![[1 with combining macron]](https://www.rsc.org/images/entities/char_0031_0304.gif) space group with two molecules in the unit cell (a = 6.885(3), b = 7.108(3) and c = 11.230(4) Å; α = 74.336(4), β = 76.662(4), γ = 73.802(4)° and Z = 2). The crystal data and structure refinement parameters are listed in Table S1.† The three dimensional molecular structure of this ligand was determined by X-ray crystallography using SHELXS-97/SHELXS-2014 and refined by full-matrix least-squares using SHELXL-2016/Olex2 to a final R-values of 0.0382.
space group with two molecules in the unit cell (a = 6.885(3), b = 7.108(3) and c = 11.230(4) Å; α = 74.336(4), β = 76.662(4), γ = 73.802(4)° and Z = 2). The crystal data and structure refinement parameters are listed in Table S1.† The three dimensional molecular structure of this ligand was determined by X-ray crystallography using SHELXS-97/SHELXS-2014 and refined by full-matrix least-squares using SHELXL-2016/Olex2 to a final R-values of 0.0382.
The molecular structure of the ligand L4 is shown in Fig. 2, and the selected bond lengths and bond angles are listed in Table S2.† In the crystal structure, the phenyl ring is fused with the thiosemicarbazone moiety. The phenyl ring and thiosemicarbazone moiety lie in a plane, which is evidenced by the torsion angle value C1–C7–N1–N2 = −176.7°. The thiosemicarbazone moiety with an extended conformation can be seen from the torsion angle values C7–N1–N2–C9 = −167.6° and N1–N2–C9–S1 = −174.1°. The best plane passing through the thiosemicarbazone group makes a dihedral angle of 43.63(1)° with the phenyl ring. The methyl group (C8) is oriented syn-periplanar to C2 [C2–C1–C7–C8 = 28.1°] and anti-periplanar to C6 [C6–C1–C7–C8 = −151.6°]. The O1 atom deviates from the phenyl ring by −0.043(1) Å. The details of hydrogen bonding of ligand L4 is given in Table S3.† The ligand L4 has N3–H3⋯N1 intramolecular hydrogen bonds forming an S(5) ring motifs as shown in Fig. 2. In the crystal structure of L4, the N3–H3B⋯S1 intermolecular interactions generating R22(8) ring motif, N2–H2⋯S1 intermolecular interactions forming R22(8) ring motif, and C8–H8A⋯S1 & N2–H2⋯S1 interactions constitute a pair of bifurcated acceptor bonds generating R21(7) ring motif viewed down 'b' axis as shown in Fig. S8a.† The S1 atom is involved in well defined trifurcated acceptor hydrogen bonds with the N2–H2⋯S1, N3–H3B⋯S1 and C8–H8A⋯S1 as shown in Fig. S8a.† The N3–H3A⋯O1 intermolecular interaction generating R22(22) ring motif viewed down 'a' axis as shown in Fig. S8b.† The intermolecular O1–H1⋯S1 hydrogen bonds forming a C(11) chain running along c axis as shown in Fig. S8c.† The two molecules are also held together by π–π interaction with the distance 3.8108(2) Å between the centroids of two adjacent 4-hydroxybenzene rings (symmetry code is Cg1 = 1 − x, 1 − y, 1 − z) as shown in Fig. S8d.†
 |
| | Fig. 2 The molecular structure of the ligand L4 showing the atom labelling scheme. The displacement ellipsoids are drawn at 50% probability level. | |
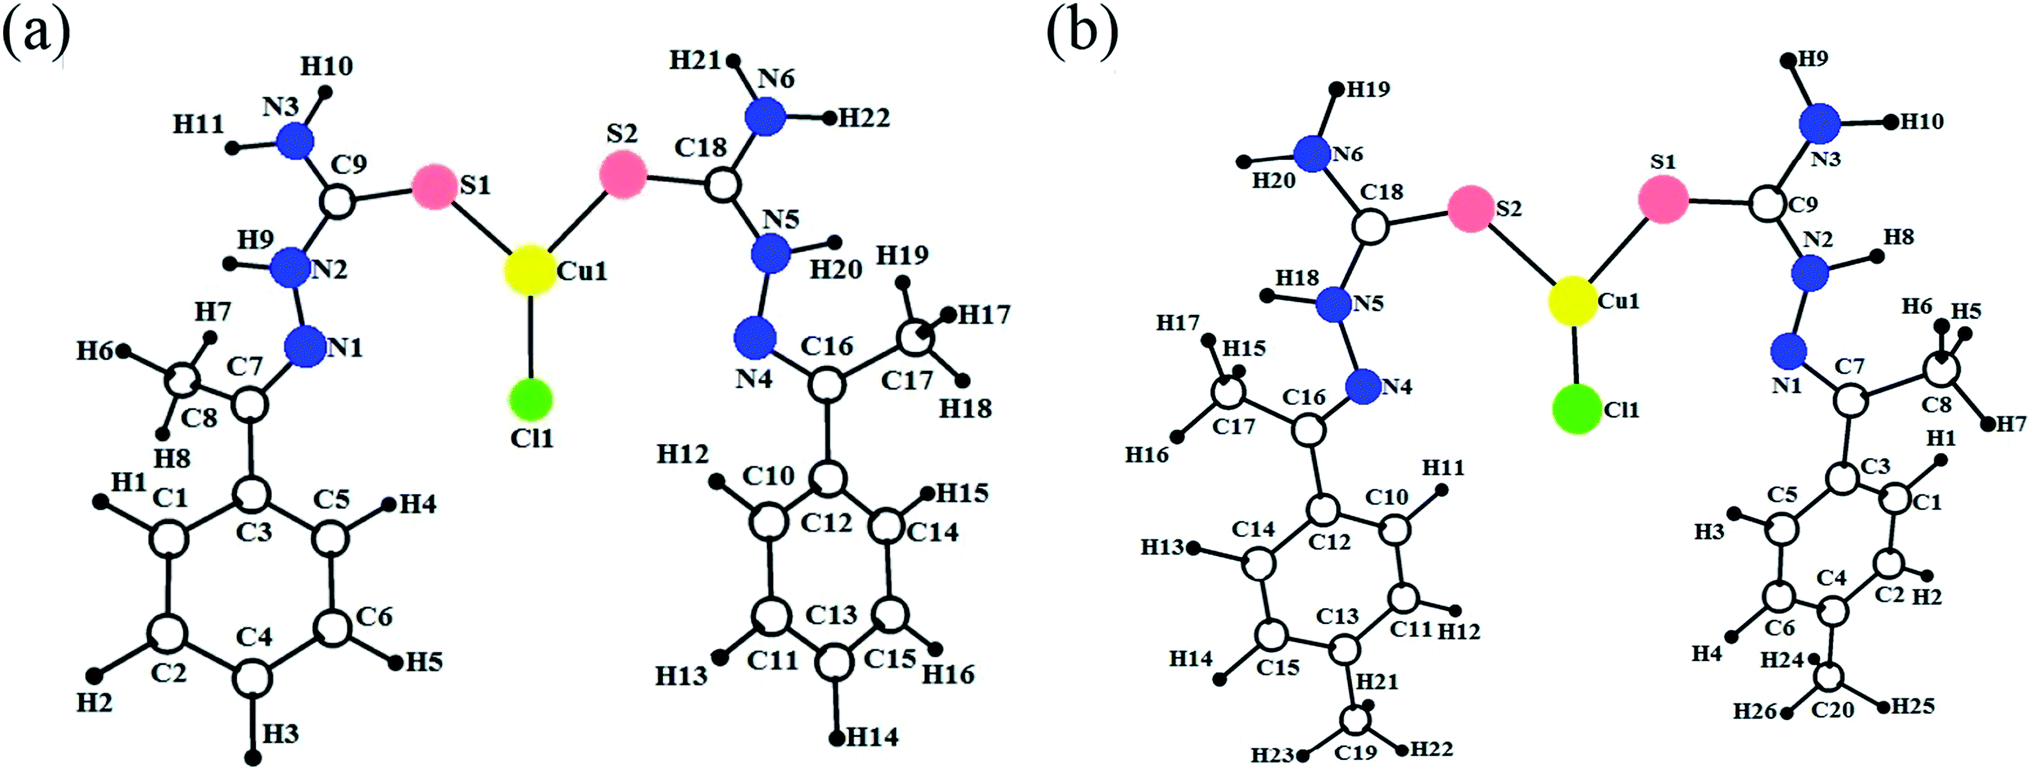
Geometry optimization
The DFT calculation gives more suitable information about structural features, in the absence of crystal data, in addition to the energy minimized conformation, such as coordination behaviour in metal complexes and HOMO–LUMO energy gap.35 Hereby, all the synthesized copper(I) complexes (1–6) were optimized at B3LYP/GEN and B3LYP/LANL2DZ levels in gas phase and the optimized ground state geometry structures are shown in Fig. 3. The calculated bond lengths and bond angles of the complexes are given in Table S4† along with the reported experimental values.15,16 The calculated values of bond length/angles obtained by using B3LYP/LANL2DZ level are more appropriate than the B3LYP/GEN level. Therefore, DFT/B3LYP/LANL2DZ level was preferred to B3LYP/GEN level for determining the molecular structure. The three coordinated Cu(I) complexes (1–6), coordinate through two sulphur and one chlorine atom. The observed Cu–S bond length values (Cu–S1 = 2.210–2.219 Å; Cu–S2 = 2.219–2.236 Å) and the Cu–Cl bond length values (2.301–2.312 Å) of the complexes are more consistent with the previously reported work.15 It has been noticed that many bond lengths and bond angles obtained from the optimized structures were fitted with the experimentally observed data with a slight differences. The differences in calculated and experimental bond length values of Cu–S1, Cu–S2 and Cu–Cl are found in the range 0.001–0.008. The difference in calculated and experimental bond angles of (S2)–Cu1–(S1), (S2)–Cu1–(Cl1) and (S1)–Cu1–(Cl1) are found in the range 0.17–2.34. The negligible differences were observed between the calculated and experimental bond length and bond angles values. The B3LYP method in combination with the LANL2DZ basis gives an excellent estimation of Cu–S and Cu–Cl bond distances (Cu–S1, Cu–S2 and Cu–Cl).
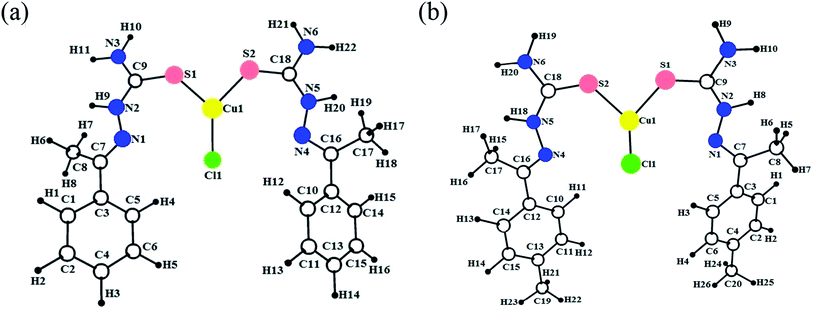 |
| | Fig. 3 Optimized geometries of the copper(I) complexes 1 (a) and 2 (b). | |
Biological significance
Stability. Generally, the stability is an important test for approval of any pharmaceutical product. In this regard, the stability of copper(I) complexes were studied in DMSO solution over various time intervals during 24, 48 and 72 h utilizing a kinetic program on a UV-Vis spectroscopy (Fig. S9†). The UV-Vis spectra was recorded directly after dilution of the complexes did not show any differences after 24 and 48 h, while the 72 h samples show negligible differences. This proves that the complexes are stable in aqueous buffer solution, in addition to mass spectral analysis.
Lipophilicity. Lipophilicity is one of the most important factors in pharmaceutical research and a key determinant of the pharmacokinetic properties of a drug and its interaction with macromolecular targets.42 The relationship between drug lipophilicity and the effect of metal complexes against cancer cell lines has been reported in literature.43 Generally, the alteration of lipophilicity may achieve larger selectivity for cancer cells.44 The anticancer activity of efficient platinum-based anticancer drugs (cisplatin, carboplatin, oxaliplatin etc.) strongly depends on their lipophilicity. In this connection, we have determined the partition coefficients (P) between n-octanol and water phases for the synthesized copper(I) complexes by the shake-flask method.45 All the complexes show reasonable lipophilicity with logP values between 0.76 ± 34 and 1.43 ± 11, which means higher solubility of complexes in n-octanol (lipophilic phase) than in water (hydrophilic phase). The observed lipophilicity values are higher than those for the previously reported Ag(I), Au(I), Ru(II), Ga(III) and Pt(II) complexes.46–49
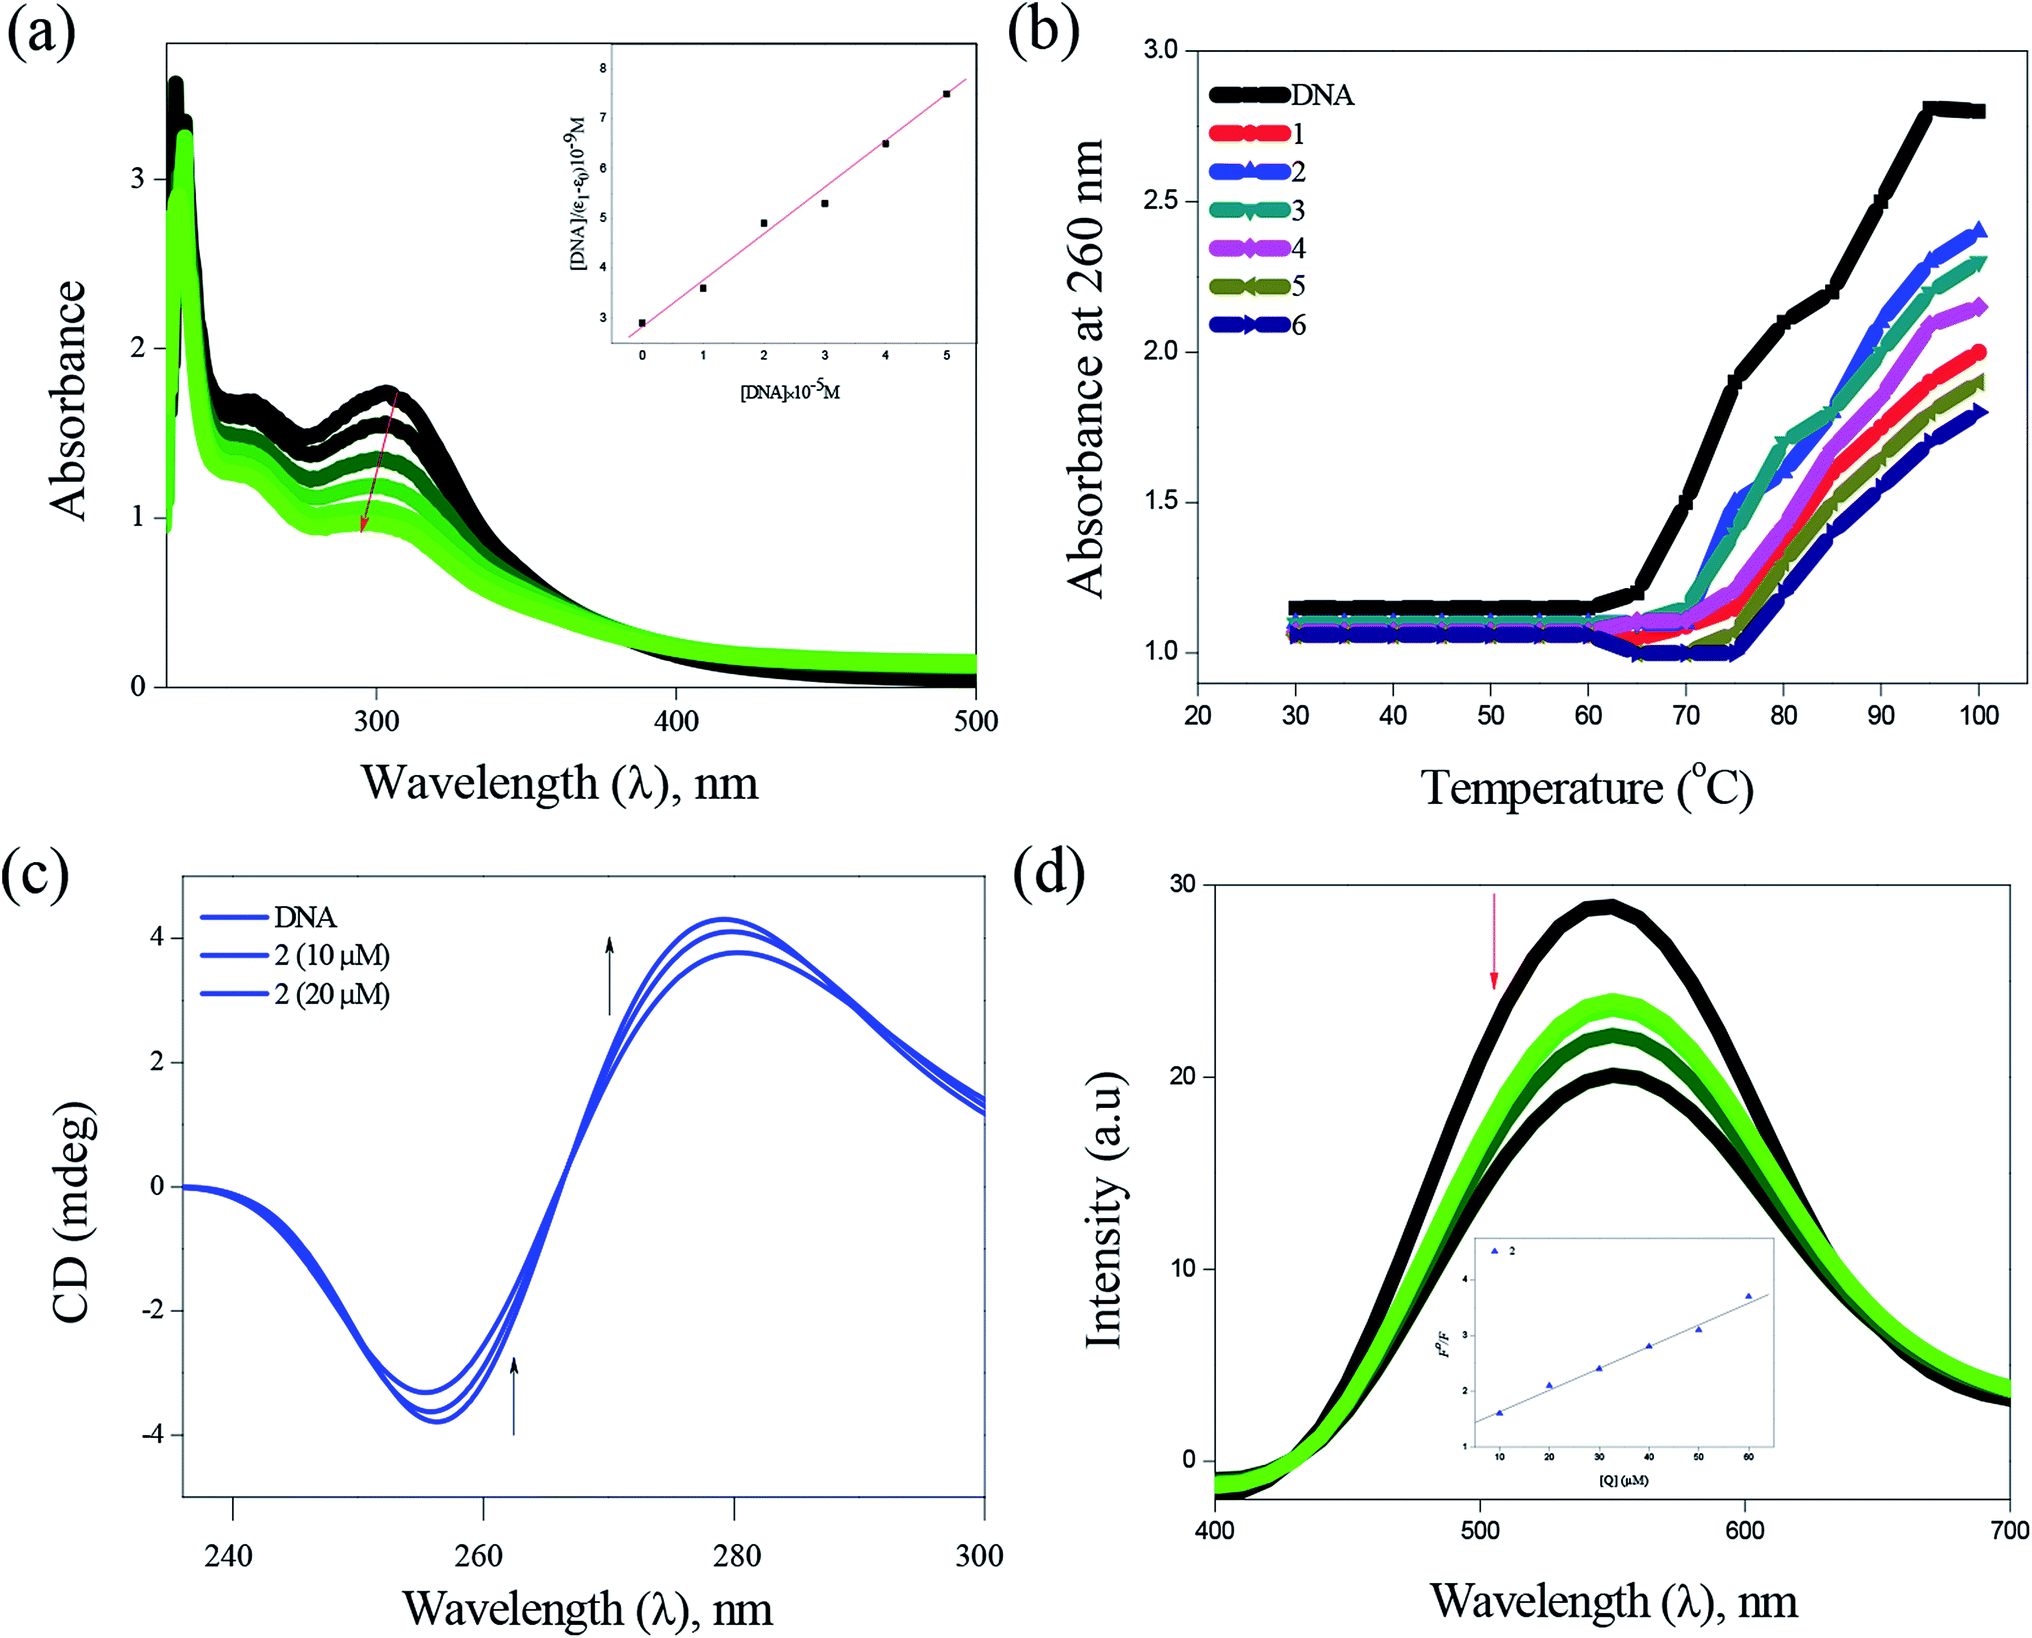
DNA binding. Electronic absorption spectra of complexes (1–6) with varying amount of CT-DNA solution showed hypochromic effect in the intra-ligand (n–π*) region with a significant red shift (4–6 nm), indicating the strong intercalative mode of binding of the complexes with DNA (Fig. 4). The intrinsic binding constant values for these complexes were calculated and found to be in the range between (2.81 ± 0.79) × 105 M−1 and (6.01 ± 0.48) × 105 M−1 (Table 1). The presence of methyl substituent in the complex 2 is accountable for more hypochromism, hydrophobic contacts and π–π stacking of the DNA bases, demonstrating its higher interaction when compared to other complexes. Thermal denaturation studies (Fig. 4) carried out at the wavelength of 260 nm revealed the increase in ΔTm (5.5–8.9 °C) values, which also confirm the intercalative binding mode of complexes with CT-DNA (Table 1). In the CD spectra, the addition of complexes to CT-DNA showed the increase in the intensities of both the positive and negative bands with a shift of ∼5 nm in the positive band and a shift of ∼3 nm in the negative band (Fig. 4). These results further prove the intercalative binding of complexes with CT-DNA. In order to further investigate the binding mode of complexes with DNA, competitive ethidium bromide (EB) quenching studies was carried out, in which a decrease in the fluorescence intensity was observed (Fig. 4). The quenching of EB bound to DNA by the complexes is in good agreement with the linear Stern–Volmer equation. The observed Kapp values of the complexes (1–6) are in the range between (1.1 ± 1.04) × 105 M−1 and (3.0 ± 0.52) × 105 M−1 (Table 1). In addition to the experimental DNA binding studies, in order to substantiate the intercalative binding mode, the molecular docking study was also performed (Table S5†). All the complexes showed π–π stacking interaction formed between phenyl ring present in the thiosemicarbazone and base pairs (adenine & guanine), in which the distances from the centroid of intercalative ligand to the planes of neighboring base pairs are in the range between 3.5 to 3.8 Å (Fig. S10†). The energy minimized structures also suggest that the complexes interact with DNA via an intercalation mode involving outside edge stacking interaction with the oxygen atom of the phosphate backbone and the A–T rich region stabilized by van der Waals interactions and hydrophobic contacts.34
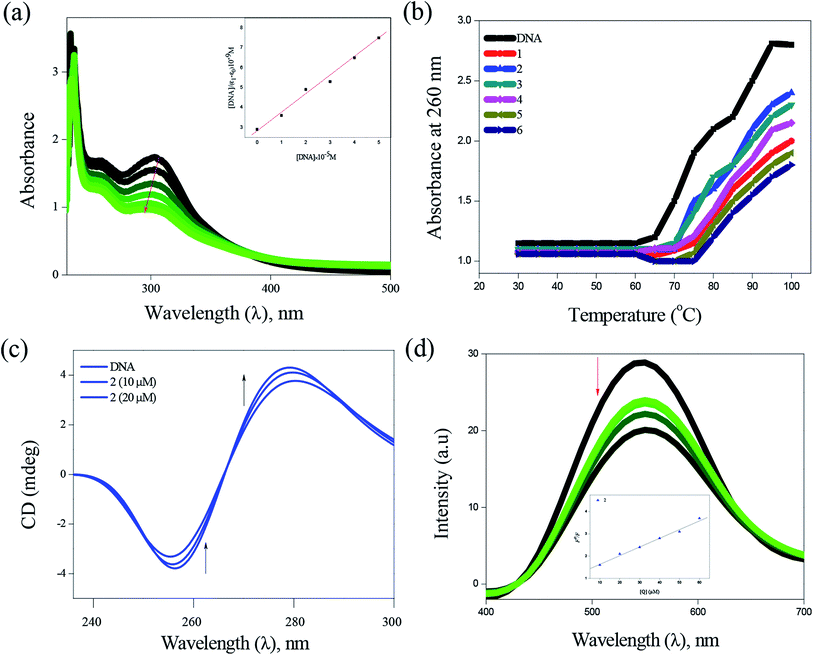 |
| | Fig. 4 DNA binding of complexes with CT-DNA: absorption spectra of complex 2 (a), thermal denaturation of complexes 1–6 (b), CD spectra of 2 (c) and emission spectra of complex 2 (d). | |
Table 1 DNA-binding constant (Kb), thermal denaturation Tm (°C), DNA-apparent binding constant (Kapp), BSA-quenching constant (Kq), BSA-binding constant (Kbin) and number of binding sites (n) of the bis(thiosemicarbazone)copper(I) complexes (1–6)
| Complexes |
Kb × 105 (M−1) |
Tm (°C) |
Kapp × 105 (M−1) |
Kq × 105 (M−1) |
Kbin × 105 (M−1) |
‘n’ value |
| 1 |
4.91 ± 0.11 |
68.7 ± 0.82 |
2.3 ± 0.16 |
2.87 ± 1.12 |
2.33 ± 0.18 |
1.31 |
| 2 |
6.01 ± 0.48 |
69.9 ± 0.11 |
3.0 ± 0.52 |
3.48 ± 1.13 |
3.28 ± 1.32 |
1.75 |
| 3 |
5.93 ± 0.12 |
69.7 ± 0.19 |
2.9 ± 0.57 |
3.36 ± 0.22 |
3.17 ± 0.91 |
1.64 |
| 4 |
5.42 ± 0.65 |
69.1 ± 0.31 |
2.6 ± 1.02 |
3.11 ± 0.48 |
2.79 ± 0.75 |
1.48 |
| 5 |
4.44 ± 0.27 |
68.1 ± 0.16 |
1.4 ± 1.18 |
2.49 ± 0.74 |
2.13 ± 0.88 |
1.21 |
| 6 |
2.81 ± 0.79 |
66.5 ± 0.19 |
1.1 ± 1.04 |
2.06 ± 0.97 |
1.54 ± 0.52 |
1.09 |
| Cisplatin |
0.32 ± 0.15 |
— |
— |
— |
— |
— |
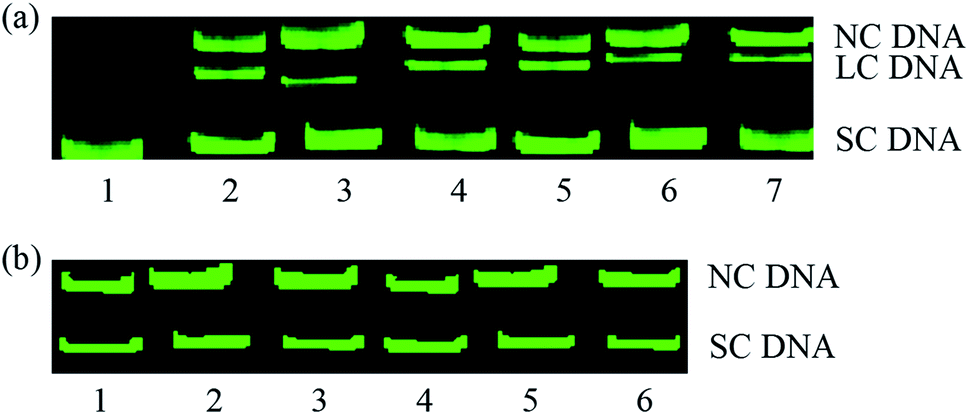
Hydrolytic cleavage by gel electrophoresis. All the complexes (1–6) cleave pBR322 DNA in the absence of any coreagent (viz., reductant or oxidant), the conversion of SC DNA to NC and LC form was achieved at 25 μM by 2 (90%), while only 49, 73, 62, 46 and 38% conversion were observed for complexes 1 and 3–6, respectively, at the same concentration (Fig. 5a). These data confirmed that the complexes were able to convert the supercoiled form to the nicked circular and linear circular forms of DNA without any additives, and were capable of promoting hydrolytic cleavage of DNA. To further confirm the hydrolytic nature of the scission process, we have also conducted additional cleavage experiments by using T4 ligase enzymatic assay, and the results show the relegation of nicked circular to supercoiled form (Fig. 5b).
 |
| | Fig. 5 Hydrolytic cleavage of complexes (1–6) on pBR322 DNA (33.3 μM) in Tris–HCl/NaCl buffer. Lane 1, DNA alone, lane 2–7, DNA + 1–6 (25 μM) (a). Analysis of the capacity of T4 DNA ligase to relegate DNA cleaved by complexes 1–6. Lane 1–6, NC obtained using complexes 1–6 + T4 ligase (b). | |
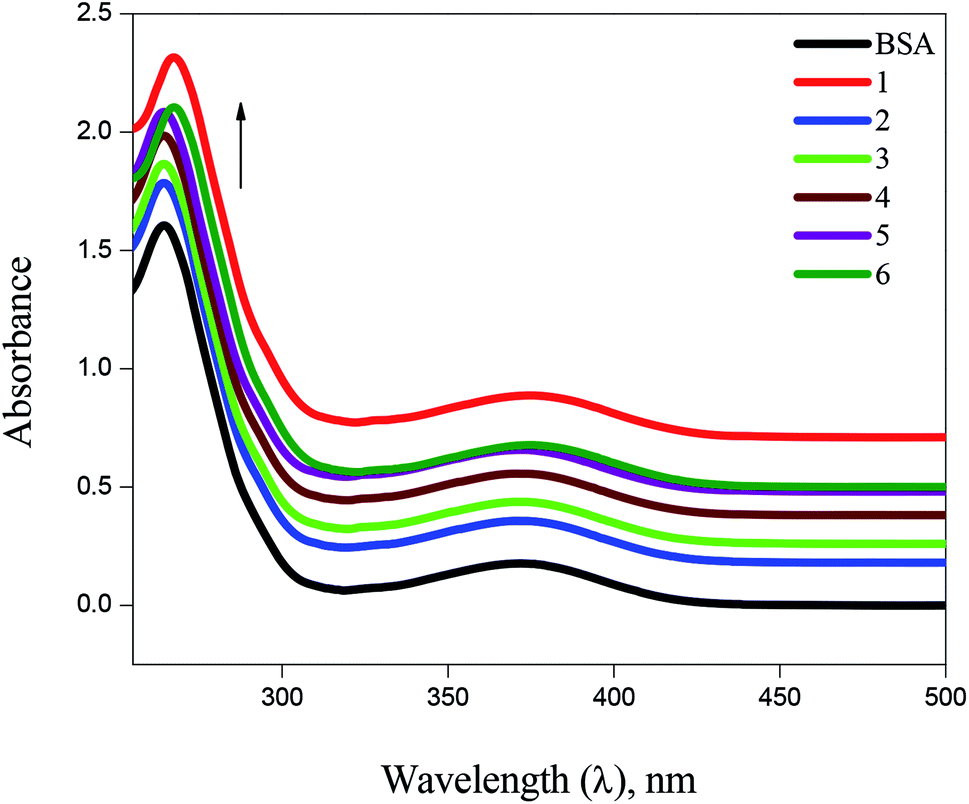
BSA binding. UV-Vis absorption spectroscopy has proved to be an efficient tool in the investigation of interaction of complexes with BSA. The absorption intensity of BSA at 282 nm increases after the addition of copper(I) complexes with a small red shift due to the formation of ground state complexes of the type BSA-complex, which confirm the static interaction between complexes and the BSA (Fig. 6). Further, the binding phenomena was analysed by considering changes in molecular environment in the vicinity of fluorophore in the absence and presence of the complexes using fluorescence spectra (Fig. 7). Upon addition of complexes (1–6) to BSA, there is a considerable decrease in the fluorescence intensity of BSA at 348 nm with 63, 84, 76, 69, 58 and 53% accompanied by a blue shift of 5, 9, 7, 6, 4 and 3 nm, respectively. The significant decrease in fluorescence intensity with blue shift shows the interaction between the complexes and BSA. The quenching constant (Kq), binding constant (Kbin) and number of binding sites (n) was determined using Stern–Volmer and Scatchard equations (Table 1). The values of Kbin, Kq and n obtained for the binding of BSA to the copper(I) complexes are in the range from (2.06 ± 0.97) × 105 M−1 to (3.48 ± 1.13) × 105 M−1, from (1.54 ± 0.52) × 105 M−1 to (3.28 ± 1.32) × 105 M−1, and from 1.09 to 1.75, respectively. The higher values of Kbin and Kq indicate the significant interaction between the BSA and the complexes. The higher protein-binding affinity of complex 2 is due to the enhanced hydrophobicity provided by the methyl substituent present in the ligand.
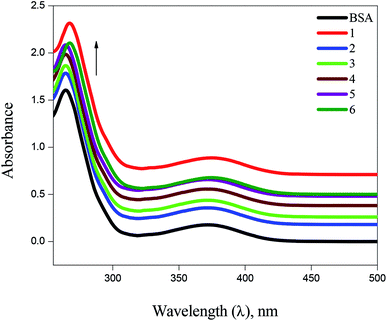 |
| | Fig. 6 Absorbance titrations of the complexes (1–6) with BSA. | |
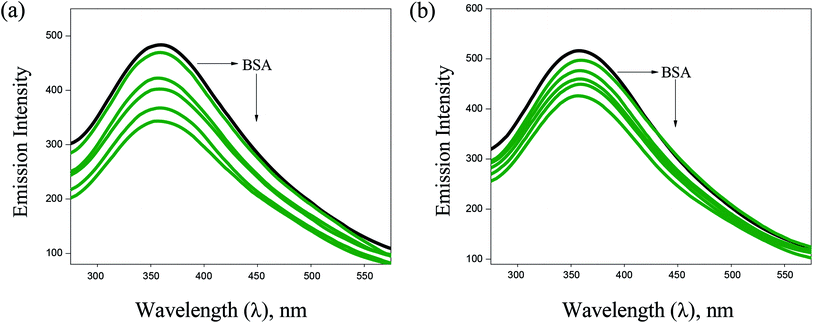 |
| | Fig. 7 Fluorescence spectra of BSA (10 μM, λex = 280 nm, λem = 570 nm) in the presence of increasing concentrations of 2 (a) and 3 (b). Arrow shows that the emission intensity changes upon increasing the concentration of the complexes. | |
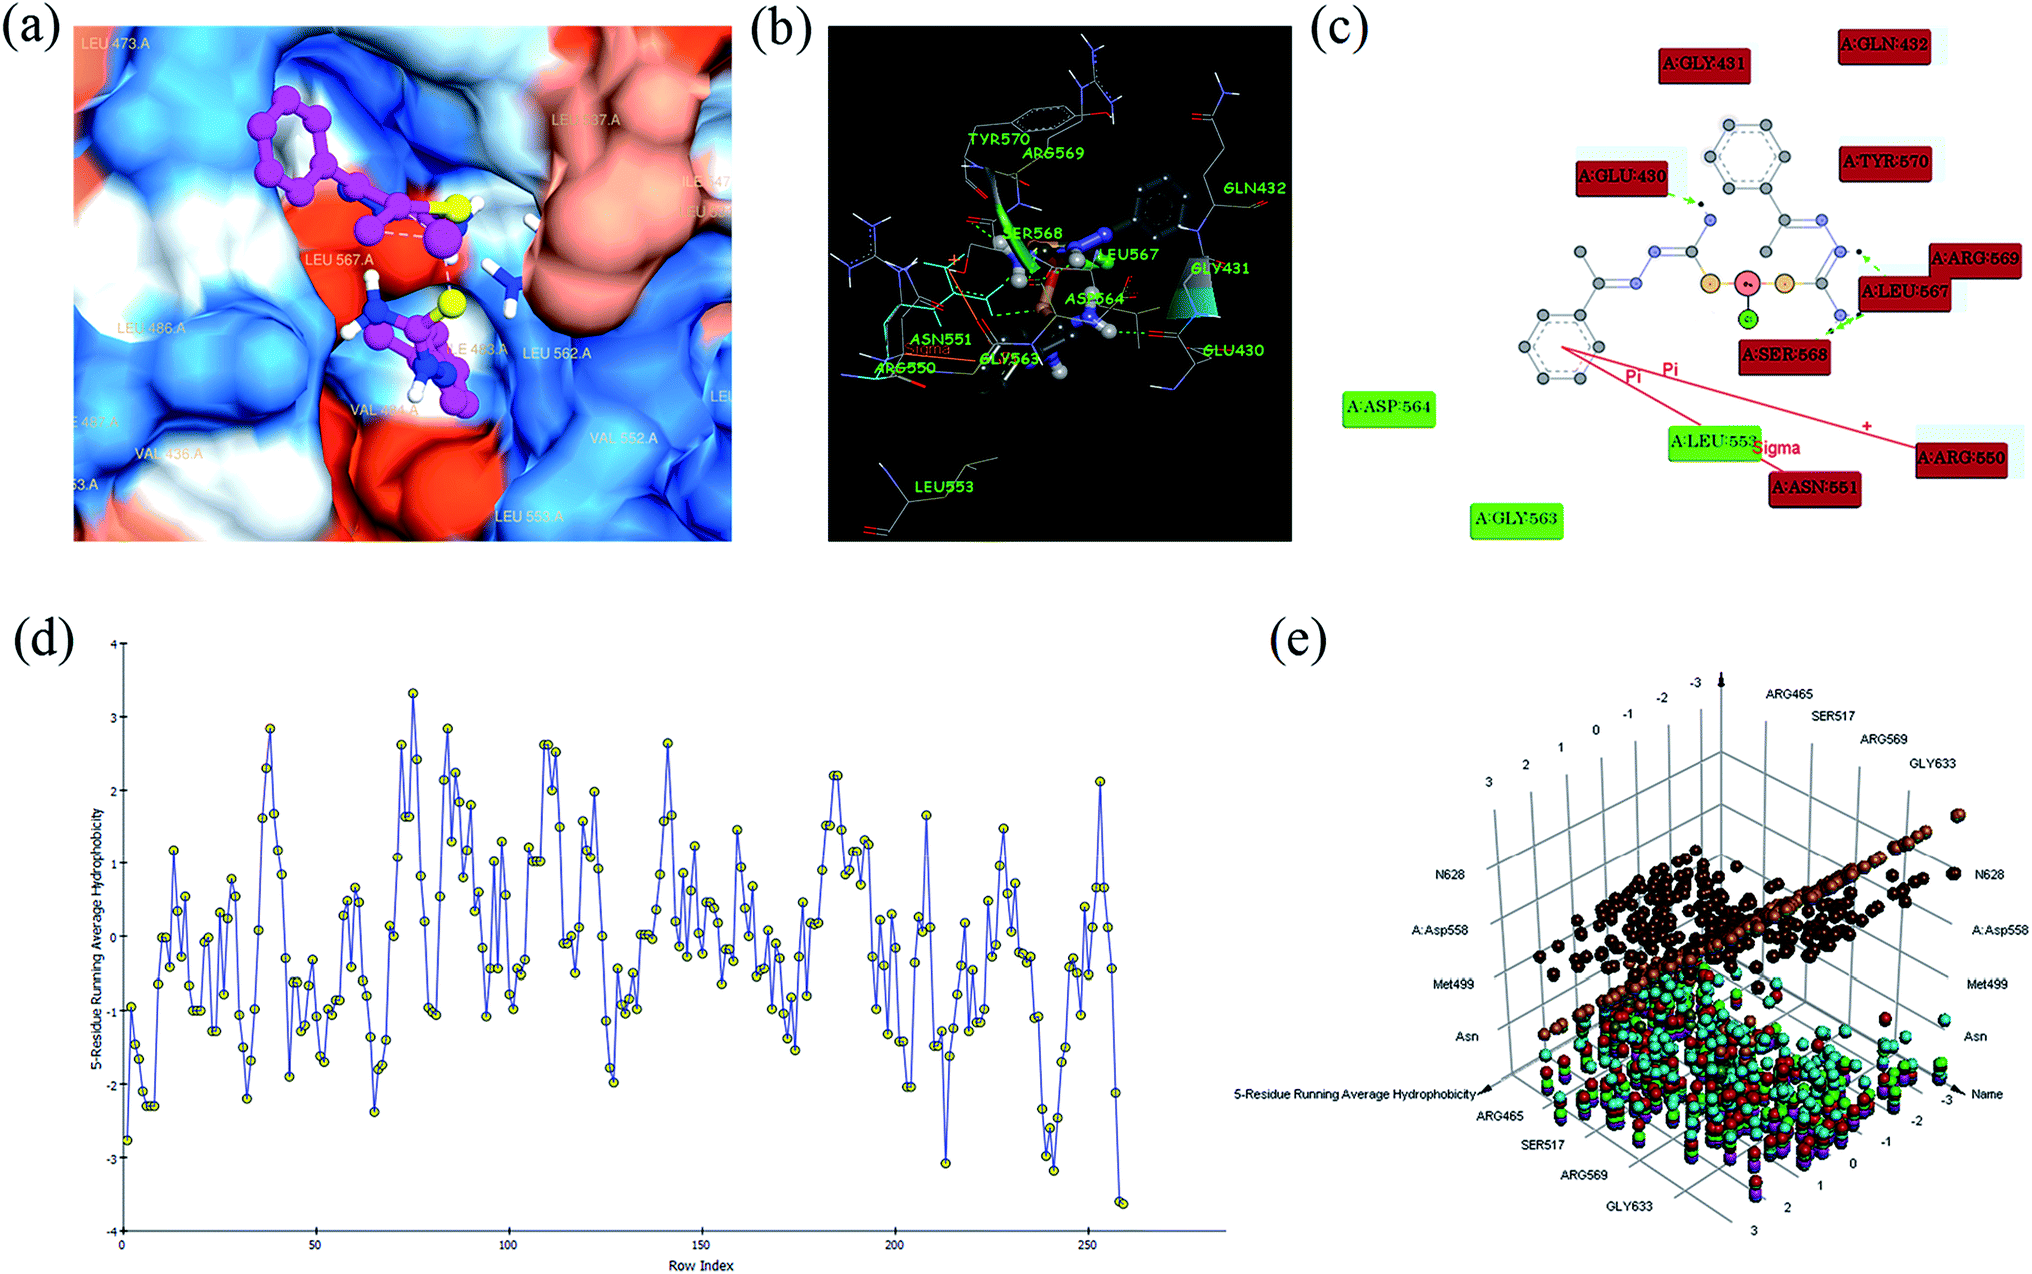
In silico studies. Focal adhesion kinase (FAK) is a protein tyrosine kinase, which is able to mediate signal transduction from extracellular matrix (ECM) to cells. FAK is also involved in cell proliferation, survival, motility, and invasion via interaction with integrin and growth factor receptors.50,51 Many evidences shows FAK as an important molecule conferring chemotherapeutic resistance to pancreatic cancers, and resistance is conferred by enhancing anti-apoptotic properties in cancer cells.52,53 Recently, variety of specific inhibitors of FAK has been developed.54 The action of FAK and signalling from growth-factor receptors might control the altered growth of tumour cells as well as their responses to autocrine or paracrine factors. Further, FAK influences the dynamic regulation of integrin associated adhesions, and the actin cytoskeleton that is tethered there, through diverse molecular interactions. Based on the above reasons, we have been interested in in silico studies using FAK receptor with complexes.All the complexes (1–6) are located in the hydrophobic cavities in subdomains II and the binding score are listed in Table S6.† All the complexes were strongly interact with FAK via π–π, σ–π, hydrogen bonding, electrostatic and van der Waals interactions (Fig. 8). The complex 1 shows one π–π interaction formed between the phenyl ring and ARG 550 (bond length: 3.6 Å), which also shows one σ–π interaction formed between phenyl ring and ASN 551 (bond length: 3.3 Å). This complex was stabilized by four hydrogen bonding interaction, first one was formed between oxygen atom of GLU 430 and hydrogen atom (–NH) of the ligand (bond length: O⋯H = 3.4 Å), second one was formed between oxygen atom of LEU 567 and hydrogen atom (–NH) of the ligand (bond length: O⋯H = 4.0 Å), third one was formed between oxygen atom of SER 568 and hydrogen atom of –NH2 group present in the ligand (bond length: O⋯H = 3.2 Å), and fourth one was formed between oxygen atom of LEU 567 and hydrogen atom of –NH2 group present in the ligand (bond length: O⋯H = 4.1 Å). Besides, the binding model was enhanced by electrostatic interaction formed between the complex and the residues GLU 430, GLY 431, GLN 432, ARG 550, ASN 551, LEU 567, SER 568, ARG 569 and TYR 570, and van der Waals interaction formed between the complex and the residues LEU 553, GLY 563 and ASP 564 of FAK kinase receptor.
 |
| | Fig. 8 Molecular docking view of complex 1: complex located in hydrophobic packet (subdomains II) (a), 3D interaction (b), 2D interaction (c), hydrophobic interaction plot (d), and 3D interaction plot of residue count (e), with focal adhesion kinase (FAK) receptor. | |
The complex 2 was stabilized by two hydrogen bonding interactions, first one was formed between hydrogen atom of GLU 430 and nitrogen atom (–N) of the ligand (bond length: H⋯N = 3.6 Å), and second one was formed between hydrogen atom of GLU 430 and nitrogen atom (–N) of the ligand (bond length: H⋯N = 3.7 Å). Besides, the binding model was enhanced by electrostatic interaction formed between this complex and residues GLU 430, ARG550, LEU 567 and ARG 569, and van der Waals interaction formed between the complex and the residues GLY 431, GLN 432, PHE 433, VAL 436, ALA 452, GLU 471, GLU 500, CYS 502, LEU 553 and GLY 566 of FAK kinase receptor.
The complex 3 shows one π–π interaction formed between the 4-methoxybenzene ring and ARG 550 (bond length: 3.7 Å), which is also stabilized by three hydrogen bonding interactions, first one was formed between hydrogen atom of ASP 564 and oxygen atom of methoxy group present in the ligand (bond length: H⋯O = 3.8 Å), second one was formed between hydrogen atom of GLU 430 and nitrogen atom (–NH) of the ligand (bond length: H⋯N = 4.1 Å), and third one was formed between oxygen atom of LUE 567 and hydrogen atom (–NH) of the ligand (bond length: O⋯H = 4.0 Å). Besides, the binding model was enhanced by electrostatic interaction formed between this complex and residues GLU 430, GLN 432, ASN 551, ASP 564, LEU 567, ARG 569, TYR 570 and MET 571, and van der Waals interaction formed between the complex and the residues GLY 431, GLU 506, LEU 553, GLY 563 and GLY 566 with FAK kinase receptor.
The complex 4 shows one π–π interaction formed between the 4-hydroxybenzene ring and ARG 550 (bond length: 3.6 Å), which is also stabilized by four hydrogen bonding interaction, first one was formed between hydrogen atom of ARG 569 and oxygen atom of 4-hydroxybenzene ring of the ligand (bond length: H⋯O = 3.2 Å), second one was formed between oxygen atom of GLY 566 and hydrogen atom (–OH) of the ligand (bond length: O⋯H = 3.9 Å), third one was formed between oxygen atom of ARG 550 and hydrogen atom of –NH2 group present in the ligand (bond length: O⋯H = 3.7 Å), and forth one was formed between oxygen atom of LEU 500 and hydrogen atom (–OH) of the ligand (bond length: O⋯H = 2.9 Å). Besides, the binding model was enhanced by electrostatic interaction formed between complex and residues GLN 432, GLU 471, GLU 500, LEU 501, CYS 502, ARG 550, ASN 551, GLY 566, LEU 567 and ARG 569, and van der Waals interaction formed between by complex and residues ILE 428, GLU 430, GLY 431, ALA 452, TYR 570, MET 571, VAL 484, MET 499, LEU 553 and ASP 564 with FAK kinase receptor.
The complex 5 shows one π–π interaction formed between the 4-nitrobenzene ring and ARG 550 (bond length: 3.7 Å), which also shows one σ–π interaction formed between 4-nitrobenzene ring and LEU 567 (bond length: 3.5 Å). This complex was stabilized by six hydrogen bonding interaction, first one was formed between hydrogen atom of ARG 569 and oxygen atom of –NO2 group present in the ligand (bond length: H⋯O = 3.1 Å), second one was formed between hydrogen atom of ARG 569 and nitrogen atom of –NO2 group present in the ligand (bond length: H⋯N = 3.0 Å), third one was formed between hydrogen atom of ARG 569 and oxygen atom of –NO2 group present in the ligand (bond length: H⋯O = 3.4 Å), fourth one was formed between hydrogen atom of ASP 564 and oxygen atom of –NO2 group present in the ligand (bond length: H⋯O = 3.9 Å), fifth one was formed between oxygen atom of ARG 550 and hydrogen atom of –NH2 group present in the ligand (bond length: O⋯H = 3.7 Å), and sixth one was formed between hydrogen atom of GLU 430 and nitrogen atom of –NH group present in the ligand (bond length: H⋯N = 5.3 Å). Besides, the binding model was enhanced by electrostatic interaction formed between the complex and the residues GLU 430, GLN 432, GLU 506, ARG 550, ASN 551, ASP 564, GLY 566, LEU 567, ARG 569 and TYR 570, and van der Waals interaction formed between the complex and the residues GLY 431, VAL 484, LEU 553, GLY 563 and MET 571 with FAK kinase receptor.
The complex 6 shows one π–π interaction formed between the 4-chlorobenzene ring and ARG 550 (bond length: 3.6 Å), which is also stabilized by one hydrogen bonding interaction formed between oxygen atom of GLU 506 and hydrogen atom of –NH2 group present in the ligand (bond length: H⋯O = 4.1 Å). Besides, the binding model was enhanced by electrostatic interaction formed between this complex and residues GLU 430, GLN 432, ASP 564, LEU 567, ARG 569 and TYR 570, and van der Waals interaction formed between the complex and the residues GLY 431, MET 499, GLU 506, LEU 553 and MET 571 with FAK kinase receptor.
The results demonstrate FAK kinase receptor as the potent inhibitor for all the complexes, because all the complexes (1–6) were retained strongly by the binding pocket of FAK. Among the complexes, the complex 2 binds to FAK stronger than the other complexes, which is consistent with the experimental DNA/BSA binding studies. The obtained results of in silico studies indicated that the interaction between complexes and FAK was dominated by electrostatic, van der Waals, hydrogen bonding, π–π and σ–π interactions.
In vitro anti-proliferative activity. The results obtained from lipophilicity, DNA/BSA binding, DNA cleavage and in silico studies prompted us to explore the in vitro anti-proliferative activity of the synthesized bis(thiosemicarbazone)copper(I) complexes.
MTT assay. In vitro anti-proliferative activity of the complexes (1–6) against four cancer cell lines namely human breast adenocarcinoma (MCF-7), cervical (HeLa), epithelioma (Hep-2) and Ehrlich ascites carcinoma (EAC), and two normal cell lines such as normal human dermal fibroblasts (NHDF) and L6 myotubes were tested by MTT assay with respect to standard anticancer drug cisplatin. The observed anti-proliferative potency of the complexes was dose dependent, that is, the cell viability decreased with increasing concentrations and the determined IC50 values are listed in Table 2. The IC50 values revealed that the synthesized complexes are less toxic against normal cells (NHDF and L6) and highly toxic against cancer cells. All the complexes effectively kill EAC cancer cell line compared to other cell lines. The complexes 2 and 3 showed significant anti-proliferative activity compared to cisplatin against all the tested cell lines. The complex 4 also showed significant anti-proliferative activity against Hep-2 and EAC cell lines and moderate activity against MCF-7 and HeLa cell lines with respect to cisplatin. The complexes 2 and 3 showed significant p values (p < 0.001 and 0.01) when compared to metal-based anticancer drug cisplatin. Similarly, such complexes showed significant p values (p < 0.05 and 0.01) when compared to other complexes. The obtained results are consistent with the results observed from DNA/BSA binding, DNA cleavage and in silico studies. In addition, the obtained anti-proliferative activity can also be correlated to lipophilicity, the complexes 2 and 3 observed more hydrophobic values compared to other complexes. This hydrophobicity of complexes may contribute to an increased uptake of the complexes by the cells thereby enhancing the anti-proliferative activity. Further, the higher anti-proliferative activity of the complexes 2 and 3 may be due to the hydrophobic interaction of methyl substituent present in the ligand with both DNA and protein. Notably, the IC50 values are much lower than those for previously reported thiosemicarbazone-based copper(I) complexes,55,56 other copper(I) complexes,57,58 and thiosemicarbazone-based copper(II) complexes.59,60
Table 2 IC50 values of the bis(thiosemicarbazone)copper(I) complexes (1–6) against four cancer (MCF-7, HeLa, Hep-2 & EAC) and two normal (NHDF & L6 myotubes) cell lines
| Complexes |
IC50 values (μM)a |
| MCF-7 |
At 95% confidence interval |
R2 |
HeLa |
At 95% confidence interval |
R2 |
Hep-2 |
At 95% confidence interval |
R2 |
EAC |
At 95% confidence interval |
R2 |
NHDF |
L6 |
| Average of three independent determinations; results are expressed as mean ± SD. |
| 1 |
16.8 ± 0.53 |
11.43–19.08 |
0.9881 |
14.08 ± 0.66 |
10.32–16.85 |
0.9675 |
15.3 ± 0.32 |
12.08–18.11 |
0.9801 |
14.6 ± 0.37 |
11.87–17.08 |
0.9932 |
>100 |
>100 |
| 2 |
10.9 ± 0.12 |
07.21–14.01 |
0.9987 |
9.89 ± 0.82 |
06.13–13.17 |
0.9895 |
9.92 ± 1.26 |
07.92–12.64 |
0.9913 |
8.32 ± 1.03 |
05.23–11.05 |
0.9854 |
>100 |
>100 |
| 3 |
11.2 ± 0.27 |
08.65–15.13 |
0.9911 |
9.91 ± 1.01 |
07.98–13.39 |
0.9802 |
10.1 ± 0.31 |
08.87–12.17 |
0.9788 |
8.91 ± 0.54 |
06.03–11.19 |
0.9863 |
>100 |
>100 |
| 4 |
13.9 ± 0.41 |
10.04–17.71 |
0.9894 |
12.1 ± 0.17 |
08.47–16.86 |
0.9789 |
12.4 ± 0.82 |
09.74–15.54 |
0.9884 |
11.1 ± 0.83 |
08.33–14.67 |
0.9786 |
>100 |
>100 |
| 5 |
18.9 ± 1.09 |
14.09–21.18 |
0.9796 |
16.05 ± 0.52 |
11.95–18.22 |
0.9691 |
18.4 ± 0.43 |
15.06–21.23 |
0.9972 |
15.89 ± 1.09 |
12.63–18.19 |
0.9854 |
>100 |
>100 |
| 6 |
21.7 ± 0.19 |
18.24–23.32 |
0.9869 |
22.94 ± 0.18 |
17.54–25.61 |
0.9601 |
23.9 ± 1.06 |
20.76–26.19 |
0.9846 |
18.08 ± 0.84 |
16.58–21.94 |
0.9809 |
>100 |
>100 |
| Cisplatin |
12.1 ± 0.84 |
09.06–14.87 |
0.9912 |
10.48 ± 0.12 |
08.77–13.03 |
0.9879 |
14.6 ± 0.81 |
11.02–17.27 |
0.9975 |
11.46 ± 0.86 |
09.92–15.78 |
0.9892 |
>100 |
>100 |
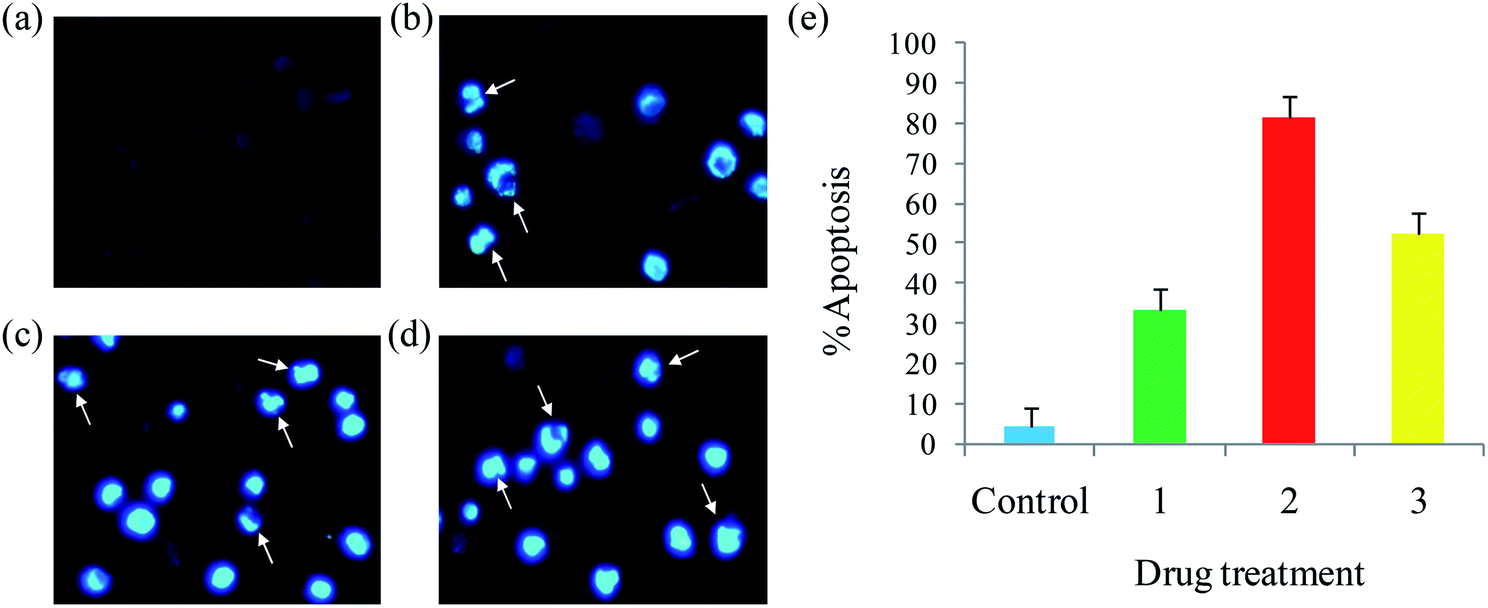
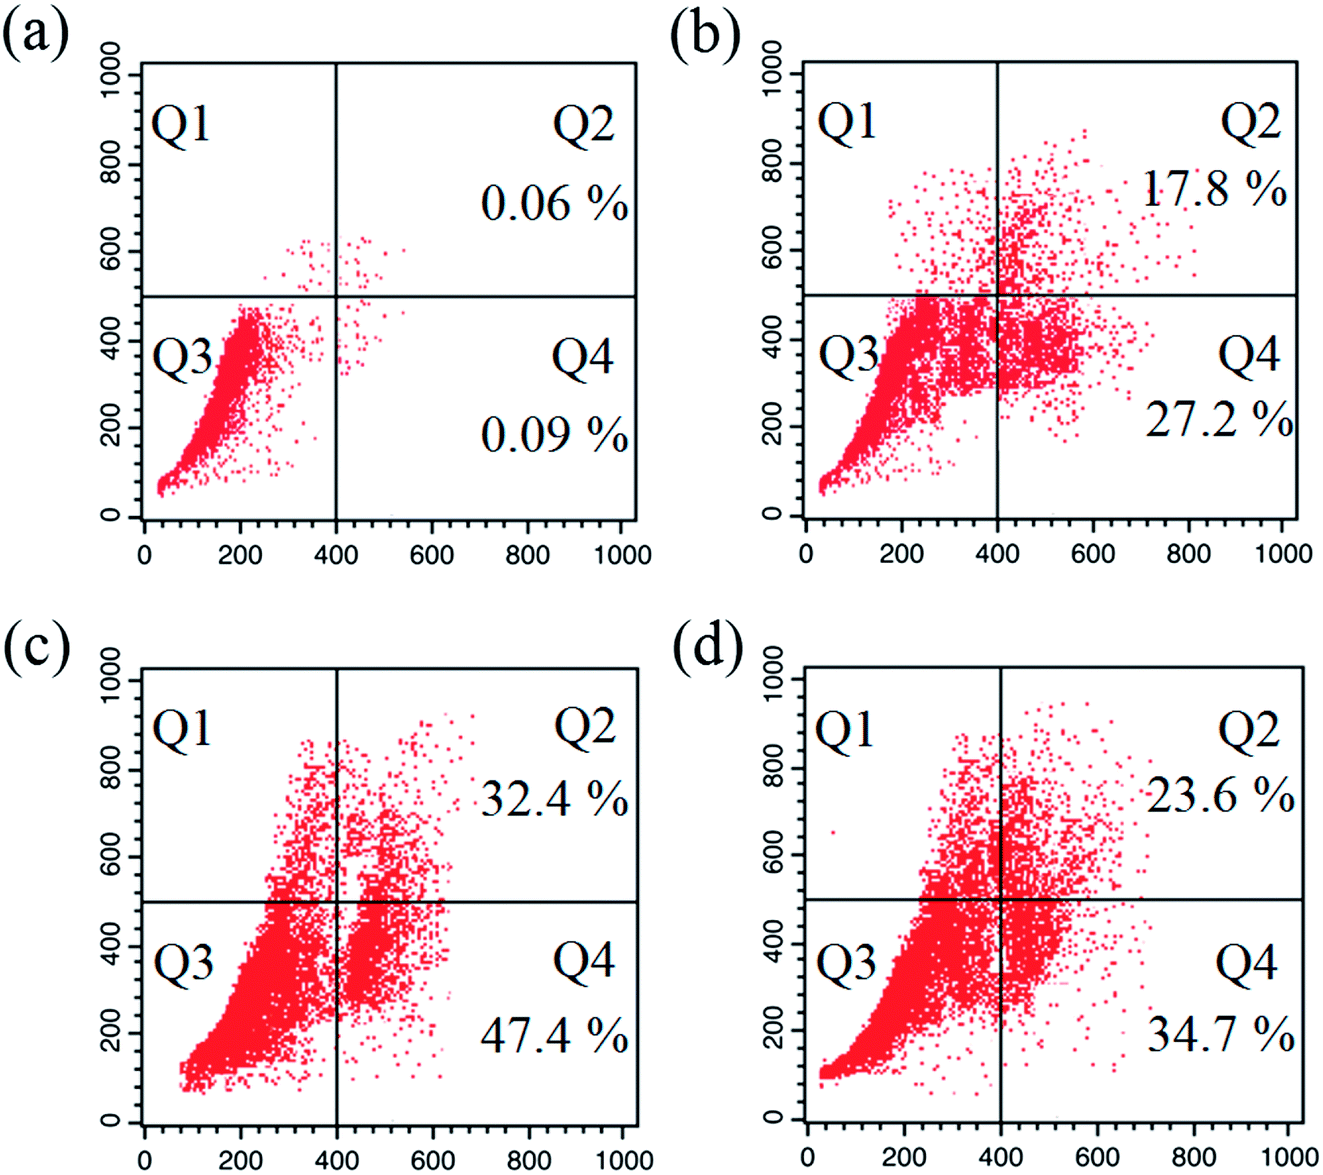
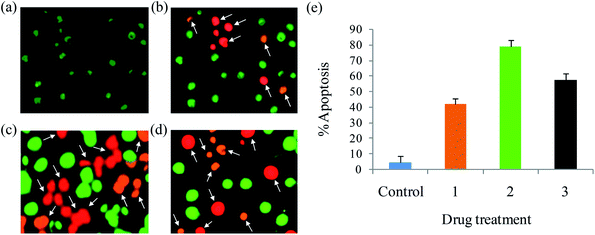
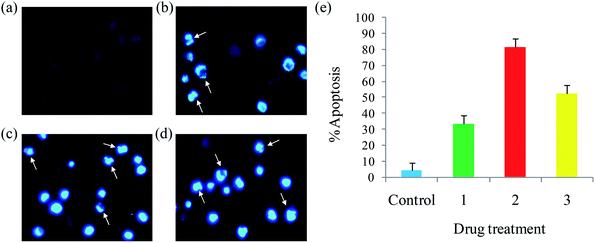
Apoptosis. A number of anticancer drugs successfully induce apoptosis. In order to explore the morphological changes, EAC cells were stained with acridine orange (AO) and ethidium bromide (EB) after exposure to complexes (1–6) for 24 h. Morphological assessment shows living cells (control) with usual morphology and intense green nuclei. Nevertheless, the EAC cells treated with complexes (12.5 μM) for 24 h showed morphological changes as majority of cells become shrinkage, and green apoptotic cells containing apoptotic bodies and red necrotic cells were observed (Fig. 9). The observed results prove that the complexes can induce apoptosis in EAC cells. In addition to confirm the induction of apoptosis, the EAC cells were also treated with complexes (12.5 μM) and stained with Hoechst 33258 for 24 h, which show the apoptotic highlights like chromatin fragmentation, cytoplasmic vacuolation, nuclear swelling and cytoplasmic blebbing (Fig. 10). Further, in order to substantiate the percentage of apoptotic cells, flow cytometry was carried out by exposing the EAC cells to complexes (12.5 μM) for 24 h and stained with PI. The observed results show that the percentage of control in the late apoptotic cells (quadrant Q2) is only 0.06%. After the treatment of EAC cells with complexes (1–6), the percentage of late apoptotic cells increased to 17.8, 32.4, 23.6, 19.2, 16.7 and 14.9%, respectively. Likewise, for control, the percentage of early apoptotic cells (quadrant Q4) is 0.09%, whereas number of early apoptotic cells increased to 27.2, 47.4, 34.7, 30.2, 25.9 and 21.3% for complexes 1–6, respectively (Fig. 11). Thus, the flow cytometry results also support induced apoptosis in EAC cells.
 |
| | Fig. 9 AO/EB staining of EAC cells for 24 h: control (a), complexes 1 (b), 2 (c) and 3 (d), and scar bar diagram (e). | |
 |
| | Fig. 10 Hoechst 33258 staining of EAC cells for 24 h: control (a), complexes 1 (b), 2 (c) and 3 (d), and scar bar diagram (e). | |
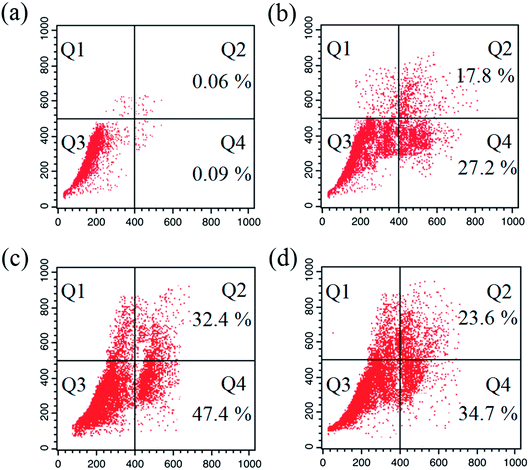 |
| | Fig. 11 Apoptosis detection in EAC cells using the PI assay after 24 h: control (a), and complexes 1 (b) 2 (c) and 3 (d). Four areas in the diagrams represent four different cell states: necrotic cells (Q1), late apoptotic cells (Q2), living cells (Q3) and early apoptotic cells (Q4). | |
Cell cycle arrest. The cell cycle plays a vital role in apoptosis of cancer cells.61 In this context, the cell cycle analysis was performed against EAC cells by flow cytometry with complexes (1–6) for 24 h using propidium iodide. After the treatment of EAC cells with complexes (12.5 μM), there occur significant increase in S phase from 19.8% in the control to 31.4, 46.3, 41.6, 37.5, 27.8 and 21.9%, respectively, for complexes 1–6, with the corresponding reduction in G0/G1 (63.4% in the control to 43.7%, 33.5%, 38.2%, 46.1%, 47.3% and 49.6% for complexes 1–6, respectively) and G2/M (24.2% in the control to 18.9%, 9.7%, 12.3%, 15.9%, 19.7% and 21.8% for complexes 1–6, respectively) phases (Fig. 12). These results clearly showed that the complexes induce the growth arrest of EAC cells in S phase.
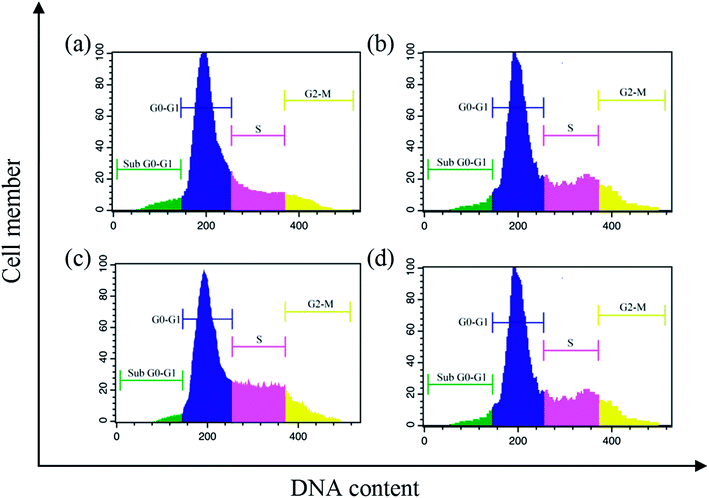 |
| | Fig. 12 Cell cycle progression of EAC cells treated with complexes after 24 h: control (a), and complexes 1 (b) 2 (c) and 3 (d). | |
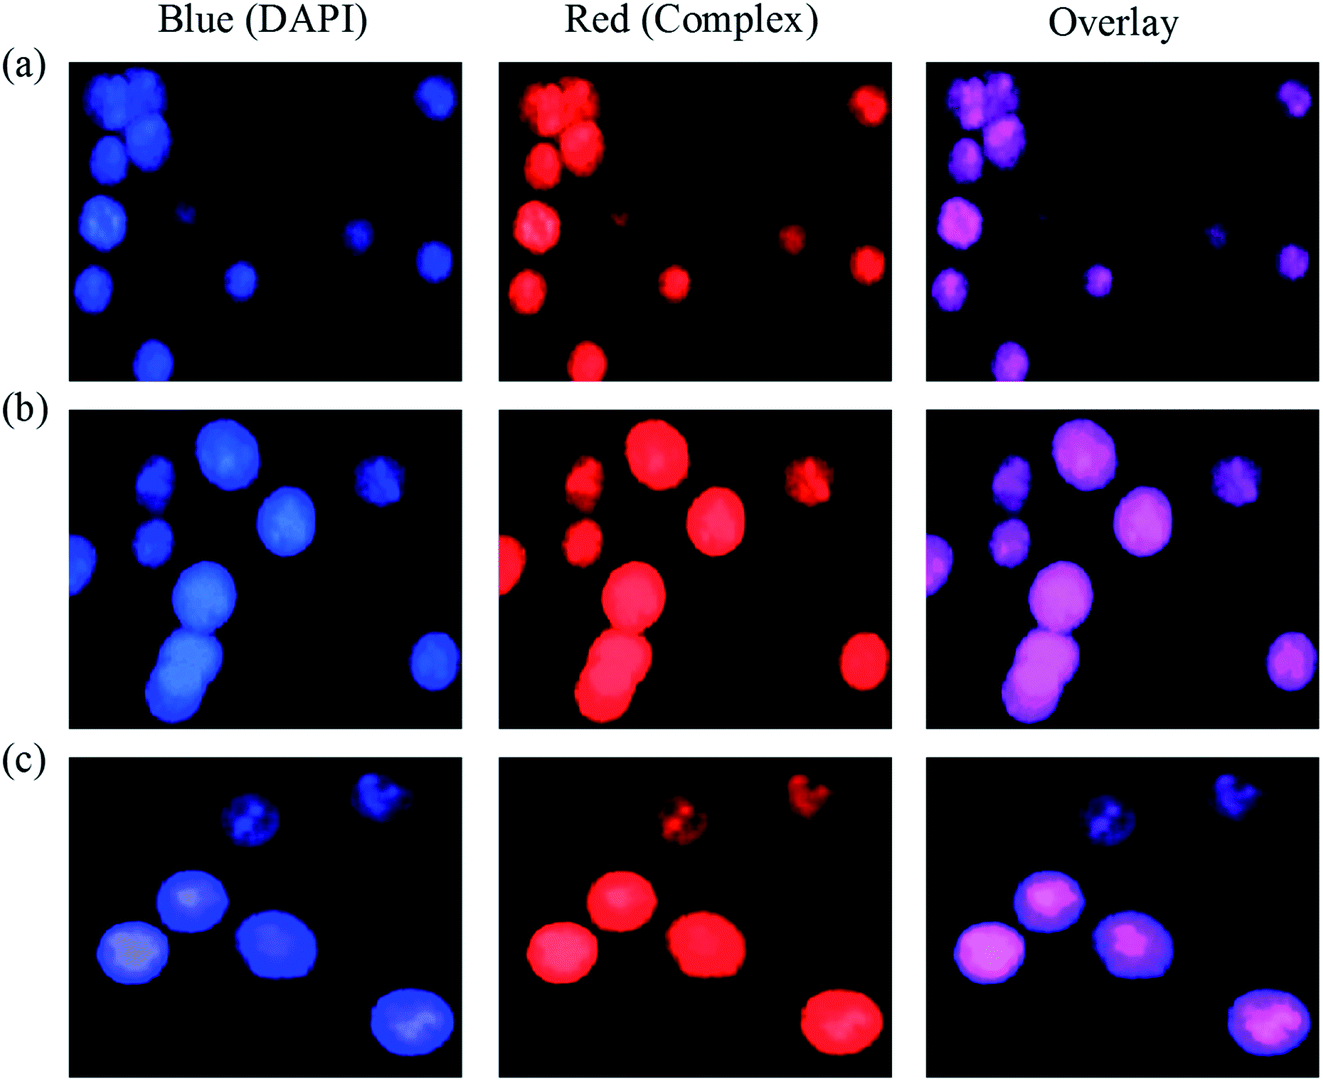
Cellular uptake. Since a number of copper(I) complexes emit red fluorescence at room temperature, it is possible for their effective evaluation of the cellular uptake.62 Interestingly, the cellular uptake plays an important role in the treatment of micromolecular drug.63 In this respect, the cellular uptake was studied after EAC cells were explored to 12.5 μM of copper(I) complexes (1–6) for 24 h, the cells were stained with DAPI staining and observed under fluorescence microscope (Fig. 13 & S11†). The blue channel show DAPI stained nuclei with an excitation wavelength of 340 nm, the red channel show the luminescence of the complexes (1–6) with an excitation wavelength of 458 nm. Blue channel was totally superimpose with red channel, which indicates that the complexes can be uptaken by EAC cells and the complexes slowly infiltrate inside of the nucleus, and shows disseminate cytoplasmic and nuclear fluorescence. The observed results show that the complexes are uptaken by EAC cells and can enter into the cytoplasm and accumulate in the cell nuclei.
 |
| | Fig. 13 Images of EAC cell emergence to complexes 1 (a) 2 (b) and 3 (c), stained with DAPI at 37 °C for 24 h. | |
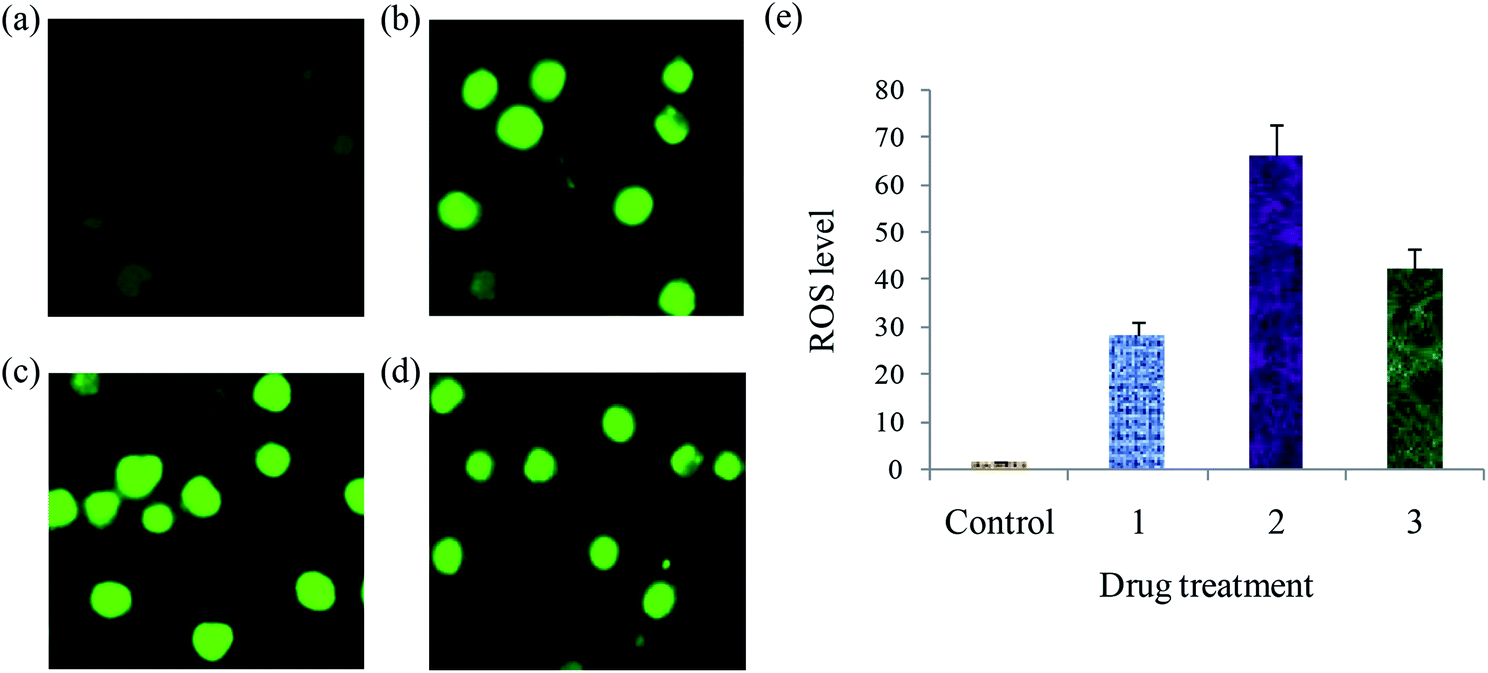
Detection of ROS levels. The generation of intracellular ROS is crucial for cancer cell death and induction of apoptosis. A number of potential anticancer and chemopreventive drugs induce apoptosis during reactive oxygen species (ROS) generation.64 In this context, the effect of complexes (1–3) on intracellular levels of ROS in EAC cells using 2′,7′-dichlorodihydrofluorescein diacetate (DCFH-DA) fluorescence probe was measured (Fig. 14). No evident fluorescence points are observed in the control. When compared with the control, the complexes treated EAC cells exhibit increase in the DCF fluorescence intensity. Further, to examine the levels of ROS generation induced by complexes, we also deliberate the fluorescent intensity of DCF. The resulting fluorescent intensities are 134.7, 164.1 and 149.8 after the treatment of EAC cells with 12.5 μM of the complexes 1–3, respectively. The resulting fluorescent intensity (DCF) of complexes 1–3 grows 2.57, 3.13 and 2.85 times more than the original (control) (Fig. S12†). This results demonstrate that the copper(I) complexes can increase the ROS levels, and the enhanced generation of ROS play a significant role in complex induced cell demise.
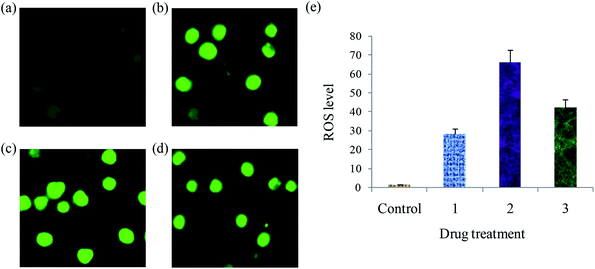 |
| | Fig. 14 ROS generation of EAC cells after treatment with complexes for 24 h: control (a), complexes 1 (a) 2 (c) and 3 (d), and scar bar diagram (e). | |
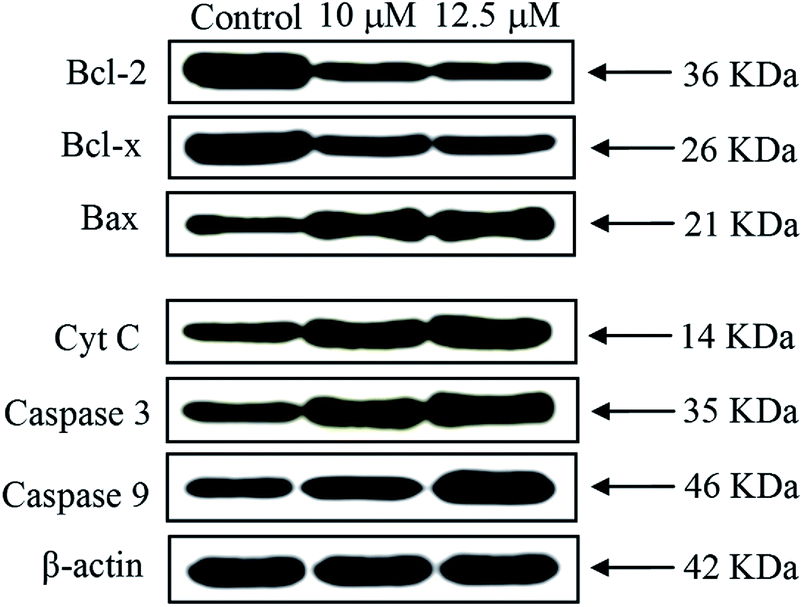
Western blot analysis. Apoptosis occur via two key apoptotic pathways such as receptor-dependent (extrinsic) and mitochondrial (intrinsic) pathway. Generally, the caspases involved in extrinsic pathway and Bcl-2 family proteins involved in intrinsic pathway. Caspases and Bcl-2 family proteins play an important stock in regulating apoptosis.65,66 The complex 2 displayed the highest anticancer activity in EAC cells among the six complexes; therefore, this complex was selected for Western blot analysis. To study the mitochondrial release of apoptogenic factors, we elucidate the impact of the complex 2 on the expression levels of proteins in EAC cells treated with complex 2 for 24 h by Western blot analysis. The expressions of anti-apoptotic proteins (Bcl-2 and Bcl-x) were observed in down-regulated, whereas the pro-apoptotic protein (Bax) was observed up-regulated. The significant increase of Bax/Bcl-2 was observed as a result of excellent permeability of the mitochondrial membrane for the release of pro-apoptotic proteins (Fig. 15). Furthermore, the significant increases of cytochrome c and caspase family proteins (caspase-3/9) levels were observed (Fig. S13†). The observed results confirm that the complex was able to induce EAC cell apoptosis by promoting Cyt C release followed by activation of caspase-3/9.
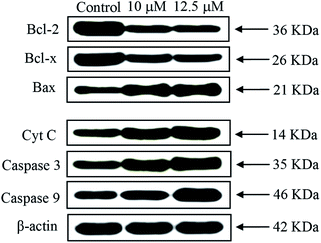 |
| | Fig. 15 Western blot analysis of Bcl-2 family proteins, caspases 3/9 and Cyt C in EAC cells treated with complex 2 for 24 h. β-Actin was used as internal loading control. | |
In vivo anticancer activity. Since, in vitro cytotoxicity of complexes 2 and 3 against EAC cells showed lower IC50 values, we have decided to examine the in vivo anticancer activity of these complexes on EAC tumor model.
Acute toxicity studies. Acute toxicity studies showed that the complexes 2 and 3 falls on category 3 according to globally harmonized classification system for chemical substances and mixtures. Based on the results, the LD50 cut off was found to be 200 mg kg−1 body weight. Hence, 1/10th of this dose i.e. 20 mg kg−1 was selected for the pharmacological study.
Mean survival time of tumor bearing animals. The tumor bearing mice treated with standard drug 5-fluorouracil at the dose of 20 mg kg−1 exhibit significant (P < 0.001) increase in mean survival time over tumor control group. The survival time of the animals treated with complex 2 shows significant (P < 0.001) increases, whereas the complex 3 shows significant (P < 0.01) increases in mean survival time compared to tumor control group. The significant (P < 0.001) percentage increase in life span also proves the anticancer potential of the complexes 2 and 3 (Table 3). As seen from the Fig. 16, the EAC tumor control group shows perfect cell wall and structure without degeneration, whereas the EAC tumor cells treated with complexes for 24 h exhibit degenerative changes such as membrane blebbing, vacuolated cytoplasm, cell wall destruction, cell disintegration and reduction in staining intensity when compared to control group.
Table 3 Effect of complexes 2 and 3 treatment on the survival of tumor-bearing micea
| Design of treatment |
MST (in days) |
ILS (%) |
| N = 6; data were expressed as mean ± SEM. P < 0.001 vs. tumour control. P < 0.001 vs. 5-FU. P < 0.01 vs. complex 2; data were analysed by using one-way ANOVA followed by Tukey–Kramer multiple comparison test. |
| Tumour control |
18.17 ± 0.87 |
— |
| 5-FU |
34.83 ± 0.91c,b |
91.68 |
| 2 |
33.5 ± 1.12d,b |
84.36 |
| 3 |
27.7 ± 0.88b |
52.45 |
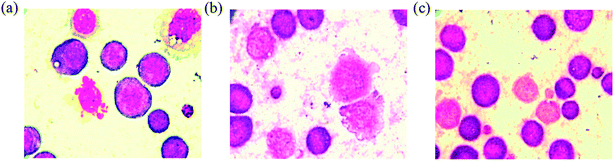 |
| | Fig. 16 Smear showing matured EAC control cells with definite structure and clear cell wall without degeneration (a), EAC tumor cells treated with the complexes 2 (b) and 3 (c) showing degenerative changes like membrane blebbing, cell wall destruction, cell disintegration and reduction in staining intensity. | |
Tumor volume of tumor bearing animals. The tumor volume of tumor control group animals was found to increase steadily. However, the groups treated with complexes 2 and 3 shows significant reduction in tumor volume. The complexes 2 and 3 treated animals shows significant (P < 0.001 and P < 0.01, respectively) reduction in the solid tumor volume (Table 4). The obtained results also proved the anticancer nature of the synthesized copper(I) complexes.
Table 4 Effect of complexes 2 and 3 on solid tumor volume (cm3) of EAC tumor bearing micea
| Design of treatment |
Day15 |
Day20 |
Day25 |
Day30 |
| N = 6; data were expressed as mean ± SEM. P < 0.001 vs. tumour control. P < 0.001 and. P < 0.01 vs. complex 2; data were analysed by using one-way ANOVA followed by Tukey–Kramer multiple comparison test. |
| Tumour control |
1.29 ± 0.096 |
1.69 ± 0.096 |
1.94 ± 0.12 |
2.26 ± 0.14 |
| 2 |
0.944 ± 0.096b |
0.99 ± 0.098d,b |
1.06 ± 0.097c,b |
1.13 ± 0.098c,b |
| 3 |
1.02 ± 0.097b |
1.16 ± 0.083b |
1.29 ± 0.081b |
1.79 ± 0.088b |
Conclusions
A series of six bis(thiosemicarbazone)copper(I) complexes (1–6) were synthesized and acknowledged as potent anticancer agents. All the complexes adopted trigonal planar 'Y′ shaped geometry. The complexes strongly bind with CT-DNA via intercalative mode, which also show pronounced cleavage activity against pBR322 DNA. All the complexes significantly interact with BSA via static quenching mode and interact with focal adhesion kinase (FAK) receptor via π–π, σ–π, hydrogen bonding, electrostatic and van der Waals interactions. In vitro cytotoxicity of the complexes was tested against four cancer (MCF-7, HeLa, Hep-2 and EAC) and two normal (NHDF and L6 myotubes) cell lines by MTT assay with respect to commercially used metal-based anticancer drug cisplatin. Complexes powerfully kills EAC tumour cell line compared to other tested cancer cell lines and all the complexes proved their non-toxicity against normal cell lines. The complexes exhibit induced apoptosis, which is confirmed by AO/EB, Hoechst 33258 and PI (flow cytometry) staining assays along with superior ROS generation. In the cell cycle arrest, the complexes effectively block the EAC cells in S phase. The cellular uptake study shows that the complexes can go inside the cytoplasm and accumulate in the cell nuclei. Western blot analysis also proved induced apoptosis due to the complexes via mitochondria-dysfunction pathway. In addition, the complexes significantly reduce the solid tumor volume in female Swiss albino mice.
Conflicts of interest
There are no conflicts to declare.
References
- M. Whitnall, J. Howard, P. Ponka and D. R. Richardson, A class of iron chelators with a wide spectrum of potent antitumor activity that overcomes resistance to chemotherapeutics, Proc. Natl. Acad. Sci. U. S. A., 2006, 103, 14901–14906 CrossRef CAS PubMed
 .
. - A. E. Stacy, D. Palanimuthu, P. V. Bernhardt, D. S. Kalinowski, P. J. Jansson and D. R. Richardson, Zinc(II)–thiosemicarbazone complexes are localized to the lysosomal compartment where they transmetallate with copper ions to induce cytotoxicity, J. Med. Chem., 2016, 59, 4965–4984 CrossRef CAS PubMed .
- http://www.clinicaltrials.gov.
- A. L. Vavere and J. S. Lewis, Cu-ATSM: a radiopharmaceutical for the PET imaging of hypoxia, Dalton Trans., 2007, 4893–4902 RSC .
- P. J. Crouch, L. W. Hung, P. A. Adlard, M. Cortes, V. Lal, G. Filiz, K. A. Perez, M. Nurjono, A. Caragounis, T. Du, K. Laughton, I. Volitakis, A. I. Bush, Q. X. Li, C. L. Masters, R. Cappai, R. A. Cherny, P. S. Donnelly, A. R. White and K. J. Barnham, Increasing Cu bioavailability inhibits Aβ oligomers and tau phosphorylation, Proc. Natl. Acad. Sci. U. S. A., 2009, 106, 381–386 CrossRef CAS PubMed .
- B. K. Bhuyan and T. Betz, Studies on the mode of action of the copper(II) chelate of 2-keto-3-ethoxybutyraldehyde-bis(thiosemicarbazone), Cancer Res., 1968, 28, 758–763 CAS .
- C. H. Chan-Stier, D. Minkel and D. H. Petering, Reactions of bis(thiosemicarbazonato) copper(II) complexes with tumor cells and mitochondria, Bioinorg. Chem., 1976, 6, 203–217 CrossRef CAS PubMed .
- M. A. Cater, H. B. Pearson, K. Wolyniec, P. Klaver, M. Bilandzic, B. M. Paterson, A. I. Bush, P. O. Humbert, S. La Fontaine, P. S. Donnelly and Y. Haupt, Increasing intracellular bioavailable copper selectively targets prostate cancer cells, ACS Chem. Biol., 2013, 8, 1621–1631 CrossRef CAS PubMed .
- L. W. Hung, V. L. Villemagne, L. Cheng, N. A. Sherratt, S. Ayton, A. R. White, P. J. Crouch, S. Lim, S. L. Leong, S. Wilkins, J. George, B. R. Roberts, C. L. Pham, X. Liu, F. C. Chiu, D. M. Shackleford, A. K. Powell, C. L. Masters, A. I. Bush, G. O'Keefe, J. G. Culvenor, R. Cappai, R. A. Cherny, P. S. Donnelly, A. F. Hill, D. I. Finkelstein and K. J. Barnham, The hypoxia imaging agent Cu II (ATSM) is neuroprotective and improves motor and cognitive functions in multiple animal models of Parkinson's disease, J. Exp. Med., 2012, 209, 837–854 CrossRef CAS PubMed .
- B. M. Zeglis, V. Divilov and J. S. Lewis, Role of metalation in the topoisomerase IIα inhibition and antiproliferation activity of a series of α-heterocyclic-N4-substituted thiosemicarbazones and their Cu(II) complexes, J. Med. Chem., 2011, 54, 2391–2398 CrossRef CAS PubMed .
- A. N. Kate, A. A. Kumbhar, A. A. Khan, P. V. Joshi and V. G. Puranik, Monitoring cellular uptake and cytotoxicity of copper(II) complex using a fluorescent anthracene thiosemicarbazone ligand, Bioconjugate Chem., 2014, 25, 102–114 CrossRef CAS PubMed .
- M. F. Zaltariov, M. Hammerstad, H. J. Arabshahi, K. Jovanović, K. W. Richter, M. Cazacu, S. Shova, M. Balan, N. H. Andersen, S. Radulović, J. Reynisson, K. K. Andersson and V. B. Arion, New iminodiacetate-thiosemicarbazone hybrids and their copper(II) complexes are potential ribonucleotide reductase R2 inhibitors with high antiproliferative activity, Inorg. Chem., 2017, 56, 3532–3549 CrossRef CAS PubMed .
- M. C. Rodriguez-Arguelles, L.-S. Ee, J. Sanmartin, P. Pelagatti and F. Zami, Copper complexes of imidazole-2-, pyrrole-2- and indol-3-carbaldehyde thiosemicarbazones: inhibitory activity against fungi and bacteria, J. Inorg. Biochem., 2005, 99, 2231–2239 CrossRef PubMed .
- A. R. Cowley, J. R. Dilworth, P. S. Donnelly and J. M. White, Copper complexes of thiosemicarbazone-pyridylhydrazine (THYNIC) hybrid ligands: a new versatile potential bifunctional chelator for copper radiopharmaceuticals, Inorg. Chem., 2006, 45, 496–498 CrossRef CAS PubMed .
- P. M. Krishna and K. H. Reddy, Synthesis, single crystal structure and DNA cleavage studies on first 4N-ethyl substituted three coordinate copper(I) complex of thiosemicarbazone, Inorg. Chim. Acta, 2009, 362, 4185–4190 CrossRef CAS .
- N. González-Ballesteros, D. Pérez-Álvarez, M. S. C. Henriques, B. F. O. Nascimento, M. Laranjo, K. Santos, J. Casalta-Lopes, A. M. Abrantes, M. F. Botelho, M. Pineiro, J. A. Paixão and M. C. Rodríguez-Argüelles, Copper(I) complexes of methyl 4-aryl-6-methyl-3,4-dihydropyrimidine-2(1H)-thione-5-carboxylates. Synthesis, characterization and activity in human breast cancer cells, Inorg. Chim. Acta, 2015, 438, 160–167 CrossRef .
- N. González-Ballesteros, D. Pérez-Álvarez, M. C. Rodríguez-Argüelles, M. S. C. Henriques, J. A. Paixão and S. Prado-López, Synthesis, spectral characterization and X-ray crystallographic study of new copper(I) complexes. Antitumor activity in colon cancer, Polyhedron, 2016, 119, 112–119 CrossRef .
- P. R. Chetana, B. S. Srinatha, M. N. Somashekar and R. S. Policegoudra, Synthesis, spectroscopic characterisation, thermal analysis, DNA interaction and antibacterial activity of copper(I) complexes with N,N′-disubstituted thiourea, J. Mol. Struct., 2016, 1106, 352–365 CrossRef CAS .
- G. Meloni, V. Sonois, T. Delaine, L. Guilloreau, A. Gillet, J. Teissié, P. Faller and M. Vasak, Metal swap between Zn7-metallothionein-3 and amyloid-β-Cu protects against amyloid-β toxicity, Nat. Chem. Biol., 2008, 4, 366–372 CrossRef CAS PubMed .
- C. F. Bell, K. A. K. Lott and N. Hearn, Copper complexes of pyridine 2-aldehyde and 2-acetylpyridine thiosemicarbazones, Polyhedron, 1987, 6, 39–44 CrossRef CAS .
- K. Wong, A. R. Morgan and W. Parachych, Controlled cleayage of phage R17 RNA within the virion by treatment with ascorbate and copper(II), Can. J. Biochem., 2001, 52, 950–958 CrossRef .
- M. K. Rauf, I. -ud-Din, A. Badshah, M. Gielen, M. Ebihara, D. de Vos and S. Ahmed, Synthesis, structural characterization and in vitro cytotoxicity and anti-bacterial activity of some copper(I) complexes with N,N′-disubstituted thioureas, J. Inorg. Biochem., 2009, 103, 1135–1144 CrossRef CAS PubMed .
- M. Yang, A. S. Jalloh, W. Wei, J. Zhao, P. Wu and P. R. Chen, Biocompatible click chemistry enabled compartment-specific pH measurement inside, Nat. Commun., 2014, 5, 4981–4991 CrossRef CAS PubMed .
- A. K. Boal and A. C. Rosenzweig, Structural biology of copper trafficking, Chem. Rev., 2009, 109, 4760–4779 CrossRef CAS PubMed .
- V. Gandin, A. Trenti, M. Porchia, F. Tisato, M. Giorgetti, I. Zanusso, L. Trevisi and C. Marzano, Homoleptic phosphino copper(I) complexes with in vitro and in vivo dual cytotoxic and anti-angiogenic activity, Metallomics, 2015, 7, 1497–1507 RSC .
- V. P. Singh, P. Singh and A. K. Singh, Synthesis, structural and corrosion inhibition studies on cobalt(II), nickel(II), copper(II) and zinc(II) complexes with 2-acetylthiophene benzoylhydrazone, Inorg. Chim. Acta, 2011, 379, 56–63 CrossRef CAS .
- Bruker, APEX2, SAINT and SADABS, Bruker AXS Inc., Madison, Wisconsin, USA, 2009 Search PubMed .
- G. M. Sheldrick, A short history of SHELX, Acta Crystallogr., Sect. A: Found. Crystallogr., 2008, A64, 112–122 CrossRef PubMed .
- G. M. Sheldrick, Crystal structure
refinement with SHELXL, Acta Crystallogr., Sect. A: Found. Adv., 2015, C71, 3–8 CrossRef PubMed .
- O. V. Dolomanov, L. J. Bourhis, R. J. Gildea, J. A. K. Howard and H. Puschmann, OLEX2: a complete structure solution, refinement and analysis program, J. Appl. Crystallogr., 2009, 42, 339–341 CrossRef CAS .
- M. P. Nardelli, PARST95-an update to PARST: a system of fortran routines for calculating molecular structure parameters from the results of crystal structure analyses, J. Appl. Crystallogr., 1995, 28, 659 CrossRef CAS .
- A. L. Spek, Structure validation in chemical crystallography, Acta Crystallogr., Sect. A: Found. Crystallogr., 2009, D65, 148–155 CrossRef PubMed .
- L. J. Farrugia, WinGX and ORTEP for Windows: an update, J. Appl. Crystallogr., 2012, 45, 849–854 CrossRef CAS .
- D. Mahendiran, R. S. Kumar, V. Viswanathan, D. Velmurugan and A. K. Rahiman, Targeting of DNA molecules, BSA/c-Met tyrosine kinase receptors and anti-proliferative activity of bis(terpyridine)copper(II) complexes, Dalton Trans., 2016, 45, 7794–7814 RSC .
- D. Mahendiran, R. S. Kumar and A. K. Rahiman, Heteroleptic silver(I) complexes with 2,2′:6′,2′′-terpyridines and naproxen: DNA interaction, EGFR/VEGFR2 kinase, growth inhibition and cell cycle arrest studies, Mater. Sci. Eng. C., 2017, 76, 601–615 CrossRef CAS PubMed .
- D. Mahendiran, P. Gurumoorthy, K. Gunasekaran, R. S. Kumar and A. K. Rahiman, Structural modeling, in vitro antiproliferative activity, and the effect of substituents on the DNA fastening and scission actions of heteroleptic copper(II) complexes with terpyridines and naproxen, New J. Chem., 2015, 39, 7895–7911 RSC .
- D. Mahendiran, R. S. Kumar, V. Viswanathan, D. Velmurugan and A. K. Rahiman, In vitro and in vivo anti-proliferative evaluation of bis(4′-(4-tolyl)-2,2′:6′,2′′-terpyridine)copper(II) complex against Ehrlich ascites carcinoma tumors, J. Biol. Inorg Chem., 2017, 22, 1109–1122 CrossRef CAS PubMed .
- Organization for Economic Co-operation and Development (OECD) guidelines for testing of chemical, Acute oral toxicity Acute toxic class method, Paris, 2001, vol. 423, pp. 1–14 Search PubMed .
- T. S. Lobana, R. Sharma, G. Bawa and S. Khanna, Bonding and structure trends of thiosemicarbazone derivatives of metals-an overview, Coord. Chem. Rev., 2009, 253, 977–1055 CrossRef CAS .
- C. Santini, M. Pellei, V. Gandin, M. Porchia, F. Tisato and C. Marzano, Advances in copper complexes as anticancer agents, Chem. Rev., 2014, 114, 815–862 CrossRef CAS PubMed .
- T. E. Kokina, L. A. Sheludyakova, Y. A. Eremina, E. V. Vorontsova, L. A. Glinskaya, D. A. Piryazev, E. V. Lider, A. V. Tkachev and S. V. Larionov, Complexes of Cu(I) and Pd(I) with (+)-camphor and (−)-cavrone thiosemicarbazones: synthesis, structure, and cytotoxicity of the Pd(II) complex, Russ. J. Gen. Chem., 2017, 87, 2332–2342 CrossRef CAS .
- M. V. Baker, P. J. Barnard, S. J. Berners-Price, S. K. Brayshaw, J. L. Hickey, B. W. Skelton and A. H. White, Cationic, linear Au(I) N-heterocyclic carbene complexes: synthesis, structure and anti-mitochondrial activity, Dalton Trans., 2006, 14, 3708–3715 RSC .
- M. J. McKeage, L. Maharaj and S. J. Berners-Price, Mechanisms of cytotoxicity and antitumor activity of gold(I) phosphine complexes: the possible role of mitochondria, Coord. Chem. Rev., 2002, 22, 127–135 CrossRef .
- J. J. Liu, P. Galettis, A. Farr, L. Maharaj, H. Samarasinha, A. C. McGechan, B. C. Baguley, R. J. Bowen, S. J. Berners-Price and M. J. McKeage, In vitro antitumour and hepatotoxicity profiles of Au(I) and Ag(I) bidentate pyridyl phosphine complexes and relationships to cellular uptake, J. Inorg. Biochem., 2008, 102, 303–310 CrossRef CAS PubMed .
- L. G. Danielsson and Y. H. Zhang, Methods for determining-octanol-water partition constants, Trends Anal. Chem., 1996, 15, 188–196 CAS .
- A. V. Rudnev, L. S. Foteeva, C. Kowol, R. Berger, M. A. Jakupec, V. B. Arion, A. R. Timerbaev and B. K. Keppler, Preclinical characterization of anticancer gallium(III) complexes: solubility, stability, lipophilicity and binding to serum proteins, J. Inorg. Biochem., 2006, 100, 1819–1826 CrossRef CAS PubMed .
- O. Sanchez, S. González, M. Fernández, A. R. H. Padilla, Y. Leon, D. Coll, A. Vidal, P. Taylor, I. Urdanibia, M. C. Goite and W. Castro, Novel silver(I)-and gold(I)-N-heterocyclic carbene complexes. Synthesis, characterization and evaluation of biological activity against tumor cells, Inorg. Chim. Acta, 2015, 437, 143–151 CrossRef CAS .
- A. Pastuszko, K. Majchrzak, M. Czyz, B. Kupcewicz and E. Budzisz, The synthesis, lipophilicity and cytotoxic effects of new ruthenium(II) arene complexes with chromone derivatives, J. Inorg. Biochem., 2016, 159, 133–141 CrossRef CAS PubMed .
- I. V. Tetko, H. P. Varbanov, M. Galanski, M. Talmaciu, J. A. Platts, M. Ravera and E. Gabano, Prediction of logP for Pt(II) and Pt(IV) complexes: comparison of statistical and quantum-chemistry based approaches, J. Inorg. Biochem., 2016, 156, 1–13 CrossRef CAS PubMed .
- J. Cornillon, L. Campos and D. Guyotat, Focal adhesion kinase (FAK), une protéine aux fonctions multiples, Medecine Sciences, 2003, 19, 743–752 CrossRef PubMed .
- S. K. Mitra and D. D. Schlaepfer, Integrin-regulated FAK-Src signaling in normal and cancer cells, Curr. Opin. Cell Biol., 2006, 18, 516–523 CrossRef CAS PubMed .
- V. Gabarra-Niecko, M. D. Schaller and J. M. Dunty, FAK regulates biological processes important for the pathogenesis of cancer, Cancer Metastasis Rev., 2003, 22, 359–374 CrossRef CAS PubMed .
- N. A. Chatzizacharias, G. P. Kouraklis and S. E. Theocharis, Clinical significance of FAK expression in human neoplasia, Histol. Histopathol., 2008, 23, 629–650 CAS .
- K. B. Dunn, M. Heffler and V. M. Golubovskaya, Evolving therapies and FAK inhibitors for the treatment of cancer, Anti-Cancer Agents Med. Chem., 2010, 10, 722–734 CrossRef CAS PubMed .
- Saswati, A. Chakraborty, S. P. Dash, A. K. Panda, R. Acharyya, A. Biswas, S. Mukhopadhyay, S. K. Bhutia, A. Crochet, Y. P. Patil, M. Nethaji and R. Dinda, Synthesis, X-ray structure and in vitro cytotoxicity studies of Cu(I/II) complexes of thiosemicarbazone: special emphasis on their interactions with DNA, Dalton Trans., 2015, 44, 6140–6157 RSC .
- A. Khan, J. P. Jasinski, V. A. Smoleaski, K. Paul, G. Singh and R. Sharm, Synthesis, structure and cytotoxicity evaluation of complexes of N1-substituted-isatin-3-thiosemicarbazone with copper(I) halides, Inorg. Chim. Acta, 2016, 449, 119–126 CrossRef CAS .
- P. Sathyadevi, P. Krishnamoorthy, R. R. Butorac, A. H. Cowley and N. Dharmaraj, Synthesis of novel heterobimetallic copper(I) hydrazone Schiff base complexes: a comparative study on the effect of heterocyclic hydrazides towards interaction with DNA/protein, free radical scavenging and cytotoxicity, Metallomics, 2012, 4, 498–511 RSC .
- N. Selvakumaran, L. Sandhiya, N. S. P. Bhuvanesh, K. Senthilkumar and R. Karvembu, Structural diversity in aroylthiourea copper complexes-formation and biological evaluation of [Cu(I)(μ-S)SCl]2, cis-Cu(II)S2O2, trans-Cu(II)S2O2 and Cu(I)S3 cores, New J. Chem., 2016, 40, 5401–5413 RSC .
- S. M. Kumar, K. Dhahagani, J. Rajesh, K. Anitha, G. Chakkaravarthi, N. Kanakachalam, M. Marappan and G. Rajagopal, Synthesis, structural analysis and cytotoxic effect of copper(II)-thiosemicarbazone complexes having heterocyclic bases: A selective naked eye sensor for F− and CN−, Polyhedron, 2015, 85, 830–840 CrossRef .
- M. M. Subarkhan, R. N. Prabhu, R. R. Kumar and R. Ramesh, Antiproliferative activity of cationic and neutral thiosemicarbazone copper(II) complexes, RSC Adv., 2016, 6, 25082–25093 RSC .
- C. C. Chou, J. S. Yang, H. S. Lu, S. W. Ip, C. Lo, C. C. Wu, J. P. Lin, N. Y. Tang, J. G. Chung, M. J. Chou, Y. H. Teng and D. R. Chen, Quercetin-mediated cell cycle arrest and apoptosis involving activation of a caspase cascade through the mitochondrial pathway in human breast cancer MCF-7 cells, Arch. Pharmacal Res., 2010, 33, 1181–1191 CrossRef CAS PubMed .
- U. K. Komarnicka, R. Starosta, M. Płotek, R. F. M. de Almeida, M. Jeżowska-Bojczuk and A. Kyzioł, Copper(I) complexes with phosphine derived from sparfloxacin. Part II: a first insight into the cytotoxic action mode, Dalton Trans., 2016, 45, 5052–5063 RSC .
- A. C. Puckett and J. K. Barton, Mechanism of cellular uptake of a ruthenium polypyridyl complex, Biochemistry, 2008, 47, 11711–11716 CrossRef PubMed .
- A. Malugin, P. Kopečková and J. Kopecék, HPMA copolymer-bound doxorubicin induces apoptosis in ovarian carcinoma cells by the disruption of mitochondrial function, Mol. Pharm., 2006, 3, 351–361 CrossRef CAS PubMed .
- J. M. Adams, Ways of dying: Multiple pathways to apoptosis, Genes Dev., 2003, 17, 2481–2495 CrossRef CAS PubMed .
- A. Burlacu, Regulation of apoptosis by Bcl-2 family proteins, J. Cell. Mol. Med., 2003, 7, 249–257 CrossRef CAS PubMed .
Footnote |
| † Electronic supplementary information (ESI) available. CCDC 1475312. For ESI and crystallographic data in CIF or other electronic format see DOI: 10.1039/c8ra00954f |
|
| This journal is © The Royal Society of Chemistry 2018 |
Click here to see how this site uses Cookies. View our privacy policy here. 
 Open Access Article
 This Open Access Article is licensed under a Creative Commons Attribution-Non Commercial 3.0 Unported Licence
 *a
*a