 Open Access Article
Ternary composites of Ni–polyaniline–graphene as counter electrodes for dye-sensitized solar cells
Xin Chenab,
Jing Liub,
Kun Qian b and
Jihui Wang*a
aSchool of Materials Science and Engineering, Tianjin University, Tianjin 300072, China. E-mail: jhwang@tju.edu.cn
bCollege of Chemical Engineering and Materials Science, Tianjin University of Science and Technology, Tianjin 300457, China
First published on 19th March 2018
Abstract
Dye-sensitized solar cells (DSSCs), different in principle from the conventional solar cells based on p–n junctions, are competitively cost-effective. For development of this kind of emerging solar cell, it is very significant to reduce their cost and improve their energy conversion efficiency to the maximum extent. In this article, ternary composites (Ni–PANI–G composites) consisting of nickel nanoparticles, polyaniline (PANI), and graphene (G) were prepared for the first time and used as counter electrodes to replace the noble metal Pt in DSSCs. In the case of PANI, the introduction of Ni nanoparticles can improve the electrocatalytic ability for the reduction of triiodide ions in the counter electrode, while in the meantime, the addition of graphene in the Ni–PANI–G composites can increase the electrical conductivity of the counter electrode. The optimized DSSCs fabricated by using the Ni–PANI–G composites as the counter electrode exhibit an overall power conversion efficiency of 5.80% compared to 5.30% for reference platinum (Pt) counter-electrodes. Electrochemical impedance spectra (EIS) show that the charge-transfer resistance at the interface between electrolyte and counter-electrode in the case of the ternary composite is obviously decreased. These results are significant to develop low-cost counter electrode materials for DSSCs.
Introduction
Since the dye-sensitized solar cell (DSSC) with relatively high power conversion efficiency was reported by O’Regan and Grätzel in 1991, it has attracted much attention due to its remarkable efficiency, low cost, stability, and simple fabrication process.1 Though some other solar cells such as perovskite solar cells and organic solar cells have emerged in recent years, DSSC is still one of the most promising alternatives for next generation solar cells with its efficiency improvement and cost reduction.2In general, a DSSC comprises a nanocrystalline titanium dioxide (TiO2) electrode modified with a dye, a platinum-loaded counter electrode and an electrolyte solution between the electrodes. The counter electrode is one of the most important components in the DSSC because it reduces the redox species used as a mediator in regenerating the sensitizer after electron injection. The conventional platinum-loaded counter electrodes are undoubtedly expensive, therefore developing platinum-free counter electrodes is an important way to reduce the cost of a DSSC. Some platinum-free counter electrode materials like graphite, carbon black, carbon nanotubes and conducting polymers have been investigated over the past few years.3–19
Polyaniline (PANI) is well known as an important electronic conducting polymer due to its many desirable qualities such as low cost, environmental stability, and high degree of processability. PANI has been employed as the counter electrode for DSSCs, and has exhibited electrocatalytic activity for the reduction of triiodide ions.20–22 However, both the electrocatalytic activity and electrical conductivity of PANI still need to be improved to suit the requirements of an ideal counter electrode for a DSSC. To improve the electrocatalytic activity, an efficient method is introducing more active sites in PANI. Ni is a proficient catalytic material, and Ni nanoparticles with a high surface area usually have excellent catalytic properties in many catalysis processes.23–29 On the other hand, to improve the electrical conductivity further, a suitable conductive material should be added. Graphene is an allotrope of carbon, possessing high conductivity, huge specific surface area and great mechanical strength. It is expected to be an ideal two-dimensional conductive material. In DSSCs, graphene does not seem to be the right candidate for a counter electrode, in view of the limited number of active sites for I3−/I− electrocatalysis.30–36 However, graphene can form an efficient conductive network in the electrode due to its two-dimensional characteristics. Therefore, it could be imagined that the nanocomposites of graphene, Ni and PANI should be able to provide a better performance in DSSCs as the counter electrode.
In this article, novel ternary composites consisting of nickel nanoparticles, graphene and PANI (Ni–PANI–G composite) were prepared and used as counter electrodes to replace Pt in DSSCs. It was expected that the introduction of Ni nanoparticles and graphene could improve the final performance in DSSCs.
Experimental
Materials
Graphene, nickel acetate (Ni(CH3COO)2·4H2O, 98%), hydrochloric acid (HCl, ACS reagent, 0.5 mol L−1), glycol, ammonium persulfate (APS, 98%), ammonia (NH4OH, anhydrous, 5%) and phenylamine (reagent grade, 98%), sodium hypophosphite, sodium citrate and sodium hydroxide (anhydrous, 2mol L−1), N-methyl-pyrrolidone (NMP) and L-camphorsulfonic acid (CSA) were purchased from Sigma Aldrich and used without any further purification.Preparation of PANI
The aniline monomer (22 mmol) was added into a 25 mL water solution followed by vigorous stirring. The APS solution was prepared by adding the APS powder (11 mmol) to the 5.76 M HCl solution (15 mL). At the desired reaction temperature, the APS solution was introduced drop by drop into the monomer solution. The obtained PANI was washed and dried to give the green emeraldine salt form of the PANI powder. The as-prepared PANI was deprotonated with a NH4OH 1 M aqueous solution. The dedoped PANI was rewashed followed by a drying step.Preparation of Ni nanoparticles
10 mmol Ni(CH3COO)2·4H2O and 5 mmol sodium citrate were gradually added into 70 mL glycol and magnetically stirred for 5 h at room temperature until the solution turned emerald-green, and this was magnetically stirred for 5 min at 100 °C. 2 mol L−1 sodium hydroxide was gradually added until the solution did not change any more. Then 6 mmol sodium hypophosphite was gradually added into the solution and it was stirred for 10 h at 140 °C.Preparation of Ni–PANI–G composites
Graphene (G) and PANI at different weight ratios were added to a constant amount of the Ni nanoparticles (30%) and the formula is shown in Table 1. The Ni–PANI–G composites were prepared as follows: PANI and graphene (G) were gradually mixed with the Ni nanoparticles (30%) and magnetically stirred for 0.5 h. 60 mL distilled water was added and stirred for another 5 min, vacuum filtered, and washed with distilled water until the filtrate was colorless, and then washed with 15 mL ethanol, dried overnight, then the purple black solids were obtained. The obtained product was ground for 1 h with 5 mL NMP, 8 g CSA and 5 mL NMP gradually added successively. Then 150 mL distilled water was added. The resultant product was collected via vacuum filtration, followed by washing with absolute ethanol several times and drying overnight.| Samples | PANI (wt%) | Ni nanoparticles (wt%) | Graphene (wt%) |
|---|---|---|---|
| PG1 | 69 | 30 | 1 |
| PG2 | 67 | 30 | 3 |
| PG3 | 65 | 30 | 5 |
| PG4 | 63 | 30 | 7 |
| PG5 | 61 | 30 | 9 |
Preparation of Ni–PANI–G composite counter electrodes
Fluorine doped tin oxide (FTO, 80% transmittance in visible light, Hartford Glass Co.) glass substrates were cleaned with anhydrous ethanol and de-ionized water to remove organic pollutants and other contaminants, and then ultrasonically washed in acetone for 1 h.1.5 mL m-cresol was gradually added into the prepared 0.1 g Ni–G–PANI composite nanoparticles, and magnetically stirred for 1 h. The obtained solution was coated on a clean FTO glass substrate by using a syringe (aperture 450 nm).
Fabrication of photoanodes
A TiO2 film was deposited on an FTO glass substrate by screen printing. Firstly, 20 nm TiO2 nanoparticles were printed and then calcined at 500 °C for 60 min. The same print process was repeated five times. Secondly, 200 nm thick TiO2 was printed as a spherical layer and calcined at 500 °C for 60 min. The obtained TiO2 film was made into a circle with an effective area of 0.23 cm2, and was immersed in 0.3 mM N719 ethanol solution for 24 h.Fabrication of solar cells
DSSCs were assembled by clamping the prepared TiO2 photoanode and the obtained counter electrode together, and filling the electrolyte in the aperture between the electrodes. The electrolyte is made of acetonitrile with 0.05 M I2, 0.1 M LiI, 0.6 M 1, 2-dimethyl-3-propylimidazolium iodide (DMPII), and 0.5 M 4-tertbutyl pyridine.Characterization
The surface morphology and structural properties of Ni–PANI–G were analysed by using a high-resolution field-emission scanning electron microscope (SEM, JEOL JSM-7600F). The surface morphology of the prepared nanostructures was evaluated by using a JEOL JEM-2010 transmission electron microscope. The phase and crystallinity of the prepared nanostructures were assessed by Rigaku-X-ray powder diffraction. X-ray photoelectron spectroscopy (XPS) was accomplished by using a PHI 5000 Versaprobe ULVAC-PHI, and the background pressure in the analysis chamber was controlled at 10−5 Pa. to measure the electrical conductivities of the prepared nanostructures.Electrochemical measurement
A computer-controlled Zahner IM6e potentiostat was used to carry out the cyclic voltammetry (CV) measurement of the resulting counter-electrodes. A Pt wire and an Ag/AgCl were used as the counter-electrode and the reference electrode, respectively. The resulting Ni–PANI–G composite (or Pt) coated FTO-glass substrate was used as the working electrode. The CV measurement was performed in the potential range of −0.2 to 1.2 V with a scan rate of 50 mV s−1 in an acetonitrile solution containing 10 mM LiI, 0.5 mM I2 and 0.1 M tetra-n-butylammonium tetrafluoroborate. The electrochemical impedance spectroscopy (EIS) measurements were performed by using the same potentiostat with a frequency analysis module (FDA). The AC signal had an amplitude of 10 mV in the frequency range from 0.1 Hz to 100 KHz at 0.8 V (Voc) DC bias under dark conditions. The current density versus voltage (J–V) characteristics of the devices were tested under AM 1.5 illumination (Xenon lamp, Newport 67005) at a light intensity of 100 mW cm−2. The same light source coupled with a monochromator and trans-impedance amplifier was used for incident photon-to-current conversion efficiency (IPCE) measurements.Results and discussion
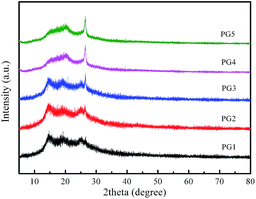
The crystalline structures of the as-synthesized nanomaterials were characterized by using X-ray diffraction. Fig. 1 shows the XRD pattern of the Ni–PANI–G composites with 30 wt% Ni and various amounts of graphene. PG1–5 means 1 wt%, 3 wt%, 5 wt%, 7 wt% and 9 wt% of graphene, respectively. In the diffraction patterns of the ternary Ni–PANI–G composites, the diffraction peaks at 2θ = 15° and 2θ = 25° demonstrate the parallel and vertical periodic intervals of polyaniline polymer chains, respectively. The diffraction peak at θ = 26° is ascribed to the reflection of graphene, as reported in many papers. Though the amount of nickel is up to 30 wt%, no diffraction peak of metallic nickel appears in the XRD patterns. This indicates that Ni nanoparticles are small sized and highly dispersed in the PANI. With the increased proportion of graphene in the composites, the intensity of the diffraction peak located at 26° increases with gradually rising intensity. In the meantime, the diffraction peaks of PANI relatively decrease, gradually showing a better dispersion. This result demonstrates that graphene is suitable as a conductive skeleton in the composite materials. In addition, in all samples, diffraction peaks for metallic nickel are not observed.The morphology, particle size and dispersion of the prepared materials were investigated by using SEM and the obtained images are shown in Fig. 2. The SEM images in Fig. 2a and b show the representative morphology of the Ni nanoparticles and Ni–PANI particles, respectively. It was found that the pure nickel nanoparticles are nearly sphere-like, the particle size is uniform and around 100 nm, and the particles tend to aggregate into around two-micrometer particles. The pure Ni nanoparticles are not very suitable to be directly used as the CE of DSSCs, because the aggregation of metal nanoparticles could reduce their specific surface area and electrocatalytic properties. On the other hand, the existence of larger secondary particles increases the transmission of electrons between particles, which hinders the rapid transfer of charge in the electrode. Therefore, Ni nanoparticles are a disadvantage of their performance in both electrocatalysis and conductivity.
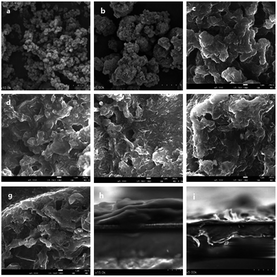 | ||
| Fig. 2 (a and b) Scanning electron microscopy (SEM) of Ni nanoparticles. (c–g) SEM of PG1–5. (h and i) SEM of a cross-section of PG5. | ||
Fig. 2c–g show the SEM images of the ternary composites Ni–PANI–G with the various amounts of graphene, 1 wt%, 3 wt%, 5 wt%, 7 wt% and 9 wt%, respectively. It can be observed from the images that, with the increasing content of graphene, the PANI particles and metal nickel nanoparticles are linked together to form a cross-linked structure. As mentioned above, the cross-linked structure is more favorable for the rapid transfer of charge. Herein, as a two-dimensional soft material, graphene is a conductive skeleton, which is fully consistent with the original design of the composite materials. With the increasing content of graphene, the mixed graphene and particles are more and more obvious. Considering the catalytic active site of the electrode material, we chose 9 wt% G doped with 30 wt% Ni–PANI in our experiment.
Fig. 2h and i show the SEM images of the centre and edge of the cross-section of the ternary composite Ni–PANI–G with 9 wt% of graphene film, respectively. It can be seen that the spin-coated film has a relatively thick center and thin edge. The thickness of the thickest part of the film is about 900 nm, and there are many surface defects on the film which can increase the surface area of the counter electrodes. The reason might be the high viscosity of the composite after dissolution and the solvent volatilization during the spin-coating process leaving wavy defects on the surface of the film.
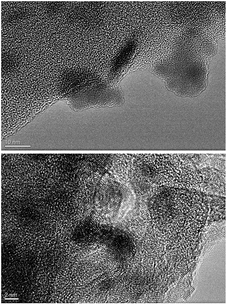
As shown in the TEM images of the ternary composite in Fig. 3, the PANI shows amorphous character, and Ni nanoparticles with a size of about several nanometers. The crystalline lattice of Ni can be observed and corresponds to a metallic state. In TEM observation, it is difficult to clearly observe graphene in the sample due to the small amount of graphene adhered to PANI.
XPS results for the ternary nanocomposite PG5 are shown in Fig. 4. The Ni 3p profile can be fitted into four peaks where the binding energies of Ni 3p3/2 are respectively located at 852.4, 854.8, 858.6 and 861.2 eV. The strongest peak at 852.4 eV is indexed to metallic nickel, and the adjacent peak at 854.8 eV is from NiO. The other two peaks are actually satellite lines of the Ni and NiO respectively. The results show that nickel in the ternary composite mainly exists as metallic nickel and the surface is oxidized unavoidably when the sample is exposed in air. In the case of C 1s, besides the main peak at 284.6 eV, a small peak at about 285.7 eV can be observed that is attributed to the signal of C bonding to amine in PANI. In addition, the peak of N 1s located at 400.0 eV is consistent with nitrogen in PANI. In general, there is no obvious interaction among the Ni, C and N elements in the ternary composite.
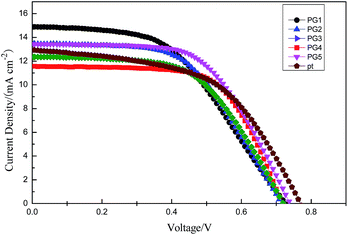
To evaluate the photovoltaic performances of DSSCs constructed with the prepared counter electrodes, photocurrent density–photovoltage (J–V) curves were recorded under light illumination of 100 mW cm−2 (1.5 AM). Fig. 5 and Table 2 show the photovoltaic performance J–V curves of the corresponding solar cell using the ternary composites with 1 wt%, 3 wt%, 5 wt%, 7 wt% and 9 wt% of graphene, respectively. It can be seen from the photovoltaic parameters, with the increasing content of graphene in the composite materials, the fill factor (FF) of the solar cells shows a significant enhancement, indicating that graphene can improve the conductivity and electrocatalytic activity of the composite materials. The DSSC fabricated with PG 5 exhibits Jsc of 13.43 mA cm−2 associated with a Voc of 0.745 V, η of 5.30 and FF of 0.53. From the comparison of the data, the ternary nanocomposite counter electrode performance is comparable with that of the conventional Pt counter electrode. In general, the DSSC performances are purely dependent upon the electrocatalytic activity and fast electron transfer of the counter electrodes while other cell components remain identical. The improved DSSC performances obtained for the ternary Ni–PANI–G are attributed to the fact that graphene can improve the electrical conductivity of the composite materials.
| Sample | Jsc (mA cm−2) | Voc (V) | η% | FF |
|---|---|---|---|---|
| PG1 (1% G) | 14.89 | 0.727 | 5.22 | 0.48 |
| PG2 (3% G) | 13.45 | 0.719 | 5.25 | 0.54 |
| PG3 (5% G) | 11.36 | 0.754 | 4.74 | 0.54 |
| PG4 (7% G) | 11.56 | 0.719 | 5.32 | 0.64 |
| PG5 (9% G) | 13.43 | 0.745 | 5.80 | 0.58 |
| Pt | 12.92 | 0.772 | 5.30 | 0.53 |
Cyclic voltammetry (CV) is an efficient method of analyzing the catalytic mechanisms that occur in an electrochemical system. Fig. 6 shows CV results obtained from Pt and Ni–PANI–G composite counter-electrodes. The pair of oxidation and reduction peaks on the left affect device performance in DSSCs, which directly relates to the reactions (1) and (2), while the corresponding reduction peak is located at −0.4 V. The reduction of I3− is a key step during the process. It can be seen from Fig. 6 that the corresponding reduction process of PG1 is not obvious and the current density is smaller than that of the Pt electrode. The results show that the electrocatalytic ability of the PG1 composite is relatively weak. With the increasing content of graphene, the position of the reduction peak of I3− gradually shifts to the left (more negative), which indicates that the catalytic capacity of the electrode becomes gradually lower. At the same time, the current density of the electrode increases gradually, indicating that the corresponding composite has many more active sites, which might be due to the role of the G conductive skeleton. According to experimental data, the composite PG5 with 9 wt% G had the largest current density. Therefore, the Ni–PANI–G composite can be used as a highly efficient electrocatalytic counter-electrode to replace Pt in DSSCs.
| I3− + 2e− ↔ 3I− | (1) |
| 2I3− ↔ 3I2 + 2e− | (2) |
| I3− + 2e− → 3I− | (3) |
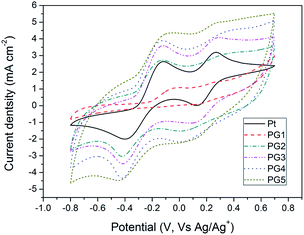 | ||
| Fig. 6 Cyclic voltammograms of the Ni–PANI–G, and Pt electrodes with a scan rate of 50 mV s−1 in 10 mM LiI and 1 mM I2 acetonitrile solution containing 0.1 M LiClO4 as the supporting electrolyte. | ||
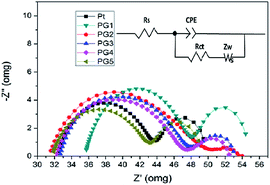
The electrocatalytic performances of the as-prepared counter-electrodes were further evaluated by electrochemical impedance spectroscopy (EIS). To eliminate the influence of the photoanode, the symmetrical dummy cells are made with two identical Pt or Ni–PANI–G composite electrodes deposited onto FTO-glass substrates and measured from 100 kHz to 0.1 Hz with an amplitude of 10 mV under dark conditions. Fig. 7 shows the Nyquist plots of Pt and Ni–PANI–G composite counter-electrodes. Z′ and Z′′ are the real and imaginary parts of the impedance, respectively. An equivalent circuit has also been applied to interpret the measurements taken on the above counter-electrodes as shown in Fig. 7, where Rs is the ohmic series resistance, Rct is the charge transfer resistance on the electrode–electrolyte interface, Zw is the Nernst diffusion impedance of the I−/I3− redox couple in the electrolyte solution, and CPE is the constant phase element describing the capacitance of the counter-electrode.37,38 The semicircle at high frequency is formed from the charge transfer process at the counter-electrode–electrolyte interface. The Rs in the equivalent circuit corresponds to the overall series resistance, which is calculated by the high-frequency intercept of the semicircle on the real axis. The Rs and Rct results are extracted from fitting the Nyquist plots as shown in Table 3. We can see from the table that the Rct of the composite electrodes (PG2, PG3, PG4 and PG5) could be comparable to the Rct of Pt-FTO. With the increase of G content, the Rct of the composite electrodes (PG2, PG3, PG4 and PG5) declines. It is demonstrated that the addition of graphene (G) could reduce the Rct of the Ni–PANI–G composite electrodes. The Rct of the PG5 composite electrode is 10.78 Ω cm2 which could compare to 11.01 Ω cm2 in the Pt electrode. The smaller Rct of the Ni–PANI–G composite electrode implies a faster charge transfer at the counter-electrode–electrolyte interface as a result of the higher exchange current density, in agreement with CV results. The high electrocatalytic activity of the Ni–PANI–G composite is attributed to its large surface area provided by beaded graphene nanosheets and good electrical conductivity brought by the incorporated Ni nanoparticles. Moreover, the Rs value of the Ni–PANI–G composite electrode is 31.8 Ω cm2, which is slightly higher than the Rs of 32.3 Ω cm2 of the Pt electrode. It could be concluded that the addition of the G as the conductive skeleton improves the conductivity of the electrode, accelerates the electrocatalysis process of the whole material, and also improves the dynamic process of the counter electrode.
| Counter electrode | Rs | Rct (Ω) | Zw (Ω) |
|---|---|---|---|
| FTO/Pt | 32.3 | 11.01 | 6.43 |
| PG1 | 35.8 | 12.43 | 7.55 |
| PG2 | 31.4 | 14.41 | 4.91 |
| PG3 | 32.6 | 12.48 | 5.82 |
| PG4 | 32.2 | 12.52 | 4.98 |
| PG5 | 31.8 | 10.78 | 4.88 |
Conclusions
In summary, a series of ternary Ni–PANI–G nanocomposites were prepared and used as cost-effective counter-electrode materials for DSSCs for the first time. The introduction of graphene and Ni nanoparticles in Ni–PANI–G composites can significantly improve the electrochemical performance. This can be attributed to the graphene which decreases the charge-transfer resistance at the interface between electrolyte and counter-electrode, leading to the high catalytic performance and conductivity. Compared to the DSSCs based on Pt counter-electrodes, the Jsc, Voc and FF values of the DSSCs made of Ni–PANI–G composites are slightly higher. The power conversion efficiency achieved by using this novel counter-electrode was 5.80% compared to 5.30% using solution-processed Pt counter-electrodes. This suggests that the Ni–PANI–G composite is a promising, low-cost effective counter-electrode material with similar efficiency to Pt counter-electrodes for the DSSC application.Conflicts of interest
There are no conflicts to declare.Acknowledgements
This work was supported by the National Natural Sciences Foundation of China (No. 51771133) and the innovation of research methods and demonstration of safety and quality control of dairy chain (No. 2016IM030400).Notes and references
- B. O’regan and M. Grätzel, Nature, 1991, 353, 738 Search PubMed.
- M. Grätzel, Inorg. Chem., 2005, 44, 6847 CrossRef PubMed.
- J. X. Yang, Q. W. Tang, Q. Meng, Z. F. Zhang, J. Y. Li, B. L. He and P. Z. Yang, J. Mater. Chem. A, 2017, 5, 2146 Search PubMed.
- Q. W. Tang, J. Wang, B. L. He and P. Z. Yang, Nano Energy, 2017, 33, 268 CrossRef.
- P. T. Shih, R. X. Dong, S. Y. Shen, R. Vittal, J. J. Lin and K. C. Ho, J. Mater. Chem. A, 2014, 2, 8742–8748 CAS.
- Y. Zhang, Q. W. Tang, B. L. He and P. Z. Yang, J. Mater. Chem. A, 2016, 4, 13238 Search PubMed.
- M. J. Ju, I. Y. Jeon, H. M. Kim, J. I. Choi, S. M. Jung, J. M. Seo, I. T. Choi, S. H. Kang, H. S. Kim, M. J. Noh, J. J. Lee, H. Y. Jeong, H. K. Kim, Y. H. Kim and J. B. Baek, Sci. Adv., 2016, 2, 5 Search PubMed.
- J. Briscoe and S. Dunn, Adv. Mater., 2016, 28, 3808 Search PubMed.
- S. Kim, V. Dao, L. L. Larina, K. Jung and H. Choi, Chem. Eng. J., 2016, 283, 1290 CrossRef.
- W. L. Zhu, J. L. Duan, Y. Y. Duan, Y. Y. Zhao and Q. W. Tang, J. Power Sources, 2017, 367, 163 Search PubMed.
- Q. Xue, J. K. Li and Z. Y. Yang, Langmuir, 2017, 33, 879 Search PubMed.
- M. Abdullah, S. K. Kamarudin and L. K. Shyuan, Nanoscale Res. Lett., 2016, 11, 560 CrossRef PubMed.
- Q. W. Tang, H. N. Zhang, B. L. He and P. Z. Yang, Nano Energy, 2016, 30, 820 CrossRef.
- W. Yang, P. Z. Yang and Q. W. Tang, Mater. Lett., 2016, 180, 229 Search PubMed.
- M. X. Wu, X. Lin, T. H. Wang, J. S. Qiu and T. L. Ma, Energy Environ. Sci., 2011, 4, 2312 Search PubMed.
- B. Fan, X. Mei, K. Sun and J. Ouyang, Appl. Phys. Lett., 2008, 93, 143103 CrossRef.
- L. M. Peter, Phys. Chem. Chem. Phys., 2007, 9, 2630–2642 RSC.
- N. Papageorgiou, Coord. Chem. Rev., 2004, 248, 1439 CrossRef.
- J. Wang, Q. W. Tang and B. L. He, J. Power Sources, 2016, 328, 188 CrossRef.
- S. Ameen, M. S. Akhtar, Y. S. Kim, O. B. Yang and H. S. Shin, J. Phys. Chem. C, 2010, 114, 4760 CAS.
- Q. Li, J. Wu, Q. Tang, Z. Lan, P. Li, J. Lin and L. Fan, Electrochem. Commun., 2008, 10, 1299 CrossRef CAS.
- Q. Tai, B. Chen, F. Guo, S. Xu, H. Hu, B. Sebo and X. Z. Zhao, ACS Nano, 2011, 5, 3795 CrossRef CAS PubMed.
- Z. Li, B. Ye, X. Hu, X. Zhang and Y. Deng, Electrochem. Commun., 2009, 11, 1768–1771 CrossRef CAS.
- Q. Li, J. Wu, Q. Tang, P. Li and J. Lin, Electrochem. Commun., 2008, 10, 1301 Search PubMed.
- P. Joshi, Z. Zhou, P. Poudel, A. Thapa, X. F. Wu and Q. Qiao, Nanoscale, 2012, 4, 5662 RSC.
- Z. Zhou, X. F. Wu and H. Fong, Appl. Phys. Lett., 2012, 100, 023115 CrossRef.
- Z. Zhou, X. F. Wu and H. Hou, RSC Adv., 2014, 4, 23622 RSC.
- M. S. Yousef, N. A. Akhtar, M. Barakat, M. Motlak, O. B. Yang and H. Y. Kim, Electrochim. Acta, 2013, 102, 145 CrossRef.
- M. Ranjani, Y. Sathishkumar, Y. S. Lee, D. J. Yoo, A. R. Kim and G. G. Kumar, RSC Adv., 2015, 5, 57808 RSC.
- L. Kavan, J. Yum and M. Grätzel, ACS Nano, 2011, 5, 168 Search PubMed.
- P. Divya and S. Ramaprabhu, J. Mater. Chem. A, 2014, 2, 4916 Search PubMed.
- V. D. Dao, L. L. Larina, H. Suh, K. Hong, J. Lee and H. Choi, Carbon, 2014, 77, 988 CrossRef.
- V. D. Dao, N. T. Hoa, L. L. Larina, J. K. Lee and H. S. Choi, Nanoscale, 2013, 5, 12240 RSC.
- Y. G. Kim, Z. A. Akbar, D. Y. Kim, S. M. Jo and S. Y. Jang, ACS Appl. Mater. Interfaces, 2013, 5, 2058 Search PubMed.
- M. Yeh, L. Lin, J. Su, Y. Leu, R. Vittal, C. Sun and K. Ho, ChemElectroChem, 2014, 1, 419 CrossRef.
- P. Zhai, Y. Chang, Y. Huang, T. Wei, H. Su and S. Feng, Electrochim. Acta, 2014, 132, 189 CrossRef.
- T. N. Murakami, S. Ito, Q. Wang, M. K. Nazeeruddin, T. Bessho, I. Cesar, P. Liska, R. Humphry-Baker, P. Comte and P. Péchy, J. Electrochem. Soc., 2006, 153, A2258 CrossRef.
- H. Wang, Q. Feng, F. Gong, Y. Li, G. Zhou and Z. S. Wang, J. Mater. Chem. A, 2013, 1, 99 Search PubMed.
| This journal is © The Royal Society of Chemistry 2018 |

