 Open Access Article
Dispersible MoS2 micro-sheets induced a proinflammatory response and apoptosis in the gills and liver of adult zebrafish†
Yadong Yu‡
 *a,
Yanliang Yi‡b,
Yangying Lib,
Ting Pengb,
Shanli Laob,
Jiahao Zhangb,
Shaocui Lianga,
Yan Xionga,
Shasha Shaoa,
Na Wua,
Ye Zhaob and
He Huang
 bc
bc
aCollege of Biotechnology and Pharmaceutical Engineering, Nanjing Tech University, No. 30 Puzhu South Road, Nanjing, 211800, China. E-mail: yadongyu@njtech.edu.cn; Tel: +(86)-25-58139942
bSchool of Pharmaceutical Sciences, Nanjing Tech University, Nanjing, 211800, China
cState Key Laboratory of Materials-Oriented Chemical Engineering, Nanjing Tech University, Nanjing, 211800, China
First published on 16th May 2018
Abstract
Molybdenum disulfide (MoS2), one of the next-generation two-dimensional materials (2DMs), has attracted increasing attention due to its unique physicochemical properties. However, the aquatic toxicity of dispersible MoS2 is still unknown. Herein, we synthesized chitosan functionalized MoS2 (CS-MoS2) micro-sheets with a satisfying water-dispersible performance. The average length and width of the as-prepared CS-MoS2 micro-sheets were 5.04 μm and 3.12 μm, respectively, and they had a pristine 2H polymorph. The toxicity of CS-MoS2 micro-sheets was assessed by investigating the organs, gills and liver of adult zebrafish. We found that exposure to high concentrations of CS-MoS2 micro-sheets (10 mg L−1 and 20 mg L−1) led to lamellar fusions in the gills, and significant localized lesions, such as peripheral nuclei and vacuole formation, in the liver. In addition, treatment with 20 mg L−1 CS-MoS2 micro-sheets suppressed gene expression of antioxidant enzymes (e.g., CAT and GPx1a gene) and induced the expression levels of the proinflammatory response and apoptosis (e.g., IL-1β, IL-6, and AIF gene) in gill and liver tissues. Further, reactive oxygen species (ROS) were generated upon treatment with 20 mg L−1 CS-MoS2 micro-sheets in both organs. To the best of our knowledge, this is the first investigation of the aquatic toxicity of dispersible MoS2 in zebrafish, and further highlights the potential environmental risk of MoS2.
1. Introduction
Within post-graphene two-dimensional materials (2DMs), attention has been focused on molybdenum disulfide (MoS2) due to its unique properties and promising potential in various applications.1–3 The increasing application of MoS2 and other 2DMs inevitably emphasizes the need for the ecotoxicity evaluation of these materials. Fortunately, beside our previous work, this issue has already been addressed in several studies.4–8 Our current findings regarding the toxicity of MoS2 are derived using chemically exfoliated few-layered MoS2 or native bulk MoS2.9–11 However, compared to the abundant documents studying the toxicity of graphene and its derivatives, the aquatic toxicity of MoS2 is still very poorly explored and understood.3,12,13In fact, MoS2 and other engineered nanomaterials (ENMs) are able to enter rivers or lakes and thus, evaluating the aquatic toxicity of these materials is essential.14 Due to its inert and hydrophobic properties, however, it is difficult to interpret the aquatic toxicity of MoS2 using native bulk MoS2.15 Although some might argue this would represent a real world situation, it is necessary to consider that released MoS2 and other ENMs encounter turbulent waters in rivers, and various compounds, such as natural organic matter, which act as dispersants.16 Further, functionalized MoS2 materials (e.g., PEGylated MoS2 sheets and chitosan-decorated MoS2 sheets) with perfect water-dispersible performances have shown promising potentials in biomedical applications, such as in photothermal therapies for cancers.17,18 All in all, it is reasonable to anticipate an increasing risk of environmental organisms exposed to these water-dispersible MoS2 in the future. It can be also assumed that humans will be exposed to these dispersible MoS2 materials via occupational, environmental, or biomedical approaches. Taken together, it is necessary and critical to explore the toxicity of MoS2 material particularly in a water-dispersible form in terms of health and environmental risks.
With regard to this, in the present study we synthesized chitosan functionalized MoS2 (CS-MoS2) micro-sheets that exhibit water-dispersible characteristics. Since zebrafish are powerful vertebrate model organism for in vivo studies in aquatic toxicology,19 we investigated the effects of dispersible MoS2 micro-sheets upon exposure of adult zebrafish. We found that a high dosage of CS-MoS2 micro-sheets resulted in considerable aquatic toxicity. Our findings are helpful for roundly assessing the aquatic toxicity of MoS2, which may influence the applications of MoS2 and other new 2DMs.
2. Materials and methods
2.1 Preparation of CS-MoS2 micro-sheets
We utilized a previously reported method to prepare the CS-MoS2 micro-sheets.20 In short, 250 mg of bulk MoS2 powder (99.995%, Sigma-Aldrich, USA) was ground with 100 mg of chitosan (CS) (Sigma-Aldrich, USA) for 10 min using an agate mortar and a pestle. 0.5 mL of BMIPF6 (1-butyl-3-methylimidazolium hexafluorophosphate, ≥97.0%, Shanghai Chengjie Chemical Company, China) was then added into the mortar, and the mixture was ground for another 50 min. Secondly, the mixture was collected from the mortar and washed with acetone, DMF, 0.5% acetic acid (v/v) for three times to get rid of the BMIPF6 and the excess chitosan. Subsequently, the sediment was re-suspended in double distilled water and centrifuged (1500 rpm, 20 min) to remove the large or thick MoS2. Finally, the residual CS-MoS2 micro-sheets suspension was preserved in 4 °C.2.2 Characterization of CS-MoS2 micro-sheets
The morphologies of the CS-MoS2 micro-sheets were observed by a field emission scanning electron microscope (SEM) (S-4800, Hitachi, Japan) and an atomic force microscopy (AFM) (Veeco, Cambridge, UK) in the tapping mode. The AFM image was analyzed by NanoScope software vision 6.24r1 (Veeco, Cambridge, UK). The lateral dimension of the CS-MoS2 micro-sheets were determined on AFM topographical images that were converted to 8 bit format and analyzed using ImageJ version 1.34u (Wayne Rasband, NIH, USA). 150 CS-MoS2 micro-sheets were randomly selected from the SEM images and then their average length and width were measured using ImageJ version 1.34u (Wayne Rasband, NIH, USA). To further measure the samples under a high-resolution transmission electron microscope (HRTEM), the samples were dispersed in acetone and dropped onto a mesh with a carbon-coated copper. The meshes were kept in a desiccator for three days, after which a JEM-1011 transmission electron microscope (JEOL, Japan) was utilized to obtain the HRTEM images of the samples at 200 kV. A HR800 Raman Microscope (Horiba Jobin Yvon, France) was also utilized to analyze the CS-MoS2 micro-sheets samples with an excitation wavelength of 514 nm. The fourier transform infrared spectra of the CS-MoS2 micro-sheets samples was obtained by a Fourier transform infrared spectroscope (FTIR) (PerkinElmer, Waltham, USA). The wavelength was set at the range of 500–4000 cm−1. Ultraviolet-visible (UV-vis) absorption spectra of CS-MoS2 micro-sheets was obtained using a UV-vis spectrometer (UV-2550, Shimadzu, Japan). An X-ray diffractometer (3 kW, Rigaku Smartlab, Japan) was used to obtained the X-ray diffraction (XRD) patterns of chitosan, native MoS2 and CS-MoS2 powders.2.3 Fish maintenance and exposure
Zebrafish were maintained and investigated according to the US National Research Council's Guide for the Care and Use of Laboratory Animals (The National Academies Press, Washington (DC), 8th edition, 2011). The study protocols were approved by the Nanjing Tech University (Nanjing, China) Animal Care and Use Committee. 2 month-old zebrafish (AB line) were maintained in flow-through tanks under the standardized conditions of pH (7.0 ± 1.0), temperature (28 ± 0.5 °C), and photoperiod (12![[thin space (1/6-em)]](https://www.rsc.org/images/entities/char_2009.gif) :
:![[thin space (1/6-em)]](https://www.rsc.org/images/entities/char_2009.gif) 12 light/dark). The fish were fed twice a day with the commercially available nutritionally balanced artificial fish meal (Suzhou Green Blue Pet Products Co. Ltd., China) and acclimated for one week prior to the exposure experiments. Forty fish with similar length and age were divided equally into four aquariums, where they were exposed to 0 mg L−1, 2 mg L−1, 10 mg L−1 and 20 mg L−1 CS-MoS2 micro-sheets for two weeks, respectively. The four groups were housed in the above conditions and one half of the exposure water in each tank was replaced daily with fresh water containing the corresponding concentrations of the investigated materials.
12 light/dark). The fish were fed twice a day with the commercially available nutritionally balanced artificial fish meal (Suzhou Green Blue Pet Products Co. Ltd., China) and acclimated for one week prior to the exposure experiments. Forty fish with similar length and age were divided equally into four aquariums, where they were exposed to 0 mg L−1, 2 mg L−1, 10 mg L−1 and 20 mg L−1 CS-MoS2 micro-sheets for two weeks, respectively. The four groups were housed in the above conditions and one half of the exposure water in each tank was replaced daily with fresh water containing the corresponding concentrations of the investigated materials.
2.4 Histological examination
After being exposed the materials for two weeks, the fish were harvested and their gills and livers were collected for the following histological examination. These tissues were firstly fixed in 4% (w/v) paraformaldehyde solution for 24 h, after which they were dehydrated in ethanol and then embedded in paraffin. The samples were then sectioned and stained with hematoxylin and eosin. The images of the sections were obtained using a light microscope (Nikon ECLIPSE Ts2, Japan).2.5 Quantitative real-time PCR assay
The zebrafish gill and liver were separately homogenized in 1 mL Trizol reagent (Invitrogen, USA) and the total RNA was extracted according with the manufacturer's instructions. All the RNA samples were included into a reverse-transcription reaction to prepare first-strand complementary DNA (cDNA). IL-1β, IL-6, AIF, Bax1, CAT, GPx1a, Noxa, p21 and TNF-α expression were measured using SYBR Green kits ((Takara, China)) on an ABI 7500 Real-time PCR System. β-Actin was used as the internal control gene. The sequences of the primers were shown as follow: 5′-TGCTGTTTTCCCCTCCATTG-3′ and 5′-TCCCATGCCAACCATCACT-3′ for β-actin, 5′-TGGCGAACGTCATCCAAG-3′ and 5′-GGAGCACTGGGCGACGCATA-3′ for IL-1β, 5′-TCAACTTCTCCAGCGTGATG-3′ and 5′-TCTTTCCCTCTTTTCCTCCTG-3′ for IL-6, 5′-AAAGTCCGGAAAGAGGGT GT-3′ and 5′-GCCTGGAGCTCAGCATTAAC-3′ for AIF, 5′-ACAGGGATGCTGAAGTGACC-3′ and 5′-GAAAAGCGCCACAACTCTTC-3′ for Bax1, 5′-AGGGCAACTGGGATCTTACA-3′ and 5′-TTTATGGGACCAGACCTTGG-3′ for CAT, 5′-ACCTGTCCGCGAAACTATTG-3′ and 5′-TGACTGTTGTGCCTCAAAGC-3′ for GPx1a, 5′-ATGGCGAAGAAAGAGCAAAC-3′ and 5′-CGCTTCCCCTCCATTTGTAT-3′ for Noxa, 5′-GGAAAGATGACCGATGAGGA-3′ and 5′-GACGCACCTTGTCCAATTTT-3′ for p21, 5′-GCTTATGAGCCATGCAGTGA-3′ and 5′-TGCCCAGTCTGTCTCCTTCT-3′ for TNF-α. The conditions of the thermal cycling was 95 °C for 2 min, 40 cycles of 95 °C for 15 s and 60 °C for 1 min. The expression levels of the target genes were calculated using the 2−ΔΔCt method and expressed as fold changes relative to those of the control. Each sample was replicated at least for three times.2.6 Reactive oxygen species (ROS) measurement
In short, after being exposed to different concentrations of CS-MoS2 micro-sheets, the fish were harvested and their gills and livers were collected and washed with ice-cold PBS (pH 7.2) twice. The isolated gills and livers were homogenized in ice-cold PBS and the resulting homogenate was centrifuged at 15![[thin space (1/6-em)]](https://www.rsc.org/images/entities/char_2009.gif) 000 × g, 4 °C for 30 min. Then the supernatant was collected and its protein content was measured using a BCA protein assay kit (Nanjing Jiancheng Bioengineering Institute, China). ROS content was measured using the dichlorofluorescein-diacetate (DCFH-DA) (Sigma-Aldrich, USA) and a fluorescent spectrophotometer (SpectraMax M3, Molecular Devices, USA) with excitation and emission at 485 nm and 530 nm, respectively.
000 × g, 4 °C for 30 min. Then the supernatant was collected and its protein content was measured using a BCA protein assay kit (Nanjing Jiancheng Bioengineering Institute, China). ROS content was measured using the dichlorofluorescein-diacetate (DCFH-DA) (Sigma-Aldrich, USA) and a fluorescent spectrophotometer (SpectraMax M3, Molecular Devices, USA) with excitation and emission at 485 nm and 530 nm, respectively.
2.7 Statistical analysis
One-way ANOVA in Origin 6.1 software was utilized to conduct the statistical analysis. A 0.05 confidence level was used to determine the statistical significance.3. Results
3.1 Characterization of CS-MoS2 micro-sheets
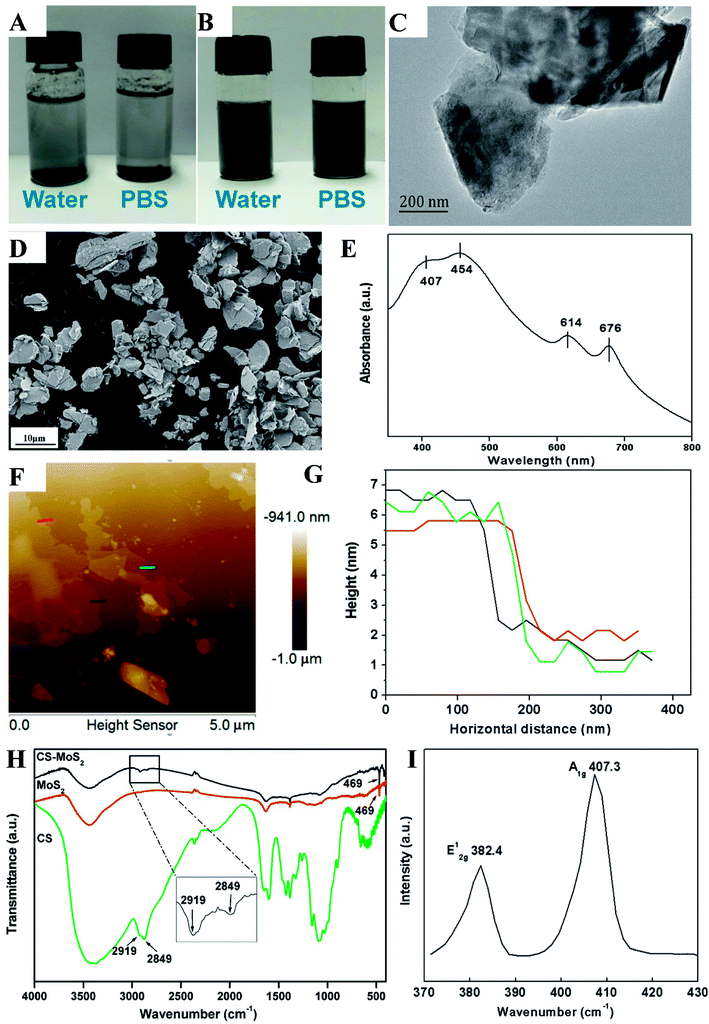
As shown in Fig. 1A, native MoS2 powder was not dispersible in the water (exposure condition) or phosphate buffer solution (PBS); the powder was only visible at the top or bottom of these solutions. However, the solutions containing the as-prepared CS-MoS2 micro-sheets were homogeneous and black, and we did not observe any distinctive sediment accumulation when the CS-MoS2 micro-sheets solutions were stored at room temperature for one week (Fig. 1B). The SEM and HRTEM images revealed that the CS-MoS2 micro-sheets had a wrinkled-flake and laminar structure (Fig. 1C and D). The average length and width of the CS-MoS2 micro-sheets were 5.04 μm and 3.12 μm, respectively. Four typical absorption peaks (676, 614, 454 and 407 nm) were found the UV-vis spectra of CS-MoS2 micro-sheets (Fig. 1E). AFM analysis showed that the thickness of CS-MoS2 micro-sheets was about 4–5 nm (Fig. 1F and G). From the results of FT-IR spectra, we found both CS-MoS2 micro-sheets and native MoS2 owned an absorption peak at 469 cm−1, which demonstrated the presence of Mo–S vibration.21 Moreover, CS-MoS2 micro-sheets and CS shared two peaks at 2919 cm−1 and 2849 cm−1, suggesting that CS-MoS2 micro-sheets contained MoS2 and CS (Fig. 1H). The Raman spectra of CS-MoS2 micro-sheets exhibited the two typical peaks at 382.4 cm−1 and 407.3 cm−1, which corresponded to the in-plane (E12g) mode and out-of-plane (A1g) mode.22 The spacing between the E12g and A1g Raman peaks (Δf) of the as-prepared CS-MoS2 micro-sheets was about 25 cm−1 (Fig. 1I). In our previous work, we measured the XPS spectrum of the native MoS2 and CS-MoS2 micro-sheets.23 As shown in Fig. S1,† both native MoS2 and CS-MoS2 micro-sheets exhibited the regions of Mo 3d and S 2p. Two Mo 3d peaks appeared at 229.3 eV and 232.3 eV in CS-MoS2, which were attributed to Mo4+ 3d5/2 and Mo4+ 3d3/2 components of the 2H phase (Fig. S1C†). Similarly, the corresponding two Mo 3d peaks of native MoS2 were present at ∼229.9 eV and 233 eV (Fig. S1A†). Similarly, in the S 2p region, CS-MoS2 micro-sheets and native MoS2 showed two peaks of S 2p1/2 and S 2p3/2 (Fig. S1B and D†). Thus, the results of XPS indicated that both CS-MoS2 and native MoS2 materials showed the pristine 2H polymorph.24 In the XRD pattern results, a characteristic peak of CS was found at 20.7° (Fig. S2†). There was a sharp peak in the XRD pattern of native MoS2 at 14.8°, suggesting that most of the native MoS2 were multi-layered.25 However, in the XRD pattern of CS-MoS2 micro-sheets, this peak appeared at 14.4° and it became weaker. Further, the characteristic peak of CS was not obvious. This result indicated that some of the CS-MoS2 micro-sheets were still multi-layered and only a small amount of chitosan existed in the CS-MoS2 micro-sheets.3.2 Histological examination
The morphologies of gills in the control were normal. The gill arches contained curved structures, and consisted of rows of primary filaments or lamellae (Fig. 2A). When exposed to 2 mg L−1 CS-MoS2 micro-sheets, no obvious damages were found in the gills (Fig. 2B). However, exposures to high concentrations of CS-MoS2 micro-sheets (10 mg L−1 and 20 mg L−1) resulted in lamellar fusions (red arrows) in the gills (Fig. 2C and D).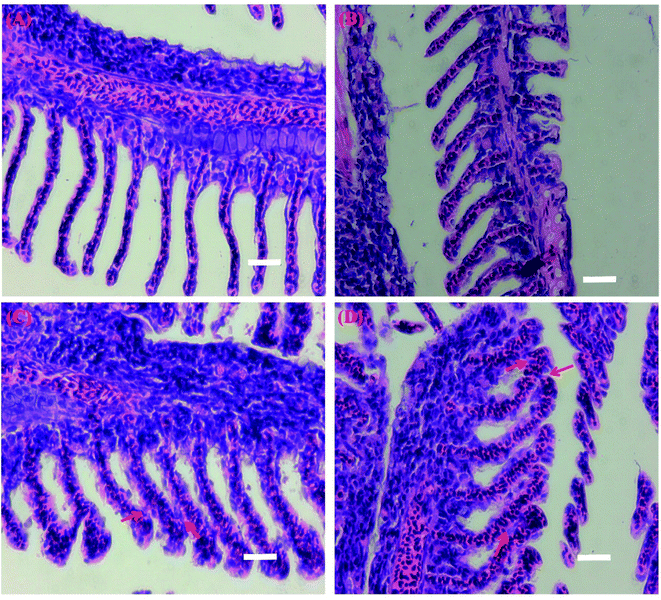 | ||
| Fig. 2 Light micrographs of the gill tissue samples from control (A) and CS-MoS2 micro-sheets treatments (2 mg L−1 (B), 10 mg L−1 (C) and 20 mg L−1 (D)). Scale bar = 400 μm. | ||
The livers in the control showed normal histology; nuclei were localized at the center of cells (Fig. 3A). The untreated liver showed tight cell contact and the liver was filled with well-delineated polygonal cells containing prominent nucleus and well-preserved cytoplasm. No obvious impairments were found in the livers when the fish were exposed to 2 mg L−1 CS-MoS2 micro-sheets (Fig. 3B). However, significant localized lesions such as peripheral nuclei, vacuole formation (red arrows) and losing nuclei (red circles) were observed in the livers when the fish were exposed to high concentrations of CS-MoS2 micro-sheets (10 mg L−1 and 20 mg L−1) (Fig. 3C and D).
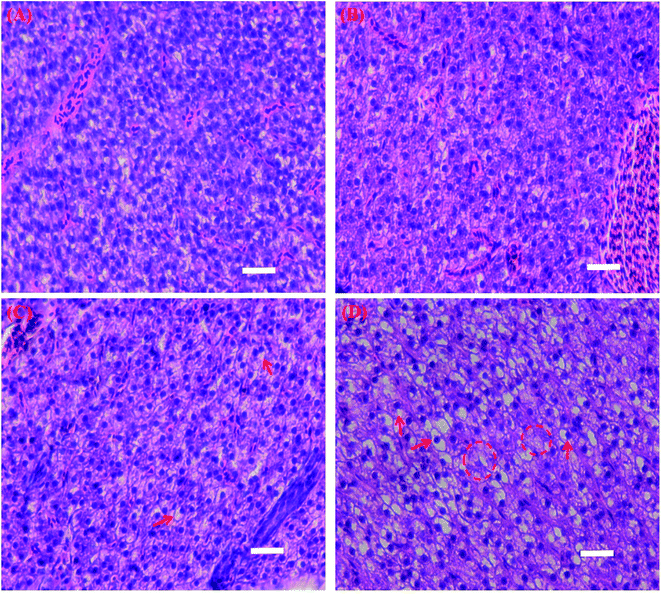 | ||
| Fig. 3 Light micrographs of the liver tissue samples from control (A) and CS-MoS2 micro-sheets treatments (2 mg L−1 (B), 10 mg L−1 (C) and 20 mg L−1 (D)). Scale bar = 400 μm. | ||
3.3 Gene expression analysis
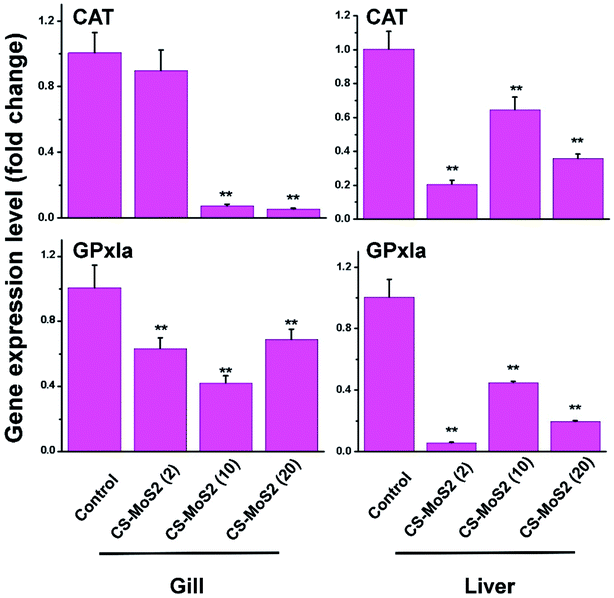
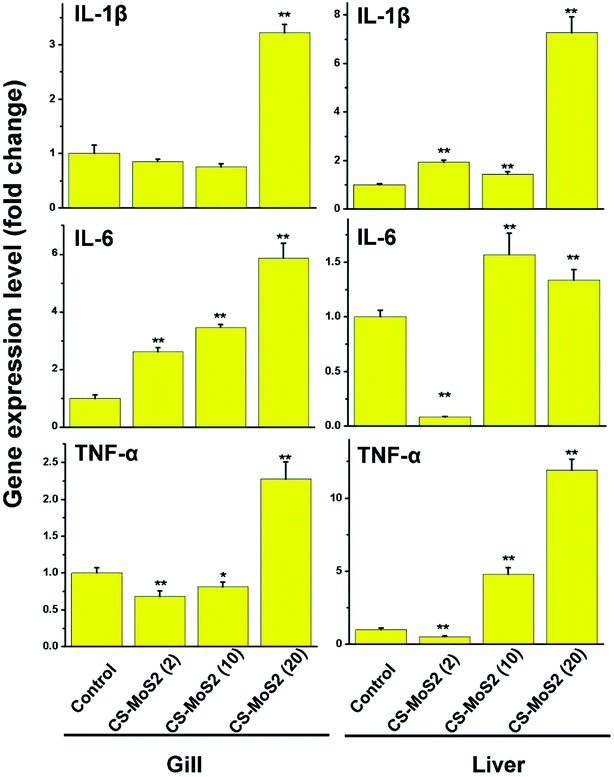
Most of the expressions of CAT and GPx1a gene in gill and liver were depressed to some extend after exposure to CS-MoS2 micro-sheets (Fig. 4).Interestingly, the expressions of IL-1β, IL-6 and TNF-α gene in gill and liver samples were stimulated by CS-MoS2 micro-sheets in a dose-dependent manner (Fig. 5).
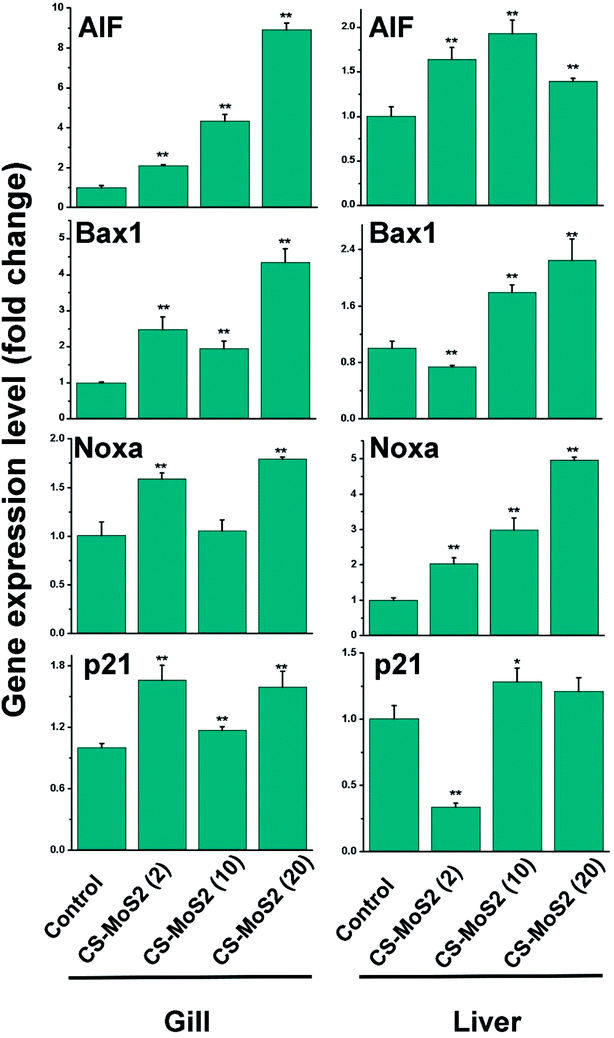
Exposure to different concentrations of CS-MoS2 micro-sheets significantly enhanced the expressions of the AIF gene both in gill and liver samples (Fig. 6). Moreover, the expressions of Bax1 gene were increased upon exposure to different concentrations of CS-MoS2 micro-sheets, which showed a similar expression pattern compared with AIF (Fig. 6). It was also found that the treatments of different concentration of CS-MoS2 micro-sheets exerted positive impacts on the expressions of Noxa gene to some extends. The expressions of Noxa gene in gill and liver were the highest upon exposure to 20 mg L−1 CS-MoS2 micro-sheets (Fig. 6). Moreover, high concentrations of CS-MoS2 micro-sheets (10 mg L−1 and 20 mg L−1) enhanced the expressions of p21 gene both in gill and liver samples (Fig. 6).
3.4 ROS measurement
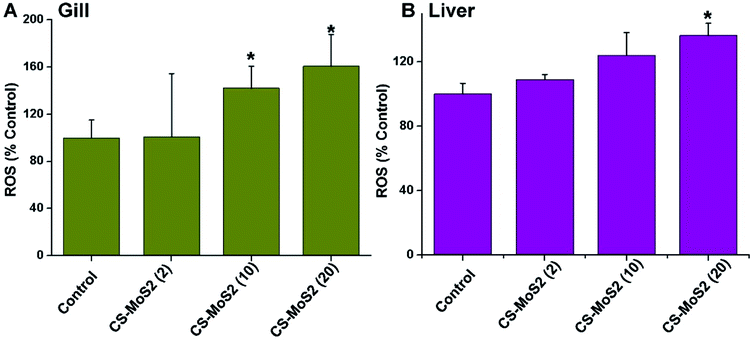
The ROS concentrations in both gills and livers increased gradually in a dosage-dependent manner upon exposure to different concentrations of CS-MoS2 micro-sheets (Fig. 7).4. Discussion
The application of 2DMs such as graphene and MoS2 increases worldwide, thus, it is urgent and essential to fully address their biocompatibility and eco-toxicity by extensive in vitro and in vivo studies. The toxicity of graphene has been thoroughly explored in the past decades. However, as a new-generation 2DMs, knowledge regarding the ecotoxicity of MoS2 is still limited.Engineered nanomaterials (ENMs) encounter numerous chemicals that act as dispersants and turn the ENMs into dispensable forms.16 With regard to MoS2, dispersible MoS2 are already fabricated and applied in the biomedical fields,17 which lead to the increasing opportunities for these dispersible MoS2 to release into the aquatic environment. Herein, to overcome its hydrophobic and inert nature that will block us to fully interpret the aquatic toxicity of MoS2,15 we prepared the CS-MoS2 micro-sheets which showed excellent water-dispersible and stability performances (Fig. 1A). It has been found that graphene-family nanomaterials exerted adverse impacts on aquatic organisms such as algae and fish.26 For instance, Chen et al. reported that exposure to graphene oxide led to the cellular alterations, such as vacuolation, histolysis and disintegration of cell boundaries, in the liver and intestine of zebrafish.27 In consistent with the findings reported by Chen et al.,27 we also found that exposures to high concentrations of CS-MoS2 micro-sheets (10 mg L−1 and 20 mg L−1) led to lamellar fusions in the gills and significant localized lesions such as peripheral nuclei and vacuole formation in the livers. However, no obvious damage was found when gill and liver samples were exposed to 2 mg L−1 CS-MoS2 micro-sheets (Fig. 2 and 3).
ENMs such as graphene are known to impair tissue structures and lead to formation of reactive oxygen species (ROS) which are assumed to be the main driver for their toxicity.26–29 Oxidative toxicity of ENMs often cause the disturbances in the gene expressions of antioxidant enzymes.30,31 Therefore, the results of histological examination encouraged us to further explore the gene expression changes of some antioxidant enzymes. Oxyradical-scavenging enzymes catalase (CAT) and glutathione peroxidase 1a (GPx1a) are two important antioxidant enzymes that can function in cooperation in order to convert H2O2 into H2O and molecular oxygen.32 Previous studies verified that some ENMs and toxicants reduced the mRNA expression of CAT and GPx1a in the animal cells.30,33,34 In this work, we also found that exposure to high concentrations of CS-MoS2 micro-sheets significantly suppressed mRNA expressions of CAT and GPx1a in gill and liver (Fig. 4), suggesting that high concentrations of CS-MoS2 micro-sheets dramatically impaired the cellular antioxidant systems and induced more ROS. The ROS measurement result further confirmed that high concentrations of CS-MoS2 micro-sheets significantly increased the ROS concentrations in both gill and liver samples (Fig. 7).
Moreover, ROS have been found to be able to further trigger proinflammatory cytokine production.35,36 The main cytokines, such as IL-1β, IL-6 and TNF-α, which are secreted by the immune cells, are particularly important to modulate the amplitude of fish immune responses.37 Consistent with the findings reported by Chen et al.,27 we further found that the expressions of these three cytokines were remarkably increased after exposure to a high concentration of CS-MoS2 micro-sheets (20 mg L−1), which indicated that high concentration of CS-MoS2 micro-sheets caused strong proinflammatory response in gill and liver (Fig. 5).
Furthermore, ROS not only plays an important role in triggering proinflammatory responses, but also in inducing apoptosis under both physiologic and pathologic conditions.38 The AIF (apoptosis-inducing factor) gene is well-known for its apoptogenic activity and induces caspase-independent peripheral chromatin condensation and large-scale DNA fragmentation.39 Bax1 and Noxa are two important members of the p53-related pro-apoptotic Bcl-2 family genes.40 p21 gene is under the control of p53 gene and promotes p53-dependent cell cycle arrest or apoptosis.41 Choi et al. reported that after treatment with silver nanoparticles, the p53-related pro-apoptotic genes such as Bax, Noxa, and p21 were significantly induced in zebrafish.30 Herein, we also found that exposure to a high concentration of CS-MoS2 micro-sheets (20 mg L−1), the gene expressions of AIF, Bax1, Noxa, and p21 were remarkably up-regulated (Fig. 6), suggesting that a high concentration of CS-MoS2 micro-sheets (20 mg L−1) induced apoptosis in the gill and liver tissues of zebrafish.
The eco-toxicities of ENMs are highly depended on their physio-chemical properties, such as the chemical element composition, size and surface defects.42 MoS2 contains two chemical elements, molybdenum (Mo) and sulfur (S). Sulfur is generally thought to be non-toxic since it is an abundant element and common in biological systems as well. Differently from S, Mo is an essential trace element and adverse effects are found if excessively uptaken. For instance, Ward et al. reported that increased Mo intakes inhibited copper availability and probably led to a deficiency of physiological copper in ruminants.43 In our previous work, we proved that as-prepared CS-MoS2 micro-sheets exhibited the pristine 2H polymorph, which is comparable to raw MoS2 materials.23 MoS2 in the form of 2H polymorph is relatively stable and undergoes oxidative dissolution quite slowly upon a 7 day exposure in the air-saturated aqueous medium.24 Thus, under the applied experimental conditions, we suggest that the dissolved Mo might not be the main contributor for the toxic response caused by the high concentrations of CS-MoS2 micro-sheets. We also noticed that CS-MoS2 micro-sheets contained a certain amount of chitosan (CS). Chitosan is a natural polymer, which shows perfect biocompatibility.44 We assumed that CS was not the main component of CS-MoS2 micro-sheets since a large amount of CS had already been washed away during the preparation process. Therefore, CS might not be the main reason for the toxicity of CS-MoS2 micro-sheets. Apart from the chemical element composition, other physicochemical properties of MoS2 such as surface area and active edge sites will also significantly affect its toxicity. For instance, MoS2 with the increased exfoliation exhibited stronger toxicities toward the human lung carcinoma epithelial cells, which was probably caused by the increased edge sites.9 Our previous work also showed that MoS2 sheets destroyed the membrane stability and led to ROS accumulation in E. coli due to their discrete crystal planes and surface defects.6 In an aquatic environment, dispersible nanomaterials can easily contact with the gill and other organs in fish through respiration and its dietary cycle.45 Zhao et al. proposes that the contact of 2DMs such as graphene to the cells or tissues of aquatic organisms can lead to physical membrane damages due to the extracting and cutting effects. Furthermore, ion/gas exchange of the cells or tissues will be blocked when their external surfaces are covered by 2DMs, which in turn could lead to indirect toxicity.46 Therefore, it will be plausible to claim that dispersible CS-MoS2 micro-sheets contact with the gill and liver of zebrafish via the respiration and dietary way, and then cause adverse outcomes by extracting or cutting the cell membrane, and blocking the ion/gas exchange of the cells.
5. Conclusion
Overall, we prepared water-dispersible CS-MoS2 micro-sheets and evaluated the aquatic toxicity of CS-MoS2 micro-sheets in the gills and livers of zebrafish. We found that exposure to 20 mg L−1 of CS-MoS2 micro-sheets significantly impaired the tissue structures of gill and liver. Moreover, the treatment with 20 mg L−1 of CS-MoS2 micro-sheets further perturbed the gene expressions of antioxidant enzymes and led to the proinflammatory response and apoptosis in gill and liver samples of zebrafish. This study provides new insights regarding the aquatic toxicity of dispersible MoS2 and other new 2DMs.Statement of contributions
Yadong Yu and Yanliang Yi conceived the experimental design and wrote the manuscript; Yangying Li, Ting Peng, Shanli Lao, Jiahao Zhang, Shaocui Liang, Yan Xiong, Shasha Shao and Na Wu conducted the experiments; Ye Zhao and He Huang financially supported this project and revised the manuscript.Conflicts of interest
There are no conflicts to declare.Acknowledgements
This work was supported by National Natural Science Foundation of China (No. 21506096, 21776136), National High Technology Research and Development Program of China (No. 2013AA020302, 2014AA021703), the Jiangsu Synergetic Innovation Center for Advanced Bio-Manufacture (No. XTE1848, XTC1810), Chief Specialist Program of Jiangsu Association for Science and Technology, SICAM Scholarship, the Program for Innovative Research Team in Universities of Jiangsu Province (2015) and Top-notch Academic Programs Project of Jiangsu Higher Education Institutions PPZY2015B155, TAPP. We want to thank Dr Michael Burkard for polishing the language.References
- R. Mas-Balleste, C. Gomez-Navarro, J. Gomez-Herrero and F. Zamora, Nanoscale, 2011, 3, 20–30 RSC.
- B. Radisavljevic, A. Radenovic, J. Brivio, V. Giacometti and A. Kis, Nat. Nanotechnol., 2011, 6, 147–150 CrossRef PubMed.
- R. Kurapati, K. Kostarelos, M. Prato and A. Bianco, Adv. Mater., 2016, 28, 6052–6074 CrossRef PubMed.
- N. Qureshi, R. Patil, M. Shinde, G. Umarji, V. Causin, W. Gade, U. Mulik, A. Bhalerao and D. P. Amalnerkar, Appl. Nanosci., 2014, 5, 331–341 CrossRef.
- P. Shah, T. N. Narayanan, C. Z. Li and S. Alwarappan, Nanotechnology, 2015, 26, 315102 CrossRef PubMed.
- N. Wu, Y. Yu, T. Li, X. Ji, L. Jiang, J. Zong and H. Huang, PLoS One, 2016, 11, e0167245 Search PubMed.
- Y. D. Yu, Q. Yang, N. Wu, H. L. Tang, Y. L. Yi, G. H. Wang, Y. L. Ge, J. J. Zong, C. Madzak, Y. Zhao, L. Jiang and H. Huang, J. Nanosci. Nanotechnol., 2018, 18, 3901–3907 CrossRef PubMed.
- Q. Yang, L. Zhang, A. Ben, N. Wu, Y. Yi, L. Jiang, H. Huang and Y. Yu, Chemosphere, 2018, 198, 216–225 CrossRef PubMed.
- E. L. K. Chng, Z. Sofer and M. Pumera, Nanoscale, 2014, 6, 14412–14418 RSC.
- E. Karwowska, M. Kostecki, A. Sokolowska, R. Chodun and K. Zdunek, Int. J. Appl. Ceram. Technol., 2015, 12, 885–890 CrossRef.
- W. Z. Teo, E. L. Chng, Z. Sofer and M. Pumera, Chemistry, 2014, 20, 9627–9632 CrossRef PubMed.
- Z. Y. Wang and B. X. Mi, Environ. Sci. Technol., 2017, 51, 8229–8244 CrossRef PubMed.
- A. Montagner, S. Bosi, E. Tenori, M. Bidussi, A. A. Alshatwi, M. Tretiach, M. Prato and Z. Syrgiannis, 2D Mater., 2017, 4, 012001 CrossRef.
- L. M. Skjolding, S. N. Sorensen, N. B. Hartmann, R. Hjorth, S. F. Hansen and A. Baun, Angew. Chem., Int. Ed., 2016, 55, 15224–15239 CrossRef PubMed.
- X. Wang, N. D. Mansukhani, L. M. Guiney, Z. X. Ji, C. H. Chang, M. Y. Wang, Y. P. Liao, T. B. Song, B. B. Sun, R. B. Li, T. Xia, M. C. Hersam and A. E. Nel, Small, 2015, 11, 5079–5087 CrossRef PubMed.
- S. J. Klaine, P. J. J. Alvarez, G. E. Batley, T. F. Fernandes, R. D. Handy, D. Y. Lyon, S. Mahendra, M. J. McLaughlin and J. R. Lead, Environ. Toxicol. Chem., 2008, 27, 1825–1851 CrossRef PubMed.
- T. Liu, C. Wang, X. Gu, H. Gong, L. Cheng, X. Z. Shi, L. Z. Feng, B. Q. Sun and Z. Liu, Adv. Mater., 2014, 26, 3433–3440 CrossRef PubMed.
- W. Yin, L. Yan, J. Yu, G. Tian, L. Zhou, X. Zheng, X. Zhang, Y. Yong, J. Li, Z. Gu and Y. Zhao, ACS Nano, 2014, 8, 6922–6933 CrossRef PubMed.
- U. J. Pyati, A. T. Look and M. Hammerschmidt, Semin. Cancer Biol., 2007, 17, 154 CrossRef PubMed.
- W. Zhang, Y. Wang, D. Zhang, S. Yu, W. Zhu, J. Wang, F. Zheng, S. Wang and J. Wang, Nanoscale, 2015, 7, 10210–10217 RSC.
- S. Zhuo, Y. Xu, W. Zhao, J. Zhang and B. Zhang, Angew. Chem., Int. Ed., 2013, 52, 8602–8606 CrossRef PubMed.
- H. Li, Q. Zhang, C. C. R. Yap, B. K. Tay, T. H. T. Edwin, A. Olivier and D. Baillargeat, Adv. Funct. Mater., 2012, 22, 1385–1390 CrossRef.
- Y. D. Yu, N. Wu, Y. L. Li, Y. Y. Li, L. Zhang, Q. Yang, W. J. Miao, X. F. Ding, L. Jiang and H. Huang, ACS Biomater. Sci. Eng., 2017, 3, 3261–3272 CrossRef.
- Z. Wang, A. von dem Bussche, Y. Qiu, T. M. Valentin, K. Gion, A. B. Kane and R. H. Hurt, Environ. Sci. Technol., 2016, 50, 7208–7217 CrossRef PubMed.
- X. M. Feng, X. Wang, W. Y. Xing, K. Q. Zhou, L. Song and Y. Hu, Compos. Sci. Technol., 2014, 93, 76–82 CrossRef.
- J. Zhao, Z. Wang, J. C. White and B. Xing, Environ. Sci. Technol., 2014, 48, 9995–10009 CrossRef PubMed.
- M. Chen, J. Yin, Y. Liang, S. Yuan, F. Wang, M. Song and H. Wang, Aquat. Toxicol., 2016, 174, 54–60 CrossRef PubMed.
- J. d. S. Filho, E. Y. Matsubara, L. P. Franchi, I. P. Martins, L. M. R. Rivera, J. M. Rosolen and C. K. Grisolia, Environ. Res., 2014, 134, 9–16 CrossRef PubMed.
- J. P. Souza, J. F. Baretta, F. Santos, I. M. M. Paino and V. Zucolotto, Aquat. Toxicol., 2017, 186, 11–18 CrossRef PubMed.
- J. E. Choi, S. Kim, J. H. Ahn, P. Youn, J. S. Kang, K. Park, J. Yi and D. Y. Ryu, Aquat. Toxicol., 2010, 100, 151–159 CrossRef PubMed.
- L. Ma, J. Liu, N. Li, J. Wang, Y. Duan, J. Yan, H. Liu, H. Wang and F. Hong, Biomaterials, 2010, 31, 99–105 CrossRef PubMed.
- J. M. Mates, Toxicology, 2000, 153, 83–104 CrossRef PubMed.
- R. K. Gupta, R. A. Schuh, G. Fiskum and J. A. Flaws, Toxicol. Appl. Pharmacol., 2006, 216, 436–445 CrossRef PubMed.
- T. Yamamoto, R. Kikkawa, H. Yamada and I. Horii, J. Toxicol. Sci., 2005, 30, 213–227 CrossRef PubMed.
- K. Nakahira, J. A. Haspel, V. A. Rathinam, S. J. Lee, T. Dolinay, H. C. Lam, J. A. Englert, M. Rabinovitch, M. Cernadas, H. P. Kim, K. A. Fitzgerald, S. W. Ryter and A. M. Choi, Nat. Immunol., 2011, 12, 222–230 CrossRef PubMed.
- E. Naik and V. M. Dixit, J. Exp. Med., 2011, 208, 417–420 CrossRef PubMed.
- S. Bird, J. Zou and C. J. Secombes, Curr. Pharm. Des., 2006, 12, 3051–3069 CrossRef PubMed.
- H. U. Simon, A. Haj-Yehia and F. Levi-Schaffer, Apoptosis, 2000, 5, 415–418 CrossRef PubMed.
- C. Cande, I. Cohen, E. Daugas, L. Ravagnan, N. Larochette, N. Zamzami and G. Kroemer, Biochimie, 2002, 84, 215–222 CrossRef PubMed.
- J. M. Adams and S. Cory, Science, 1998, 281, 1322–1326 CrossRef PubMed.
- U. Langheinrich, E. Hennen, G. Stott and G. Vacun, Curr. Biol., 2002, 12, 2023–2028 CrossRef PubMed.
- R. D. Handy, R. Owen and E. Valsami-Jones, Ecotoxicology, 2008, 17, 315–325 CrossRef PubMed.
- G. M. Ward, J. Anim. Sci., 1978, 46, 1078–1085 CrossRef PubMed.
- T. Kean and M. Thanou, Adv. Drug Delivery Rev., 2010, 62, 3–11 CrossRef PubMed.
- X. J. He, W. G. Aker, P. P. Fu and H. M. Hwang, Environ. Sci.: Nano, 2015, 2, 564–582 RSC.
- J. Zhao, Z. Y. Wang, J. C. White and B. S. Xing, Environ. Sci. Technol., 2014, 48, 9995–10009 CrossRef PubMed.
Footnotes |
| † Electronic supplementary information (ESI) available. See DOI: 10.1039/c8ra00922h |
| ‡ These authors contributed equally to this work. |
| This journal is © The Royal Society of Chemistry 2018 |

