 Open Access Article
Creative Commons Attribution 3.0 Unported Licence
Synthesis, electronic structures, and photoluminescence properties of an efficient and thermally stable red-emitting phosphor Ca3ZrSi2O9:Eu3+,Bi3+ for deep UV-LEDs
Jiyou Zhong a,
Weiren Zhao*a,
Lunwei Yangb,
Peng Shia,
Zifeng Liaoa,
Menglong Xiaa,
Wenhua Pub,
Wei Xiaob and
Ligen Wang*b
aSchool of Physics and Optoelectronic Engineering, Guangdong University of Technology, Guangzhou 510006, China. E-mail: zwren123@126.com
bCenter for Computing and Simulation of Advanced Materials, State Key Laboratory of Nonferrous Metals and Processes, General Research Institute for Nonferrous Metals, Beijing 100088, China. E-mail: lg_wang1@yahoo.com
First published on 9th April 2018
Abstract
A series of red-emitting Ca3ZrSi2O9:Eu3+,xBi3+ phosphors was synthesized using a conventional high temperature solid-state reaction method, for the purpose of promoting the emission efficiency of Eu3+ in a Ca3ZrSi2O9 host. The site preference of Bi3+ and Eu3+ in the Ca3ZrSi2O9 host was evaluated by formation energy. The effects of Bi3+ on electronic structure, luminescent properties, and related mechanisms were investigated. The inner quantum yield of the optimized sample increased to 72.9% (x = 0.08) from 34.6% (x = 0) at 300 nm ultraviolet light excitation. The optimized sample (x = 0.08) also showed excellent thermal stability, and typically, 84.2% of the initial emission intensity was maintained when the temperature increased to 150 °C from 25 °C, which is much higher than that without Bi3+ doping (70.1%). The mechanisms of emission properties and thermal stability enhancement, as well as the redshift of the charge transfer band (CTB) induced by Bi3+ doping in the Ca3ZrSi2O9:Eu3+ phosphor, were discussed. This study elucidates the photoluminescence properties of Bi3+-doped Ca3ZrSi2O9:Eu3+ phosphor, and indicates that it is a promising luminescent material that can be used in ultraviolet light-emitting diodes.
1. Introduction
Phosphor-converted white light-emitting diodes (pc-WLEDs) have the advantages of long lifetime, high luminous efficacy, and environmental friendliness, and are becoming an indispensable solid-state light source in our daily life.1–5 However, conventional WLEDs using blue InGaN chips combined with phosphors are very likely to cause health problems because excessive exposure to monochromatic blue light often results from their use.6,7 Therefore, ultraviolet (UV) LEDs combined with phosphors are an important and promising alternative for the fabrication of full spectrum lighting sources that are healthy and comfortable to human beings.8,9 With their rapid development, UV LEDs are mainly divided into near-UV LEDs (300–400 nm) and deep UV LEDs (200–300 nm).10 Correspondingly, new highly efficient and thermally stable phosphors should be rapidly developed so as to match the emission wavelength of UV LED chips.11 Generally, Y2O3:Eu3+ is considered a red-emitting phosphor for UV LEDs that are solely composed of rare earth elements. Because rare earth elements are non-renewable resources, it is necessary to develop efficient and thermally stable red-emitting phosphors with inexpensive raw materials and comparative properties to replace the use of Y2O3:Eu3+ in UV LEDs.Recently, Kim et al. reported a cuspidine-type Ca3ZrSi2O9:Eu3+ red-emitting phosphor possessing a relative emission intensity that reached 84% of commercial red-emitting Y1.94Eu0.06O3 phosphors, and it seemed promising as a replacement for Y2O3:Eu3+, but the inner quantum yield was only 41% at 268 nm excitation.12 In order to further enhance the emission efficiency, Zuo et al. tried to partially substitute Zr4+ ions with Al3+ ions in the host Ca3ZrSi2O9, and finally the inner quantum yield was increased to 46%.13 This enhancement was mainly ascribed to the charge compensation effect, which is helpful for improving the crystallinity of the phosphors. However, the relatively low quantum yield still limits its practical use.
Here, we report another route for enhancing the quantum yield of this phosphor by introducing the sensitizer Bi3+ into the lattice. It is known that Bi3+ has an ns2-type ground state electric configuration (1S0 state) and 1S0 → 3P1 and 1S0 → 1P1 spin-allowed transitions, which are expected to have a reasonable absorption strength.14 The aborted energy can be efficiently transferred to luminescence center ions, such as Eu3+ and Mn4+, which act as a sensitizer, or directly emitting photons, acting as a luminescence center due to the transitions of 3P1 → 1S0 and 1P1 → 1S0.15–19 For this reason, many commercially available Eu3+-activated phosphors, such as Y2O3:Eu3+ and Y(P,V)O4:Eu3+, adopt Bi3+ as sensitizer.20–22 In this approach, the inner quantum yield of Ca3ZrSi2O9:Eu3+,Bi3+ was greatly promoted, and the thermal stability was also enhanced. To further understand this enhancement, first principles calculations were performed to investigate the site preference of dopants and electronic structure variations induced by Bi3+ doping. The synthesis and photoluminescence properties were also experimentally characterized in detail. The photoluminescence investigation demonstrates that the Ca3ZrSi2O9:Eu3+,Bi3+ phosphor is a promising red-emitting phosphor that can be incorporated into UV LEDs.
2. Methodology
2.1 Experimental details
The samples with formula (Ca2.83−xEu0.17Bix)ZrSi2O9 (x = 0–0.16) were synthesized by the high-temperature solid-state reaction method. The starting materials consisting of CaCO3 (Aldrich, 99.95%), Bi2O3 (Aldrich, 99.9%), ZrO2 (Aldrich, 99.5%), SiO2 (Aldrich, 99.99%) and Eu2O3 (Aldrich, 99.95%) were weighed according to the stoichiometric ratio. The mixed powder was evenly ground in an agate mortar, and then the homogeneous mixtures were placed in an alumina crucible and continually heated at 1400 °C in an air atmosphere for 6 h. The samples were gradually cooled to room temperature and then ground once more until a fine powder was obtained.The powder X-ray diffraction (XRD) patterns were measured using an X-ray powder diffractometer (Rigaku, Japan) with Cu-Kα radiation (λ = 1.5406 Å). The photoluminescence spectra and the decay curves of Eu3+ lifetime values were measured using a FLS-980 fluorescence spectrophotometer (Edinburgh Instruments) equipped with a xenon lamp (450 W, Osram) as the excitation source. The quantum yield and temperature-dependent emission spectra were measured using the QE-2100 quantum yield measurement system (Otsuka Electronics Co., Ltd., Japan), composed of an integrating sphere, a heating apparatus, and a Xe lamp used as an excitation source and white BaSO4 powder as a reference.
2.2 Computational details
Structural optimization of Ca3ZrSi2O9, Ca3ZrSi2O9:Bi3+, and Ca3ZrSi2O9:Eu3+ was firstly performed using the density functional theory (DFT) method with the Perdew–Burke–Ernzerhof (PBE) exchange-correlation functional,23 as implemented in the VASP software package.24,25 The electronic properties of Ca3ZrSi2O9:Bi3+ were then calculated based on the optimized geometries using the hybrid PBE functional. The Ca3ZrSi2O9 host crystal containing 60 atoms was used as the computational model. The Ca 3s23p64s2, Zr 4s24p65s24d2, Si 3s23p2, O 2s22p4, Bi 5d106s26p3, and Eu 5s25p64f65d16s2 electrons were treated as the valence electrons, whose interactions with the ion cores were treated with the projected augmented wave (PAW) method.26 The geometric structures were fully relaxed with the convergence criteria of 10−6 eV used for the change in the total energy and 0.01 eV Å−1 used for Hellmann–Feynman forces on atoms. The cut-off energy of 550 eV was used for the basis set of the plane waves. The Brillouin zone integrations were sampled using a 4 × 2 × 2 Monkhorst–Pack k-point mesh.3. Results and discussion
3.1 Phase purity, crystal structure, and site preference of dopants
Fig. 1 presents the powder XRD patterns for the synthesized (Ca2.83−xEu0.17Bix)ZrSi2O9 (x = 0–0.16) samples compared with the standard pattern (PDF no. 54-0710) for Ca3ZrSi2O9. All the diffraction peaks of these samples can be indexed to the P21/c space group (no. 14) of the monoclinic system,27 indicating that a single phase with high purity has been synthesized, and the doped Bi3+ and Eu3+ did not generate any impurity or induce significant changes in the host structure. The Ca3ZrSi2O9 compound can be regarded as being derived from the well-known cuspidine Ca4Si2O7F2 by substituting Zr-O2 for Ca-F2.28 Thus, the crystal structure (shown in Fig. 2) of Ca3ZrSi2O9 is similar to Ca4Si2O7F2, composed of [SiO4] tetrahedrons, [ZrO6] octahedrons, [CaO6] octahedrons, and [CaO7] decahedrons, forming a three dimensional network. There are three types of Ca2+ sites and one type of Zr4+ site, and they are available for Eu3+ and Bi3+ to occupy.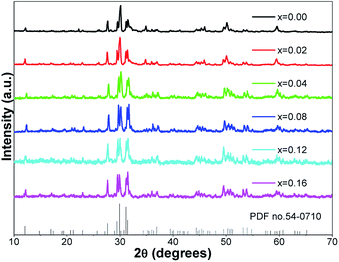 | ||
| Fig. 1 Powder XRD patterns of the synthesized (Ca2.83−xEu0.17Bix)ZrSi2O9 (x = 0–0.16) samples, and the standard card (PDF no. 54-0710) of Ca3ZrSi2O9 is given for comparison. | ||
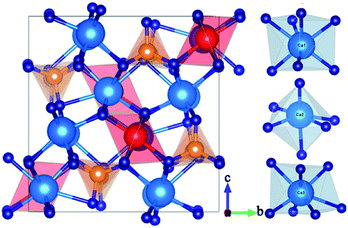 | ||
| Fig. 2 Crystal structure of Ca3ZrSi2O9 views along the (100) direction; and three types of Ca sites, namely, Ca1, Ca2, and Ca3 with seven-, six-, and seven-coordinations, respectively. | ||
To identify the site preference, the formation energy Eform was calculated according to the following equation:29,30
| Eform = EM:CZSO − ECZSO + μCa or Zr − μM | (1) |
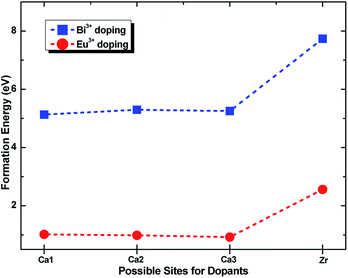 | ||
| Fig. 3 Formation energy of Eu3+ and Bi3+ doping into Zr4+ and three types of Ca2+ sites in the Ca3ZrSi2O9 host. | ||
3.2 Electronic structure of Bi3+-doped and undoped Ca3ZrSi2O9
Fig. 4a presents the total and partial density of states (DOSs) of the Ca3ZrSi2O9 host. As shown, the conduction band is mainly composed of Ca 3d and Zr 4d states, which show a hybridization character with O 2p and Si 3p states. The bottom of the conduction band is mainly determined by Zr 4d states. The top of the valence band reflects the p electronic character, deriving from O 2p states. The valence bands at the lower energy are mainly attributed to Si 3s/3p and O 2s/2p states. The band gap is calculated to be 4.59 eV, corresponding to the optical absorption at 270 nm of Zr4+–O2−. This energy value is slightly underestimated compared to the experimentally observed value of 255 nm,31 due to the drawback of the DFT method.32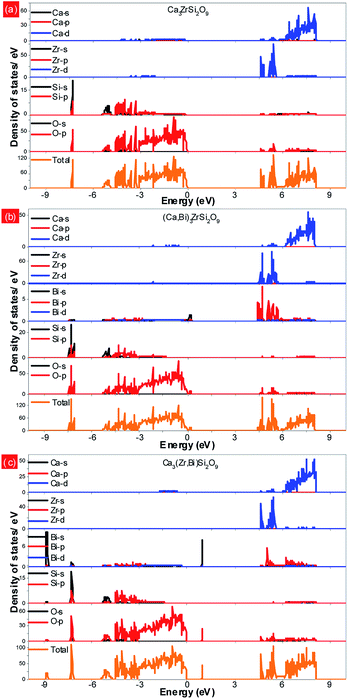 | ||
| Fig. 4 Total and partial density of states of the (a) Ca3ZrSi2O9 host; (b) Bi3+ doping into the Ca(1) site; and (c) Bi3+ doping into the Zr4+ site. | ||
Fig. 4b shows the total and partial density of states of Bi doped in the most possible Ca(1) site. In this case, the bottom of the conduction band is mainly composed of Zr 4d and Bi 6p states, and a strong hybridization between them can be observed. The p electronic character of the O 2p states remains at the top of the valence band. Additionally, the Bi 6s states emerge at the band gap, slightly above the top of the valence band (by approximately 0.18 eV), presenting a strong hybridization with O 2p states. The band gap is reduced to 4.41 eV.
The total and partial density of states of Bi doped in the Zr site were also investigated and are presented in Fig. 4c. In this situation, the Bi 6p states are higher than the Zr 4d states, and thus, the bottom of the conduction band is determined by the Zr 4d states. The top of the valence band still presents the p electronic character of O 2p states, while the location of Bi 6s is significantly higher than that with Bi doping at the Ca(1) site. Also, a strong hybridization between the Bi 6s and O 2p states can be detected. The band gap is not influenced by the doped Bi and remained at 4.59 eV.
3.3 Photoluminescence properties of Ca3ZrSi2O9:Eu3+,xBi3+
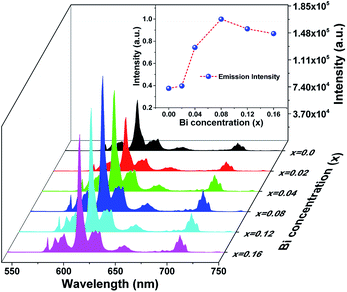
The photoluminescence emission (PL) spectra of samples (Ca2.83−xEu0.17Bix)ZrSi2O9 (x = 0–0.16) excited by 300 nm UV light are presented in Fig. 5. As shown, the spectrum exhibits typical characteristics of Eu3+, with several sharp emission peaks located at 579 nm, 586/595 nm, 610/622/626/630 nm, 648/654 nm, and 704/707/709/712 nm corresponding to the transitions of 5D0 → 7FJ (J = 0–4),33,34 respectively. The emission intensity gradually increases and then decreases with the increasing concentration of Bi3+ doping. The optimized Bi3+ concentration is x = 0.08, with an inner quantum yield of 72.9% and external quantum yield of 59.7% under 300 nm excitation, while the sample without Bi3+ doping has an inner quantum yield of 34.6% and external quantum yield of 27.3% under the same measured conditions. This emission enhancement is mainly ascribed to the sensitization provided by Bi3+ because Bi3+ can absorb energy through 1S0 → 3P1 and 1S0 → 1P1 transitions and transfer its energy to Eu3+, improving the absorbance of this phosphor. However, when the Bi3+ doping concentration exceeds x = 0.08, more defects may form due to nonequivalence substitution, resulting in a slight decrease in emission intensity.35The normalized photoluminescence excitation spectra of (Ca2.83−xEu0.17Bix)ZrSi2O9 (x = 0 and 0.08) monitored at 610 nm are compared and shown in Fig. 6. It can be observed that the excitation peaks ascribing to f–f transitions of Eu3+ are in good agreement at each wavelength, while the charge transfer band (CTB) presents a redshift of approximately 10 nm (approximately 0.14 eV) when Bi3+ was introduced in this phosphor, which indicates that the 4f energy levels are not influenced by Bi3+ doping, but the band gap and Eu3+–O2− interactions may have been affected.16,36 This redshift is mainly ascribed to the existence of a hybrid level constituted by O 2p and Bi 6s states above the valence band, which decrease the energy between the O 2p and Eu 4f states. The energy difference (approximately 0.14 eV) corresponding to the redshift in CTB is very close to the energy separation (approximately 0.18 eV) between the above mentioned hybrid level and the top of the valence band obtained by DFT calculation (shown in Fig. 4b), which further confirms that Bi3+ prefers to enter Ca2+ sites, especially the Ca(1) site. Additionally, we can also find the redshift of the Zr4+–O2− absorption band at a high energy, and this shift should be ascribed to the lowering of the conduction band induced by Bi3+ doping. The involved energy level variations are shown in the sketch inserted in Fig. 6.
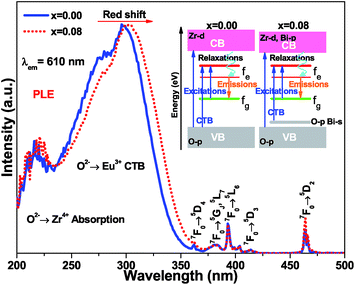 | ||
| Fig. 6 The normalized photoluminescence excitation spectra of (Ca2.83−xEu0.17Bix)ZrSi2O9 (x = 0 and 0.08) monitored at 610 nm. A sketch of involved energy level variations was inserted. | ||
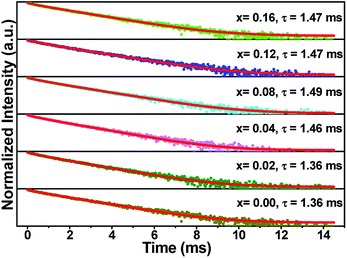
Fig. 7 illustrates the normalized fluorescence decay curves of (Ca2.83−xEu0.17Bix)ZrSi2O9 (x = 0–0.16) excited by 300 nm UV light and monitored at 610 nm. These decay curves are unable to be fitted by a single exponential function, but can be well fitted by a two-exponential function. Generally, Eu3+ occupies three types of Ca2+ sites, and it is more reasonable to fit the decay curves by a three-exponential function than a two-exponential function. However, due to the similarity between the coordination numbers and symmetry of the Ca(1) site and the Ca(3) site, Eu3+ enters either the Ca(1) site or Ca(3) site, and the luminescent properties are quite similar. Thus, it is reasonable to fit the decay curves by a two-exponential function. In this method, the decay times were determined to be 1.36 ms, 1.36 ms, 1.46 ms, 1.49 ms, 1.47 ms, and 1.47 ms for (Ca2.83−xEu0.17Bix)ZrSi2O9 (x = 0–0.16) phosphors with increasing Bi3+ concentration. In terms of the values of decay times, it is difficult to find obvious regularity, but a trend is exhibited of first an increase and then a decrease. The reason for the increased decay time is mainly due to the energy transfer from Bi3+ to Eu3+, while a further increase in Bi3+ concentration will create more defects that trap the excited electrons, reducing the decay times.37,38
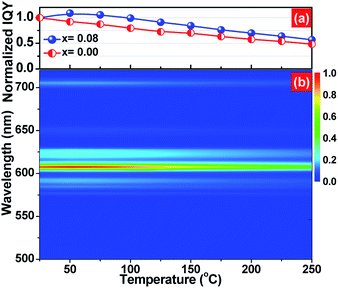
The thermal quenching property, namely emission loss with increasing temperature, is one of the key application criteria for practical phosphors.39 The temperature-dependent normalized inner quantum yield of (Ca2.83−xEu0.17Bix)ZrSi2O9 (x = 0 and 0.08) phosphors under 300 nm UV excitation are presented in Fig. 8a. It can be detected that the Bi3+-doped phosphor has better thermal stability than that without Bi3+ doping at any point in the measured temperature range (25–250 °C). We observed that the quantum yield as well as emission intensity (shown as Fig. 8b) first increases up to a temperature of 50 °C and then decreases in the (Ca2.83−xEu0.17Bix)ZrSi2O9 (x = 0.08) phosphor. The photoluminescence (PL) intensity increase is generally ascribed to the formation of defect levels in the phosphor, which can capture electrons and then release them with increasing temperature, causing the increase of the PL intensity.40,41 Because of the effect of defects in increasing the thermal stability, this Bi3+-doped phosphor can remain at 84.2% of the initial quantum yield (at room temperature) when the temperature was increased up to 150 °C. The yield is better than that of Y2O3:Eu3+ (approximately 81%) and comparable to commercial Sr2Si5N8:Eu2+ (approximately 85%),42–44 and is much higher than that without Bi3+ doping (70.1%). This thermal stability enhancement is different from the traditional reduction of cross relaxation or thermal ionization,45,46 mainly ascribing to the appropriate amount of defects created by Bi3+ doping.
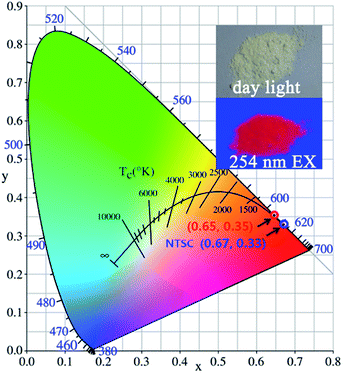
Furthermore, the CIE chromaticity coordinates for (Ca2.83−xEu0.17Bix)ZrSi2O9 (x = 0–0.16) excited at 300 nm were calculated, but the values were the same, which reflects the fact that Bi3+ doping did not change the occupancy of Eu3+ at any type of Ca2+ site. The CIE chromaticity coordinates were determined to be (0.65, 0.35) (depicted in Fig. 9), which are close to those of standard red (0.67, 0.33) given by the NTSC (National Television Standards Committee).47 Additionally, a digital photo of the (Ca2.83−xEu0.17Bix)ZrSi2O9 (x = 0.08) phosphor under daylight and a 254 nm UV lamp is shown in the inset of Fig. 9, demonstrating an intense red light emission from this phosphor under UV light excitation. With further synthetic process optimization, the luminescent properties of this phosphor are expected to be further promoted.
4. Conclusions
We have synthesized (Ca2.83−xEu0.17Bix)ZrSi2O9 (x = 0–0.16) phosphors by a conventional high-temperature solid-state reaction method using inexpensive raw materials. The DFT calculation demonstrates that the doped Bi3+ and Eu3+ prefer to occupy Ca2+ sites. The redshift of the charge transfer band (CTB) induced by Bi3+ doping of the Ca3ZrSi2O9:Eu3+ phosphor should be ascribed to the existence of a hybrid level constituted by the O 2p and Bi 6s states located above the valence band. The inner quantum yield of the optimized sample with x = 0.08 was promoted to 72.9%, due to the efficient sensitizing of Eu3+ with Bi3+. The formation of the appropriate amount of defects created by nonequivalence substitution, namely Bi3+ substituting Ca2+, is beneficial for increasing the thermal stability of Eu3+ in this phosphor. The optimized sample can remain at 84.2% of the initial quantum yield (at room temperature) when the temperature was raised to 150 °C. These parameters indicate that the Bi3+-doped Ca3ZrSi2O9:Eu3+ phosphor exhibits a particularly high quantum yield and excellent thermal stability, and can serve as red-emitting phosphors for future deep UV LEDs.Conflicts of interest
There are no conflicts of interest to declare.Acknowledgements
This present work was financially supported by the National Basic Research Program of China (2014CB643801); the National Natural Science Foundation of China (No. 51702057); China Postdoctoral Science Foundation (2017M622627); Major Program for Cooperative Innovation of Production, Education & Research of Guangzhou City (201704030106; 201604016029); and Science and Technology Planning Projects of Guangdong Province of China (2014B050505020; 2016201604030035).Notes and references
- S. Pimputkar, J. S. Speck, S. P. DenBaars and S. Nakamura, Nat. Photonics, 2009, 3, 180 CrossRef CAS
.
- X. Huang, Nat. Photonics, 2014, 8, 748 CrossRef CAS
.
- E. F. Schubert and J. K. Kim, Science, 2005, 308, 1274 CrossRef CAS PubMed
.
- P. Pust, V. Weiler, C. Hecht, A. Tücks, A. S. Wochnik, A. K. Henß, D. Wiechert, C. Scheu, P. J. Schmidt and W. Schnick, Nat. Mater., 2014, 13, 891 CrossRef CAS PubMed
.
- C. C. Lin and R. S. Liu, J. Phys. Chem. Lett., 2011, 2, 1268 CrossRef CAS PubMed
.
- C. Cajochen, S. Frey, D. Anders, J. Späti, M. Bues, A. Pross, R. Mager, A. Wirz-Justice and O. Stefani, J. Appl. Physiol., 2011, 110, 1432 CrossRef PubMed
.
- A. Haim and A. E. Zubidat, Chronobiol. Int., 2015, 32, 725 CrossRef PubMed
.
- M. H. Fang, C. Ni, X. Zhang, Y. T. Tsai, S. Mahlik, A. Lazarowska, M. Grinberg, H. S. Sheu, J. F. Lee, B. M. Cheng and R. S. Liu, ACS Appl. Mater. Interfaces, 2016, 8, 30677 CAS
.
- C. Yan, Z. Liu, W. Zhuang, R. Liu, X. Xing, Y. Liu, G. Chen, Y. Li and X. Ma, Inorg. Chem., 2017, 56, 11087 CrossRef CAS PubMed
.
- Y. Muramoto, M. Kimura and S. Nouda, Semicond. Sci. Technol., 2014, 29, 084004 CrossRef
.
- L. Chen, K. J. Chen, C. C. Lin, C. I. Chu, S. F. Hu, M. H. Lee and R. S. Liu, J. Comb. Chem., 2010, 12, 587 CrossRef CAS PubMed
.
- S. W. Kim, Y. Zuo, T. Masui and N. Imanaka, ECS Solid State Lett., 2013, 2, R34 CrossRef CAS
.
- Y. Zuo, S. W. Kim, T. Masui and N. Imanaka, ECS J. Solid State Sci. Technol., 2014, 3, R79 CrossRef CAS
.
- G. Blasse and A. Bril, J. Chem. Phys., 1968, 48, 217 CrossRef CAS
.
- H. Zhou, M. Jiang and Y. Jin, RSC Adv., 2014, 4, 45786 RSC
.
- F. Kang, H. Zhang, L. Wondraczek, X. Yang, Y. Zhang, D. Y. Lei and M. Peng, Chem. Mater., 2016, 28, 2692 CrossRef CAS
.
- L. Li, Y. Pan, Z. Chen, S. Huang and M. Wu, RSC Adv., 2017, 7, 14868 RSC
.
- X. Yu, L. Zhang, X. Xu, T. Wang, H. Yu, T. Jiang, Q. Jiao, Z. Yang, D. Zhou and J. Qiu, J. Lumin., 2014, 145, 114 CrossRef CAS
.
- F. Kang, Y. Zhang and M. Peng, Inorg. Chem., 2015, 54, 1462 CrossRef CAS PubMed
.
- Q. Su, C. Barthou, J. P. Denis, F. Pelle and B. Blanzat, J. Lumin., 1983, 28, 1 CrossRef CAS
.
- M. Darbandi, W. Hoheisel and T. Nann, Nanotechnology, 2006, 17, 4168 CrossRef CAS PubMed
.
- T. S. Chan, C. C. Kang, R. S. Liu, L. Chen, X. N. Liu, J. J. Ding, J. Bao and C. Gao, J. Comb. Chem., 2007, 9, 343 CrossRef CAS PubMed
.
- P. Perdew, K. Burke and M. Ernzerhof, Phys. Rev. Lett., 1996, 77, 3865 CrossRef PubMed
.
- G. Kresse and J. Furthmüller, Phys. Rev. B: Condens. Matter Mater. Phys., 1996, 54, 11169 CrossRef CAS
.
- G. Kresse and D. Joubert, Phys. Rev. B: Condens. Matter Mater. Phys., 1999, 59, 1758 CrossRef CAS
.
- P. E. Blöchl, Phys. Rev. B: Condens. Matter Mater. Phys., 1994, 50, 17953 CrossRef
.
- J. R. Plaister, J. Jansen, R. A. G. de Graaff and D. J. W. IJdo, J. Solid State Chem., 1995, 115, 464 CrossRef
.
- E. Burzo, Sorosilicates, Springer Berlin Heidelberg, 2005, vol. 2712, p. 142 Search PubMed
.
- S. Jang, J. Im, B. K. Bang, C. H. Kim, H. Chang and K. j. Kong, RSC Adv., 2015, 5, 39319 RSC
.
- Z. Wang, B. Shen, F. Dong, S. Wang and W. S. Su, Phys. Chem. Chem. Phys., 2015, 17, 15065 RSC
.
- G. Blassea, G. Bernardi, D. J. W. Ijdob and J. R. Plaisier, J. Alloys Compd., 1995, 217, 29 CrossRef
.
- J. Wen, L. Ning, C. K. Duan, Y. Chen, Y. Zhang and M. Yin, J. Phys. Chem. C, 2012, 116, 20513 CAS
.
- Q. Zhang, X. Wang, X. Ding and Y. Wang, Inorg. Chem., 2017, 56, 6990 CrossRef CAS PubMed
.
- J. Huo, L. Dong, W. Lü, B. Shao and H. You, Phys. Chem. Chem. Phys., 2017, 19, 17314 RSC
.
- J. Zhong, W. Zhuang, X. Xing, L. Wang, Y. Li, Y. Zheng, R. Liu, Y. Liu and Y. Hu, J. Alloys Compd., 2016, 674, 93 CrossRef CAS
.
- X. T. Wei, J. Wen, S. Li, S. Huang, J. Cheng, Y. H. Chen, C. K. Duan and M. Yin, Appl. Phys. Lett., 2014, 104, 181904 CrossRef
.
- K. Zhang, W. Hu, Y. Wu and H. Liu, Phys. B, 2008, 403, 1678 CrossRef CAS
.
- F. Du, W. Zhuang, R. Liu, Y. Liu, J. Zhong, P. Gao, X. Zhang, W. Gao and L. Shao, RSC Adv., 2017, 7, 1075 RSC
.
- J. Ueda, P. Dorenbos, A. J. J. Bos, A. Meijerink and S. Tanabe, J. Phys. Chem. C, 2015, 119, 25003 CAS
.
- Y. H. Kim, P. Arunkumar, B. Y. Kim, S. Unithrattil, E. Kim, S. H. Moon, J. Y. Hyun, K. H. Kim, D. Lee, J. S. Lee and W. B. Im, Nat. Mater., 2017, 16, 543 CrossRef CAS PubMed
.
- M. Zhang, Z. Xia and Q. Liu, J. Mater. Chem. C, 2017, 5, 7489 RSC
.
- X. Wang, Z. Zhao, Q. Wu, Y. Li and Y. Wang, Inorg. Chem., 2016, 55, 11072 CrossRef CAS PubMed
.
- C. W. Yeh, W. T. Chen, R. S. Liu, S. F. Hu, H. S. Sheu, J. M. Chen and H. T. Hintzen, J. Am. Chem. Soc., 2012, 134, 14108 CrossRef CAS PubMed
.
- L. Chen, R. H. Liu, W. D. Zhuang, Y. H. Liu, Y. S. Hu, X. F. Zhou, W. Gao and X. L. Ma, CrystEngComm, 2015, 17, 3687 RSC
.
- J. Zhong, W. Zhuang, X. Xing, R. Liu, Y. Li, Y. Liu and Y. Hu, J. Phys. Chem. C, 2015, 119, 5562 CAS
.
- X. Qin, X. Liu, W. Huang, M. Bettinelli and X. Liu, Chem. Rev., 2017, 117, 4488 CrossRef CAS PubMed
.
- A. R. Smith, ACM SIGGRAPH Computer Graphics, 1978, 12, 12 CrossRef
.
| This journal is © The Royal Society of Chemistry 2018 |

