
 Open Access Article
 This Open Access Article is licensed under a Creative Commons Attribution-Non Commercial 3.0 Unported Licence
Solid fat content and bakery characteristics of interesterified beef tallow-palm mid fraction based margarines
Zhen Zhang a,
Youn Young Shimb,
Xiang Mac,
Huihua Huang*a and
Yong Wang*d
a,
Youn Young Shimb,
Xiang Mac,
Huihua Huang*a and
Yong Wang*d
aSchool of Food Science and Engineering, South China University of Technology, 381 Wushan Road, Guangzhou, Guangdong 510641, China. E-mail: fehhuang@scut.edu.cn
bDepartment of Plant Sciences, University of Saskatchewan, 51 Campus Dr., Saskatoon SK S7N 5A8, Canada
cDivision of Chemistry and Chemical Engineering, California Institute of Technology, Pasadena, California 91125, USA
dGuangdong Saskatchewan Oil Seed Joint Laboratory, Department of Food Science and Engineering, Jinan University, 601 Huangpu Avenue West, Guangzhou, Guangdong 510632, China. E-mail: twyong@jnu.edu.cn
First published on 3rd April 2018
Abstract
Palm mid fraction (PMF) was interesterified with edible beef tallow (BT) catalyzed using sodium methoxide to investigate the effects on the solid fat content (SFC) of these palmitic rich plastic fats. Interesterified blends crystallize more slowly than BT. Conversely, the crystallization rates of PMF-BT-based interesterification (IE) products were compared with the starting mixture and IE products prepared with non-PMF triglycerides. The SFC PMF-based IE products increased significantly at temperatures between 25 and 40 °C. The SFC profiles became smoother and the products had potential to serve as base oils for preparing specialty fats with a wider range of plasticity. Further exploration of triacylglycerol (TAG) compositional changes revealed that PMF interesterified products had greater saturated/saturated/saturated (S/S/S)-type TAGs compared with soybean oil interesterified products. Moreover, in subsequent evaluations of BT-PMF-based IE fats as a margarine replacement effects in a baked cake model system showed that the material was a suitable functional oil base with acceptable aeration properties and plasticity during baking. Therefore, it is a potential alternative to IE-BT based and traditional IE-BT-palm oil based margarines. The physical-characteristics of bakery products prepared with this fat exhibited improved cake volume with fine structure and clear lifting properties, which affirmed the potential for its application in bakery fats.
1 Introduction
Solid fat content (SFC) is an important temperature dependent property of fats and oils that determines the utility of individual fats and oils or their blends in various applications. The production of specialty base oils through fractionation, interesterification, and blending has been studied intensively.1 SFC properties can be adjusted to operation temperature and season. Suitable SFC curves, to a large extent, determine plastic behaviour.2 The most frequent approach for specialty fat production is blending. However, solid/liquid blends often exhibit undesirable crystallization behaviour due to the poor compatibility, and fat products made by processing incompatible oil blends tend to exhibit sand streaking, oil leaking and other undesirable phenomena.3 Interesterification (IE) has previously been used as an approach to increase blend uniformity.Beef tallow (BT) is a co-product of meat production and is often utilized in plastic fats due to its advantageous properties, including ideal plasticity at room temperature, typical aroma after baking and formation of β′ crystals.4 Palm mid fraction (PMF), a co-product from second fractionation of palm oil or by single fractionation for palm olein has been explored as a major confectionery fat, usually after modification. Due to its valuable role in cocoa butter formulations and its widespread use in the confectionary, PMF properties have been extensively studied.1 PMF contains high percentages of the triacylglycerol (TAG) sn-1,3-dipalmitoyl-2-oleoyl-glycerol (POP). The tendency of this TAG to produce beta crystals can lead to formation of large crystalline formations in solid fat products, such as bakery fats. Using PMF in this product is a challenge as it requires the right formulation as well as controlled crystallization during.5 Thus, the use of PMF directly in bakery fat products is rather limited. In the specialty fats industry, palm stearin (PS) and PO are normally used in bakery with various SFC profiles by either IE or direct blending. Therefore, the findings in this work will contribute to the understanding of PMF or IE-PMF based bakery fats based and raise its potential value in industrial applications. The formulation of a bakery fat using PMF as a major ingredient using IE without hydrogenated fat would be a significant accomplishment.
The objective of this study was to explore traditional sodium methoxide catalyzed IE of BT with PMF (control: 80% BT + 20% SBO, sample 1: 20% BT + 80% PMF, sample 2: 30% BT + 20% SBO + 50% PMF). Two bakery fat formulations (cake margarine and puff pastry margarine) were also proposed. The SFC profile is comparable to the reference all BT-based (IE-BT) and traditional BT-palm oil-based (IE-sample A: IE-30% BT + 35% PS + 20% PO + 15% SBO) profiles. The desired formulation was achieved by IE method. The rheology and baking operation properties of margarine samples were also tested. Current lifestyle has changed our diet and food preferences. The fast-food restaurant industry is rapidly growing and bakery products are a food favoured by the younger generation. This could reflect the growing demand of bakery fat. Thus, margarine manufacturers could use the formulated BT-PMF-based IE bakery fat formulation to cater to consumer demand.
2 Materials and methods
2.1 Materials
BT, SBO, PS (iodine value = 33–35), and PO (24 °C) were provided by Masson Food Technology Co., Ltd. (Guangdong, China). PMF (45 °C) were provided by Kerry specialty fats Co., Ltd. (Shanghai, China). Bakery materials were purchased from local market (Guangdong, China). Sodium methoxide (CH3ONa), n-hexane and acetone (>99.5%) were purchased from Fuyu Chemical Co., Ltd. (Tianjin, China).2.2 Preparation of IE oil samples
BT and oils were mixed to be interesterified using CH3ONa under 105 °C for 0.5 h. The blends before reaction were marked starting mixture. In the typical procedure, oils and CH3ONa were added in a three-necked flat-bottom flask. The reaction was conducted under vacuum pressure (∼2000 Pa) using a vacuum pump. The flask was heated in a thermostatic heating plate. A mechanical impeller with a plastic paddle rotating at 200 rpm was used to stir the reaction mixture. After reaction, the mixture was neutralized by citric acid. The oil phase consisting of IE samples was then filtered, washed by hot water, and then dried and analyzed by gas chromatography (GC).2.3 Physicochemical analysis
The composition of fatty acids (FAs) of samples was analyzed as fatty acid methyl esters (FAMEs) by a GC system with a capillary column (CP-Sil88, 100 m × 0.25 mm i.d., 0.2 μm in film thickness, Agilent Technologies Inc., Palo Alto, CA, USA).6 The detector temperature was set at 260 °C. The oven temperature program was: initial oven temperature of 120 °C for 3 min, then increased to 175 °C at a rate of 8 °C min−1 and holding for 28 min, and then increased to 215 °C at a rate of 3 °C min−1 and holding for 20 min. TAGs compositions of samples were conducted using the above GC with column (Rtx-65TG, 30 m × 0.25 mm i.d., 0.1 μm in film thickness, Resteck Corp., Bellefonte, PA, USA). The detector temperature was set at 360 °C. The oven temperature program was: initial oven temperature of 250 °C for 1 min, then increased to 280 °C at a rate of 20 °C min−1, then increased to 340 °C at a rate of 10 °C min−1 and holding for 1 min, and then increased to 350 °C at a rate of 1 °C min−1 and holding for 20 min. TAGs composition was analyzed before deacidification and identified using available standard.7,8 The solutions for analysing products were composed of 50.0 mg of the obtained product, dissolved in 5 mL acetone, and 0.2 μL sample was injected.Polarized light microscope (PLM) techniques were applied to characterize the structures of crystallization after smeared and 24 h ripening at 20 °C. The polymorphism of the samples was characterized by X-ray diffraction.9 Solid fat contents (SFC) was determined using a nuclear magnetic resonance (NMR) spectrometer (Bruker PC/20 Series Minispec, Bruker Optics Ltd., Milton, ON, Canada) according to the AOCS Official Method Cd 16-81.10 Samples were tempered at 60 °C for 30 min to remove the crystal memory, followed by an incubation at 0 °C for 60 min and finally for 30 min at each temperature. SFC was measured at intervals of 5 °C from 10 °C up to 40 °C. Crystallization rates were measured at intervals of 2 min from 2 min up to 12 min according to the SFC value at 10 °C. The increase rate of SFC value was defined as crystallization rate11 using the following equation:

A differential scanning calorimetry (DSC) system was used to monitor the thermal behaviour of the IE products. 6–8 mg samples were weighed into aluminum pans and sealed hermetically. The exotherm was obtained by holding the samples for 5 min at 70 °C followed by cooling to −30 °C by 5 °C min−1. To obtain endotherm, the samples were heated from 25 to 70 °C at 5 °C min−1.12
2.4 Preparation of cake margarine and puff pastry margarine
Oil blends (the recipes were shown in Table 1) were added in a beaker, immersed and heated to 75 °C in a thermostatic water bath. Soy lecithin and glyceryl mono- and di-stearate were also added to the oil phase as emulsifiers, and then heated to melt. The water-in-oil (W/O) emulsion system was prepared by adding the water phase (with salt) to the oil phase dropwise with mixer to mix. After mixing 0.5 h, the emulsion was flash cooled by using ice-cream machine, and the puff pastry margarine was shaped to sheet for the pastry application. All the obtained margarines were tested after 24 h ripening at 20 °C.| Ingredient (wt%) | Puff pastry margarine | Cake margarine |
|---|---|---|
| Oil blend (100% oil basis) | ||
| IE-products | 100.0 | 80.0 |
| Soybean oil | — | 20.0 |
| Oil blend | 82.5 | 82.5 |
![[thin space (1/6-em)]](https://www.rsc.org/images/entities/char_2009.gif) |
||
| Emulsifier | ||
| Soy lecithin | 0.2 | 0.2 |
| Glyceryl mono- and di-stearate | 0.3 | 0.3 |
| Total additive | 0.5 | 0.5 |
| Total oil phase | 83.0 | 83.0 |
|
||
| Water phase | ||
| Water | 15.0 | 15.0 |
| Salt | 2.0 | 2.0 |
| Total water phase | 17.0 | 17.0 |
2.5 Characterization of the margarines
2.6 Preparation of pound cake and puff pastry and preliminary sensory analysis
The formulation for puff pastry and pound cake was listed in Table 2. Pre-mix low and high protein flour, salt, sugar, and cold water in the dough mixer at low speed for 1 min, and then add in BT and mix for 5 min at high speed. The dough was rest for 5 min, and then fold in the puff pastry margarine and sheet the dough to 8 mm. Fold the dough 4 times 3 folds to yield 81 layers, sheet to 5 mm height each time. Sheet the dough to final 4 mm and cut into a square with the measurement 60 mm × 60 mm. The pastry was then baked for 20 min at 210 °C. The average height (lifting properties), appearance shape of baked product was measured and observed for evaluation. All ingredients tempered to room temperature (25 °C), and cake margarine was mixed with sugar at high speed in 5 min at 2 times. Eggs were added in bit by bit and mixed for 2 min. Flour was added to the dough and mixed for another 1 min at low speed. Accurate 350.0 g cake batter was filled in 12 cm-diameter-mold and baked for 50 min at 180 °C. The weight, height, volume of pound cake was measured for evaluation.| Ingredient (wt%) | Puff pastry | Pound cake |
|---|---|---|
| High protein flour | 26.0 | — |
| Low protein flour | 17.5 | — |
| All-purpose flour | — | 25.0 |
| Cold water | 23.5 | — |
| Egg | — | 25.0 |
| Pastry margarine | 25.5 | — |
| Cake margarine | — | 25.0 |
| BT | 5.0 | — |
| Sugar | 2.0 | 25.0 |
| Salt | 0.5 | — |
| Total | 100.0 | 100.0 |
2.7 Statistical analysis
One-way ANOVA was performed using SPSS 16 statistical software (SPSS Inc., Chicago, IL). Differences were considered to be significant at p ≤ 0.05, according to Duncan's multiple range test.3 Results and discussion
3.1 The effects of PMF on the physicochemical profiles of BT-based products before and after IE
The FA compositions of the starting oils are shown in Table 3. Obviously, FAs of BT were the most complex which contained some odd carbon FAs (0.48 wt% C15:0, 1.21 wt% C17:0, and 0.45 wt% C17:1). 2.80 wt% of trans-oleic acid was also detected in BT, and this may be due to some specific enzymes which can cause the hydrogenation of oleic and linoleic FAs, which is found in cow's stomach.13 Traces of FAs, including palmitic and stearic acids, were found in BT. The high contents of stearic (22.13 wt%) and oleic (36.35 wt%) acids demonstrate that BT was rich in C18 FAs. As expected, PMF abounded in palmitic acids and oleic acid with 46.73 wt% and 37.85 wt%, respectively, in agreement with previous reports.14 This reveals that PMF abounded in saturated and mono-unsaturated FAs. In comparison, the SBO contained much more unsaturated oleic and linoleic acids (24.86 wt% and 51.12 wt%, respectively).| FA | BT | SBO | PMF | |
|---|---|---|---|---|
| a Values show the means ± standard deviations (SD, n = 3).b Abbreviations used: FA, fatty acid; BT, beef tallow; SBO, soybean oil; PMF, palm mid fraction (45 °C); ND, not determined; 8:0, caprylic acid; 10:0, capric acid; 12:0, lauric acid; 14:0, myristic acid; 16:0, palmitic acid; 16:1t, trans-palmitoleic acid; 16:1c, palmitoleic acid; 18:0, stearic acid; 18:1, oleic acid; 18:1t, trans-oleic acid; 18:2, linoleic acid; 18:2t, trans- linoleic acid 18:3, linolenic acid; 20:0, arachidic acid; 20:1: gadoleic acid. | ||||
| C8:0 | 0.02 ± 0.01 | ND | 0.17 ± 0.01 | |
| C10:0 | 0.10 ± 0.01 | ND | 0.14 ± 0.01 | |
| C12:0 | 0.15 ± 0.01 | ND | 0.13 ± 0.01 | |
| C14:0 | 2.46 ± 0.07 | ND | 0.94 ± 0.04 | |
| C14:1 | 0.28 ± 0.01 | ND | ND | |
| C15:0 | 0.48 ± 0.01 | ND | ND | |
| C16:0 | 25.69 ± 1.02 | 10.89 ± 0.91 | 46.73 ± 1.87 | |
| C16:1 | 3.16 ± 0.05 | ND | ND | |
| C16:1t | 0.41 ± 0.02 | ND | ND | |
| C17:0 | 1.21 ± 0.01 | ND | ND | |
| C17:1 | 0.45 ± 0.02 | ND | ND | |
| C18:0 | 22.13 ± 1.16 | 4.15 ± 0.20 | 4.98 ± 0.59 | |
| C18:1 | 36.35 ± 1.55 | 24.86 ± 1.49 | 37.85 ± 1.99 | |
| C18:1t | 2.80 ± 0.30 | 0.01 ± 0.00 | 0.18 ± 0.01 | |
| C18:2 | 3.12 ± 0.01 | 51.12 ± 1.22 | 8.03 ± 0.90 | |
| C18:2t | 0.20 ± 0.01 | 0.59 ± 0.04 | 0.18 ± 0.02 | |
| C18:3 | 0.67 ± 0.01 | 5.85 ± 0.44 | 0.26 ± 0.01 | |
| C20:0 | 0.20 ± 0.01 | 0.36 ± 0.01 | 0.39 ± 0.01 | |
| C20:1 | 0.18 ± 0.01 | 0.47 ± 0.01 | 0.08 ± 0.01 | |
Jahurul et al.15 reported that the SFC of blending mango seed oil with PMF (less than 25 wt%) was found to be close to these SFC of commercial cocoa butter between 10 and 20 °C temperatures and revealed that PMF could be used in the preparation of green quality cocoa butter. To explore the application of PMF in crystallization and BT-IE modified oil base, a common vegetable oil SBO was selected for proportioning and IE experiment. Crystallization rate was calculated by recording the SFC at 10 °C within the first 12 min by every 2 min. SFC results are listed in Fig. 1A. The new BT-based oils were prepared through chemical IE reactions under certain conditions and characterized by SFC. It is observed that the SFC trend markedly changed compared with non-interesterification (NIE) samples. It can be observed that a familiar decrease in the SFC at 40 °C (control), and a notable increase in the SFC at 10 °C (IE-BT). Accordingly, these two samples' profiles turned sharper than before, while IE-sample 1 and IE-sample 2 turned smoother, since the PMF increased SFC significantly at the temperature range of 25–40 °C. The crystallization rates (Fig. 1B) of sample 2 at 12 min before and after IE were 0.31 and 0.68, respectively, and this means the crystallization rate after IE was expedited. NIE-control (0.47) presented faster crystallization rate than NIE-sample 1 (0.30) at 12 min and this rate was changed and improved significantly after IE (IE-sample 1, 0.72 at 12 min). It can also be observed that all oil base blended by PMF underwent decreases in crystallization rates, however, increased significantly after IE.
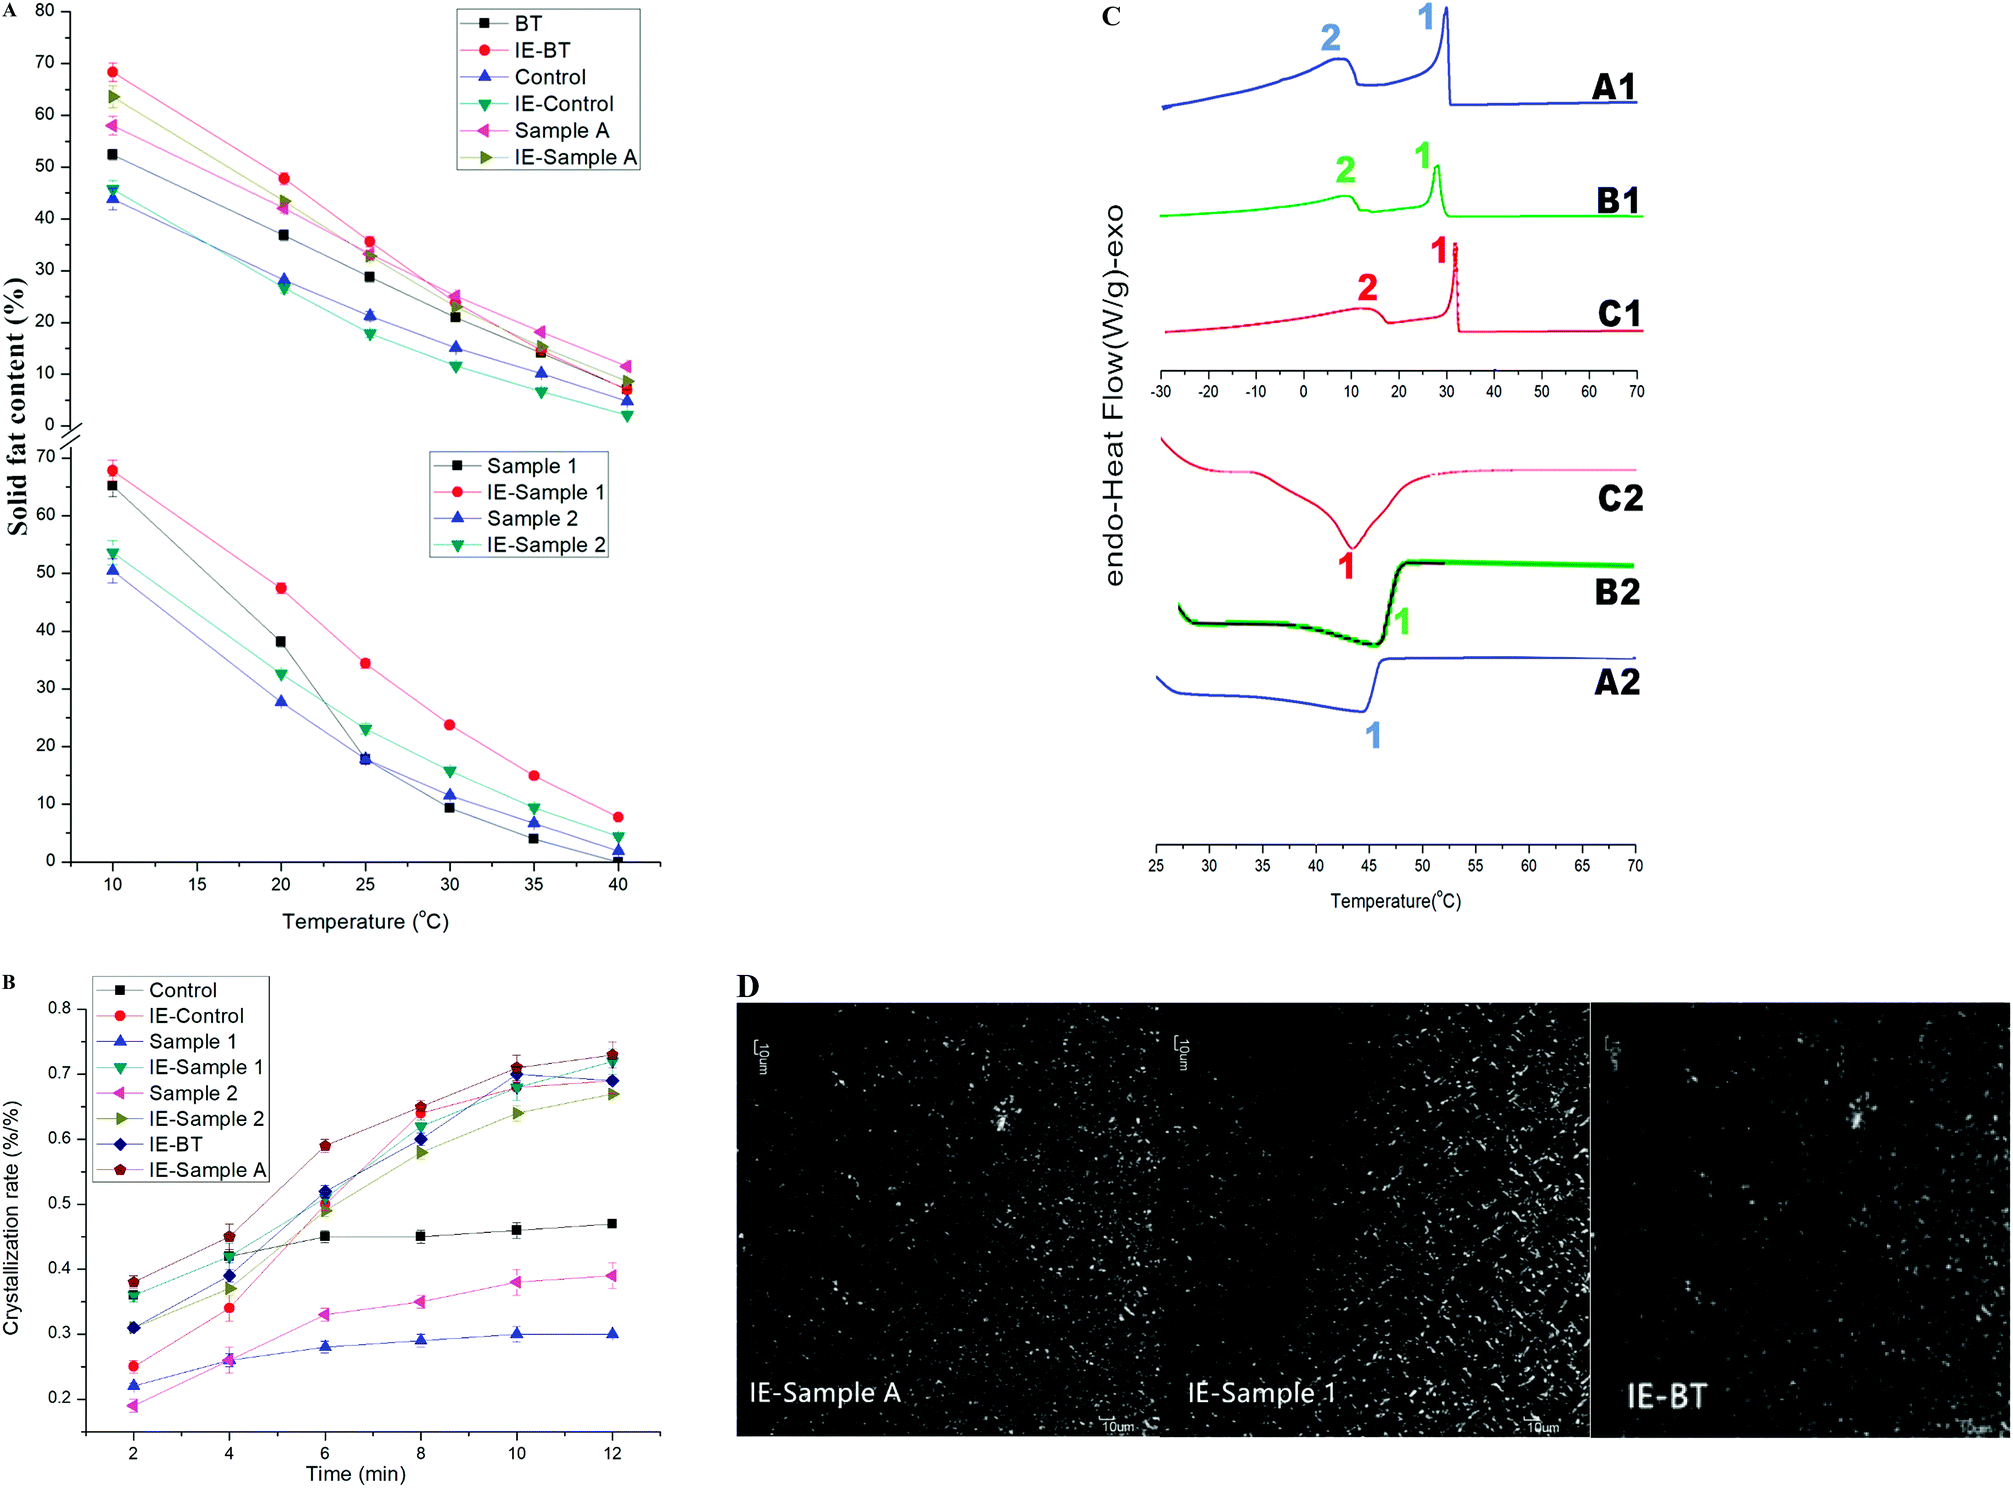 | ||
| Fig. 1 (A) SFC comparison of the samples by p-NMR analysis; (B) crystallization rates comparison of the samples by SFC method at 10 °C (IE, interesterification; BT, beef tallow; SBO, soybean oil; PMF, palm mid fraction; control, 80% BT + 20% SBO, sample 1: 20% BT + 80% PMF; sample 2: 30% BT + 20% SBO + 50% PMF; sample A, 30% BT + 35% PS + 20% PO + 15% SBO); (C) DSC crystallization and melting thermograms of the samples [A1, 2: IE-(30% BT + 35% PS + 20% PO + 15% SBO); B1, 2: IE-(20% BT + 80% PMF); C1, 2: IE-BT)]; and (D) PLM images of the IE samples: size bar = 10 μm (IE-sample A, IE-sample 1 and IE-BT). | ||
Upon chemical IE, random rearrangement of FAs among TAGs would happen. Concentrations of some kinds of TAGs were increased while some were decreased, with newly formed TAGs. The resulting changes in TAGs profile were reflected in SFC of the blends, and exchanges acyl groups among TAGs would change the physical properties of fats and oils. Noor Lida et al. studied a modification to the production of plastic fats by rearrange TAGs composition via IE from vegetable oils to replace hydrogenated fats.16 Table 4 outlines the TAGs compositions of samples. Blends at various ratios of mango seed oil/PMF were used in Jahurul's study. Results showed that the major TAGs ranges in all blends were 1,3-dipalmitoyl-2-oleoyl-glycerol (POP), 1,3-distearoyl-2-oleoyl-glycerol (SOS), and 1-palmitoyl-3-stearoyl-2-oleoyl-glycerol (POS).15 It should be noted that, after IE, PMF-based oils (IE-samples 1 and 2) have higher S/S/S-type TAGs contents (7.61 wt%, 9.10 wt% to 24.73 wt%, 14.42 wt%, respectively) and lower S/U/S, and U/U/U contents than SBO-based oil (control) and IE-BT, which is consistent with the SFC tendency. Jeyarani and Reddy developed a multiple regression equation which showed strong correlations between TAGs and their properties.17 It can be speculated that owing to the higher content of S/S/S-type TAGs in PMF-based oil with a higher melting point after IE, it could be viewed as a balance oil in specialty fats industry to increase the system SFC at 25–40 °C. In comparison, IE-control contained 42.69 wt% S/U/S and 35.35 wt% S/U/U. PMF was rich in POP. Such a S/U/S (S/S/S as well) TAG has β (short spacing at 4.6 Å) tending properties, leading to the formation of big crystals in solid fat products.18 After flash cooling, β form and β′ form (4.2 Å and 3.8 Å) were both observed in the X-ray diffraction spectra of all samples. Results are shown in Table 5. Compared with the X-ray diffraction spectra of IE-control and IE-sample 2, peaks at 4.6 Å increased noticeably on that of IE-sample 1, which demonstrates that β′ form was the dominant crystal form in IE-samples 2 and IE-control. This observation proves that PMF-based system with blending with SBO could improve the crystalline morphology after IE.
| TAG | BT | IE-BT | Control | IE-control | Sample 1 | IE-sample 1 | Sample 2 | IE-sample 2 | IE-sample A |
|---|---|---|---|---|---|---|---|---|---|
| a Values show the means ± SD (n = 3).b Abbreviations used: IE, interesterification; BT, beef tallow; control, 80% BT + 20% SBO; sample 1: 20% BT + 80% PMF; sample 2: 30% BT + 20% SBO + 50% PMF; ND, not determined; C42-50, TAG total carbon number = 42–50; M, myristic acid; P, palmitic acid; O, oleic acid; L, linoleic acid; S, stearic acid; S/S/S, tri-saturated triacylglycerols; S/U/S, di-saturated triacylglycerols; S/U/U, mono-saturated triacylglycerols; U/U/U, tri-unsaturated triacylglycerols. | |||||||||
| C42 | 0.16 ± 0.01 | 0.13 ± 0.01 | ND | ND | ND | ND | ND | ND | ND |
| C44 | 0.48 ± 0.01 | 0.55 ± 0.01 | ND | ND | ND | ND | ND | ND | ND |
| C46-MPP | 0.95 ± 0.01 | 0.83 ± 0.01 | 1.13 ± 0.01 | 0.88 ± 0.01 | 1.01 ± 0.01 | 1.70 ± 0.01 | 1.24 ± 0.01 | 1.45 ± 0.01 | 1.12 ± 0.01 |
| MOM | 0.35 ± 0.01 | 0.46 ± 0.01 | 0.30 ± 0.01 | ND | 0.24 ± 0.01 | 0.41 ± 0.01 | 0.06 ± 0.01 | ND | 0.22 ± 0.01 |
| C48-PPP | 3.16 ± 0.02 | 3.26 ± 0.01 | 3.10 ± 0.01 | 3.12 ± 0.31 | 4.25 ± 0.73 | 14.81 ± 0.98 | 3.19 ± 0.29 | 6.11 ± 0.70 | 8.99 ± 0.74 |
| MOP | 2.09 ± 0.20 | 2.81 ± 0.09 | 3.24 ± 0.04 | 2.84 ± 0.01 | 2.12 ± 0.01 | 2.40 ± 0.58 | 1.72 ± 0.07 | 1.70 ± 0.01 | 2.02 ± 0.11 |
| MLP | 0.47 ± 0.01 | 0.71 ± 0.01 | 1.29 ± 0.02 | 1.77 ± 0.02 | 0.48 ± 0.04 | 0.78 ± 0.03 | 0.51 ± 0.01 | 1.04 ± 0.01 | 1.05 ± 0.01 |
| C50-PPS | 5.98 ± 0.55 | 5.04 ± 0.34 | 4.60 ± 0.46 | 4.89 ± 0.41 | 1.29 ± 0.01 | 6.83 ± 0.44 | 2.04 ± 0.06 | 5.18 ± 0.13 | 7.23 ± 0.68 |
| POP | 8.34 ± 0.40 | 10.77 ± 0.65 | 9.48 ± 0.01 | 10.36 ± 0.88 | 41.61 ± 1.08 | 24.37 ± 0.75 | 26.04 ± 0.30 | 15.33 ± 0.56 | 17.46 ± 1.50 |
| MOO | 2.68 ± 0.09 | 3.43 ± 0.17 | ND | 1.79 ± 0.01 | 0.37 ± 0.01 | 0.44 ± 0.01 | 1.21 ± 0.01 | 0.59 ± 0.01 | 0.47 ± 0.01 |
| PLP | 1.13 ± 0.02 | 1.46 ± 0.02 | ND | 5.68 ± 0.43 | 7.99 ± 0.22 | 6.89 ± 0.02 | 4.97 ± 0.72 | 7.20 ± 0.27 | 7.58 ± 0.22 |
| MLO | 1.51 ± 0.01 | 1.55 ± 0.06 | 1.37 ± 0.01 | 2.73 ± 0.27 | 0.43 ± 0.01 | 0.72 ± 0.02 | 0.64 ± 0.02 | 1.04 ± 0.02 | 0.84 ± 0.01 |
| PSS | 7.08 ± 0.74 | 3.71 ± 0.09 | 4.27 ± 0.10 | 3.83 ± 0.32 | 1.06 ± 0.01 | 1.39 ± 0.07 | 1.84 ± 0.01 | 1.68 ± 0.02 | 1.84 ± 0.01 |
| POS | 14.72 ± 0.85 | 12.42 ± 0.46 | 13.16 ± 0.43 | 11.99 ± 0.60 | 9.57 ± 0.36 | 7.50 ± 0.59 | 8.78 ± 0.43 | 9.33 ± 0.31 | 9.19 ± 0.84 |
| POO | 10.76 ± 0.37 | 11.21 ± 0.76 | 14.27 ± 0.79 | 9.83 ± 0.47 | 13.84 ± 0.43 | 13.34 ± 0.46 | 11.64 ± 0.48 | 12.24 ± 0.14 | 11.82 ± 0.57 |
| PLS | 2.75 ± 0.19 | 2.73 ± 0.04 | 3.60 ± 0.22 | 6.01 ± 0.36 | 2.09 ± 0.05 | 2.28 ± 0.08 | 1.88 ± 0.01 | 3.98 ± 0.23 | 3.75 ± 0.25 |
| PLO | 2.69 ± 0.01 | 3.71 ± 0.13 | 5.73 ± 0.15 | 8.64 ± 0.08 | 5.07 ± 0.07 | 6.72 ± 0.27 | 5.69 ± 0.04 | 11.17 ± 0.74 | 9.56 ± 0.33 |
| PLL | 1.15 ± 0.01 | 1.23 ± 0.01 | 4.79 ± 0.19 | 2.03 ± 0.02 | 1.26 ± 0.01 | 1.38 ± 0.12 | 3.96 ± 0.04 | 3.97 ± 0.13 | 3.20 ± 0.07 |
| SSS | ND | ND | 2.11 ± 0.05 | ND | ND | ND | 0.79 ± 0.03 | ND | ND |
| SOS | 2.50 ± 0.04 | 0.90 ± 0.05 | 5.15 ± 0.33 | 4.04 ± 0.23 | 1.87 ± 0.01 | 0.86 ± 0.01 | 2.93 ± 0.05 | 1.37 ± 0.01 | 1.26 ± 0.02 |
| SOO | 8.04 ± 0.51 | 4.35 ± 0.39 | 6.39 ± 0.76 | 6.13 ± 0.59 | 2.35 ± 0.03 | 2.05 ± 0.05 | 3.44 ± 0.03 | 3.32 ± 0.16 | 2.75 ± 0.05 |
| OOO | 7.50 ± 0.69 | 7.49 ± 0.97 | 2.79 ± 0.26 | 2.85 ± 0.84 | 1.77 ± 0.10 | 2.28 ± 0.06 | 2.05 ± 0.09 | 3.36 ± 0.24 | 2.70 ± 0.14 |
| SLO | 0.81 ± 0.01 | 0.45 ± 0.01 | 1.67 ± 0.02 | 4.20 ± 0.50 | 0.68 ± 0.01 | 1.01 ± 0.01 | 1.26 ± 0.01 | 2.92 ± 0.26 | 2.19 ± 0.03 |
| OLO | 2.17 ± 0.13 | 4.52 ± 0.24 | 2.81 ± 0.22 | 4.37 ± 0.19 | 0.63 ± 0.01 | 1.50 ± 0.01 | 2.45 ± 0.01 | 3.87 ± 0.10 | 3.09 ± 0.25 |
| OLL | 1.18 ± 0.01 | 1.73 ± 0.02 | 3.09 ± 0.39 | 1.05 ± 0.01 | ND | 0.35 ± 0.01 | 3.76 ± 0.30 | 1.84 ± 0.02 | 1.10 ± 0.01 |
| S/S/S | 17.17 ± 1.32 | 12.84 ± 0.50 | 15.21 ± 0.63 | 12.72 ± 1.05 | 7.61 ± 0.76 | 24.73 ± 1.50 | 9.10 ± 0.40 | 14.42 ± 0.86 | 19.18 ± 1.44 |
| S/U/S | 32.35 ± 2.62 | 32.26 ± 1.32 | 36.22 ± 1.06 | 42.69 ± 3.14 | 65.97 ± 1.78 | 45.49 ± 2.07 | 46.89 ± 1.50 | 39.95 ± 1.30 | 42.53 ± 2.96 |
| S/U/U | 27.64 ± 1.01 | 25.93 ± 1.53 | 34.22 ± 1.92 | 35.35 ± 1.94 | 24.00 ± 0.57 | 25.66 ± 0.94 | 27.84 ± 0.63 | 35.25 ± 1.46 | 30.83 ± 1.07 |
| U/U/U | 10.85 ± 0.83 | 13.74 ± 1.23 | 8.69 ± 0.87 | 8.27 ± 1.04 | 2.40 ± 0.11 | 4.13 ± 0.08 | 8.26 ± 0.40 | 9.07 ± 0.36 | 6.89 ± 0.40 |
| BT | IE-BT | Control | IE-control | Sample 1 | IE-sample 1 | Sample 2 | IE-sample 2 | IE-sample A | |
|---|---|---|---|---|---|---|---|---|---|
| a Values show the means ± SD (n = 3).b Abbreviations used: IE, interesterification; BT, beef tallow; control, 80% BT + 20% SBO; sample 1: 20% BT + 80% PMF; sample 2: 30% BT + 20% SBO + 50% PMF; sample A, 30% BT + 35% PS + 20% PO + 15% SBO. | |||||||||
| Polymorphic form | β′ ≫ β | β′ ≫ β | β′ ≫ β | β + β′ | β + β′ | β > β′ | β + β′ | β + β′ | β′ > β |
3.2 Preparation and characterization of the IE-samples (with similar SFC profile)
Functional characteristics of bakery fat, including, physical appearance, and spread-ability could be related to SFC profiles mainly. BT-based oil mixtures were interesterified using CH3ONa under 105 °C for 0.5 h to prepare the margarine oil base. To explore the application properties, three IE formulas (traditional BT-palm oil-based sample A: 30% BT + 35% PS + 20% PO + 15% SBO; sample 1; and BT) with similar SFC profiles were selected as shown in Fig. 1A. The SFC values of three IE-samples were at the same level at each temperature and were around 65% at 10 °C (63.63% of IE-sample A; 66.81% of IE-sample 1; 65.08% of IE-BT) while around 7% at 40 °C (8.61% of IE-sample A; 7.77% of IE-sample 1; 7.03% of IE-BT). Fig. 1A describes the SFC in samples under various temperatures. From the patterns, as mentioned above, it can be seen that at 40 °C, SFC content of only sample 1 increased after IE compared to the staring mixture and this indicates a higher melting point of the products. Also, the SFC curves became gentler after IE. IE changed the crystallization rate significantly though changing TAGs composition. Even though their SFC profiles were similar the crystallization rates of IE-samples A, IE-sample 1, and IE-BT at 10 °C vary among the samples studied (0.39, 0.36, and 0.30 at 2 min, 0.74, 0.72, and 0.69 at 12 min, respectively) (Fig. 1B). Thus, there is no direct connection between SFC and crystallization kinetics as SFC remained almost unchanged and crystallization rate was widely variable.19DSC is also adopted to evaluate the thermal behaviour of the three IE-samples. Generally, the different DSC profiles may be attributed to the acylglycerols structures which differ in molecular weights. The aggregation of hydrocarbon chain in crystal subcells are also different. As a consequence, oils with differing crystal structures present unique characteristic of polymorphism.20 The DSC curves of samples are shown in Fig. 1C. Simultaneously, the transition temperatures of crystallization, melting points as well as the onset temperature (To), and offset temperature (Tf) are summarized in Table 6. From Fig. 1C, there are some similarities between the patterns A1, B1, and C1. General characteristics did not change greatly between the three IE samples, with difference mainly in temperature. Thereinto, two primary crystallization peaks were observed and it was crystallized at higher temperature. This indicates that the higher melting TAGs were present in the samples and also demonstrates that the samples demonstrated a similar crystallization tendency, while IE-BT had the highest onset temperature (33.90 °C), IE-sample A and IE-sample 1 were 30.71 °C and 29.97 °C, respectively. The reason for the similar crystallization behaviours may derive from the similar SFC profiles and crystallization rate. Braipton-Danthine and Gibon21 reported that the crystallization properties for PMF and palm-based oil were due to their composition with high content of TAGs in the SUS and SUU configurations. The analysis on melting characteristics of DSC show close curve characteristics of these three IE-samples.
| Curve | Sample | To (°C) | Tf (°C) | Transition temperature (°C) |
|---|---|---|---|---|
| a Values show the means ± SD (n = 3).b Abbreviations used: IE, interesterification; BT, beef tallow; sample 1: 20% BT + 80% PMF; sample A, 30% BT + 35% PS + 20% PO + 15% SBO. | ||||
| Crystallization | IE-sample A | 30.71 ± 0.72 | — | 1: 29.96 ± 0.02, 2: 7.24 ± 0.02 |
| IE-sample 1 | 29.97 ± 0.34 | — | 1: 28.07 ± 0.31, 2: 7.47 ± 0.29 | |
| IE-BT | 33.90 ± 0.61 | — | 1: 31.52 ± 0.43, 2: 14.78 ± 0.25 | |
| Melting | IE-sample A | — | 46.05 ± 0.93 | 1: 44.28 ± 0.55 |
| IE-sample 1 | — | 47.80 ± 0.61 | 1: 45.15 ± 0.32 | |
| IE-BT | — | 50.34 ± 0.92 | 1: 44.06 ± 0.79 | |
Melting properties (pattern A2, B2, and C2) correspond to the crystallization results, IE-BT showed the highest offset temperature (50.34 °C), however it had the lowest peak temperature (44.06 °C), followed by IE-sample A (44.28 °C), and IE-sample 1 presented a higher of 45.15 °C in Table 6 and Fig. 1C. The melting of IE-sample 1 was late possibly because of the presence of higher content of saturated TAGs (S/S/S type, 24.73 wt%) whose melting point is higher than the corresponding unsaturated ones (IE-sample A, 19.18 wt%; IE-BT, 12.84 wt%) (Table 4), and this is in agreement with the increase of substances with high melting point after IE.
β′ crystal form is meta-stable with intermediate melting point and provides smooth texture for instant margarine, whereas β form is the most stable polymorphic form. Traditionally, in shortening and margarine production, oil base is chosen, and the addition of appropriate emulsifiers is adopted to stabilize β′ crystal.18 At 20 °C, β and β′ form were both observed in the X-ray diffraction spectra of all IE-samples (Table 5). Compared with the X-ray profiles of IE-samples A and IE-BT, peaks at 4.2 Å decreased on that of IE-sample 1, and this demonstrate that the β′ form was the dominant crystal form in IE-sample A and IE-BT. As mentioned before, PMF can act as an agent to accelerate the transformation of morphology β′ to β after IE reaction. The result is consistent with the crystallization rate according to the SFC profiles. Crystal sizes are essential for end products consistency, and microstructure is easily affected by processing conditions and had a significant effect on oils and fats macroscopic physical properties compared with SFC and polymorphism.22,23 Under different processing conditions, microstructure may change accordingly and inevitably, though SFC and polymorphism may remain almost unchanged.24 Fig. 1D shows the differences of microstructure of crystal in the IE-samples. IE-sample 1, mainly consisted of large needle-shaped crystals oriented radially from the centre, ranging from 10 μm to 20 μm. In contrast, both IE-sample A and IE-BT consisted of evenly distributed small and dense aggregated plate crystals with sizes smaller than 10 μm. Our results agree with those of Dibildox-Alvarado et al.25 who observed that in a mixture of peanut oil and chemically interesterified palm-based oil, smaller crystalline particles trapped oil more efficiently. This agrees with the polymorph findings that PMF-based IE oil was preferred β form.
3.3 Preparation and characterization of the IE-based margarine
Margarine is designed for incorporation of a large amount of air and homogenous fat distribution into the batter thus ensuring uniform expansion during baking and a resulting end product with a homogenous crumb structure.26 To test the functionality of the IE-sample 1 based margarine, cake and puff pastry trials were conducted and compared with other cake batches prepared using IE-sample A based margarine and IE-BT based margarine. Margarine properties of these batches were studied in terms of air incorporation and rheology. In addition, a physical evaluation was also carried out on the final cake products. Formulas of margarine (for cake and puff pastry, respectively) with the IE-samples were introduced in this study to evaluate the bakery properties. The recipes were prepared as shown in Table 1 (A-cake: IE-sample A-based cake margarine; A-puff: IE-sample A-based puff pastry margarine; 1-cake: IE-sample 1-based cake margarine; 1-puff: IE-sample 1-based puff pastry margarine; BT-cake: IE-BT-based cake margarine; BT-puff: IE-BT-based puff pastry margarine).It is very crucial that the cake margarine has a creamier structure and a desired plasticity. Since, cake margarine is a W/O type emulsion, and aeration ability is a key factor influencing the property of bakery products and is usually measured by creaming test at certain temperatures.27 Specific gravity (mass of whipped fats/mass of water under same volume) of batter was calculated as the aeration value. The lower specific gravity corresponds to the better air incorporation ability. Even the fats which had the same SFC profiles, hardness differences by affected the crystal types and polymorphism,19 meanwhile foaming degree is largely subjected to the physical properties such as hardness at the whipping temperature of the fats. Cake margarine is designed for incorporation of a large amount of air and homogenous fat distribution into the batter thus ensuring uniform expansion during baking with a homogenous crumb structure.28 In order to obtain this, it is very crucial that the cake margarine has a creamier structure and a desired plasticity. Since, cake margarine is a W/O type emulsion, good aeration property in the continuous phase are preferred as they increase the firmness and incorporation of air into the batter at a given solid fat content.29 The specific gravity values of the samples at 25 °C are shown in Fig. 2 which describes the foaming degree during whipping. PMF-based 1-cake (80% IE-sample 1 + 20% SBO) gave a best whipping performance compared with other two samples. During the first 25 min, the specific gravity decreased to 0.27, but it began to increase after 25 min. This result could be attributed to that the increased temperature along with whipping damaged the incorporation network. The value of A-cake (80% IE-sample A + 20% SBO) and BT-cake (80% IE-BT + 20% SBO) also dramatically declined to below 0.34 and 0.32, respectively after 25 min. The specific gravity of corresponding cake batter before baking was also measured and reported in Fig. 2. IE-sample 1 based 1-cake margarine performed the best aeration and whipping ability, and the specific gravity was only 0.78 while IE-sample A based A-cake margarine and IE-BT based BT-cake margarine gave 0.84 and 0.85, respectively. This agrees the results of the above oils creaming tests.
 | ||
| Fig. 2 Specific gravity of the samples at 25 °C. | ||
The cake and puff pastry margarines' properties were studied using rheology analysis (Fig. 3). Fig. 3A shows the rheological data obtained from oscillatory measurements conducted on the cake margarines. The absence of SBO in cake margarines led to a lower consistency as compared to the corresponding puff pastry margarine samples (Fig. 3B), confirmed from a 10 Pa (Osc. Stress) difference (in linear viscoelastic region (LVR)) in the G′ (227000 Pa for 1-puff as compared to 64300 Pa for 1-cake). The Pa for 1-cakestic region (LVR)) rom oscillatory measurements conducted o values which were much higher than the corresponding Ga values.30 It should be noted that the effects of IE-oil types on the viscous moduli changes even they present the similar SFC profiles (refer to Fig. 1). It is quite clear from the graph of amplitude sweeps that IE-BT had an apparent effect on the viscoelastic properties of cake margarine (as suggested by overlapping curves), which could be reflected to the firmness (the higher G′ value gave a higher hardness). The firmness of margarine had an influence on the air incorporation resulting in a comparatively higher batter density. And, due to the difference in the consistency of the margarine, the cake batter and the end baked pound cakes showed varying sensorial attributes. This is unlike what we observed in the case of 1-cake and A-cake margarine where the effect of the IE-oil types was not prominently seen.
 | ||
| Fig. 3 Rheological data from amplitude stress sweeps measurements plotted as elastic and viscous moduli (G′ and G′′) of (A) cake margarine and (B) puff pastry margarines (A-cake, 80% IE-sample A + 20% SBO based cake margarine; 1-cake, 80% IE-sample 1 + 20% SBO based cake margarine; BT-cake, 80% IE-BT + 20% SBO based cake margarine). | ||
IE-sample A (Fig. 3B) gave a little stronger solid compared to IE-sample 1 as indicated by the 10 Pa (Osc. Stress) values of elastic modulus in LVR (1-puff and A-puff were 233000 and 227000 Pa respectively). Meanwhile, BT-puff showed the highest LVR average Ge value (281000 Pa) which means the highest hardness it had. This result agrees the above phenomenon of BT-cake. Moreover, the absence of a cross-over point (Gre GG) even at high oscillatory values confirms that the three puff pastry margarine samples do not show a transformation even at an increased rate of deformation. All the puff pastry margarines samples showed a very strong shear-thinning behaviour31,32 as clearly seen from the log–log plot shown in Fig. 3B.
3.4 Preparation and characterization of pound cake and puff pastry
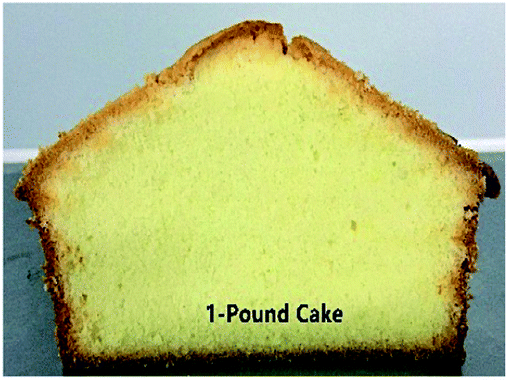
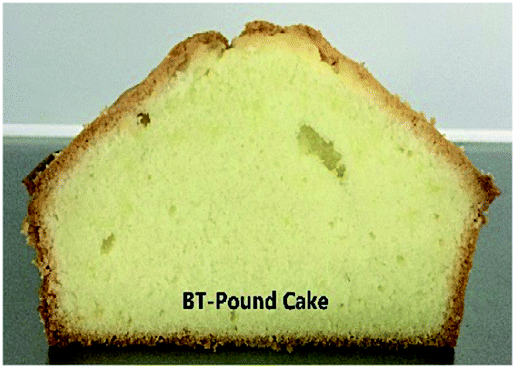
Table 7 represents some important physical and chemical values of the pound cake samples. In this study, these three IE based cake margarine samples were compared among themselves, as stated in the objectives of the study under the Introduction section. Patel et al.33 investigated the usage of margarine, oleogel, and oil in cake and margarine showed the best performance. They found that the cake with margarine presented no significant changes in hardness and chewiness during storage, since the cake margarine has a creamier structure and a desired plasticity. There were some physical differences between the cake samples. The weight of 1-pound cake was lightest (350.0 g originally, and 315.37 g after baking) compared to other two cakes. In consequence, the cake volume was the largest (634.81 mL) with the highest height (8.00 cm). From the slice picture, A-pound cake was less fineness structure and the medium high volume of cake, while BT-pound cake gave a less fineness structure and the low volume of cake. The finding here is consistent with samples specific gravity results described above.| Pound cakec | A-cake based | 1-cake based | BT-cake based |
|---|---|---|---|
| a Values show the means ± SD (n = 3).b Abbreviations used: A-cake, 80% IE-Sample A + 20% SBO based cake margarine; 1-cake, 80% IE-sample 1 + 20% SBO based cake margarine; BT-cake, 80% IE-BT + 20% SBO based cake margarine; A-puff, IE-sample A based puff margarine; 1-puff, IE-sample 1 based puff margarine; BT-puff, IE-BT based puff margarine.c Cake products prepared using A-cake, 1-cake, and BT-cake, respectively.d Puff pastry products prepared using A-puff, 1-puff, and BT-puff, respectively; parameters – weight, volume, height, and width of cakes measured on the day of preparation. | |||
| Weight (g) | 316.83 ± 1.10 | 315.37 ± 0.94 | 318.79 ± 0.42 |
| Height (cm) | 7.50 ± 0.13 | 8.00 ± 0.11 | 7.67 ± 0.15 |
| Up width (cm) | 12.44 ± 0.19 | 13.00 ± 0.10 | 12.41 ± 0.08 |
| Volume (mL) | 592.34 ± 5.05 | 634.81 ± 3.25 | 583.35 ± 7.13 |
| Slice view of cake |  |
 |
 |
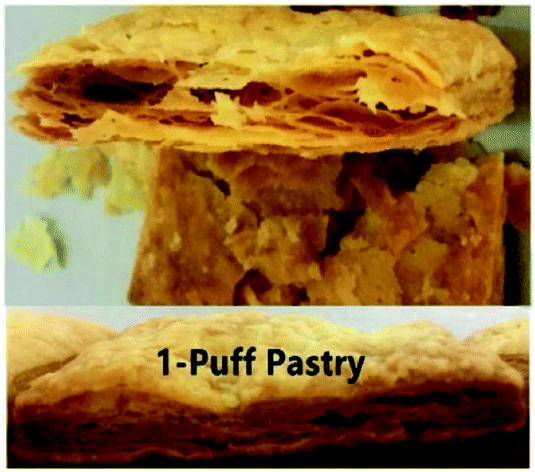
| Puff pastryd | A-puff based 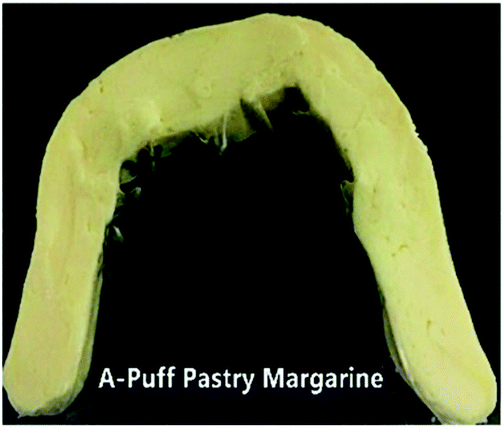 |
1-Puff based 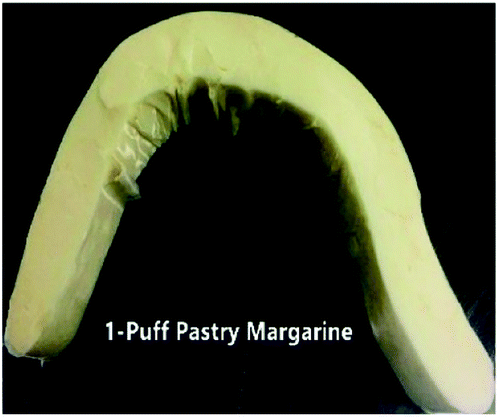 |
BT-puff based  |
| Average height (cm) | 1.49 ± 0.08 | 1.46 ± 0.02 | 1.44 ± 0.08 |
| Appearance | 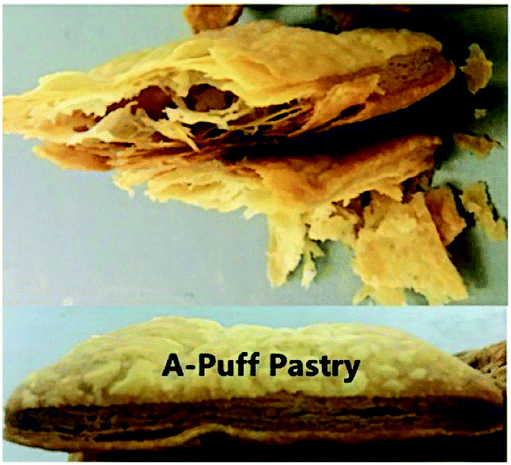 |
 |
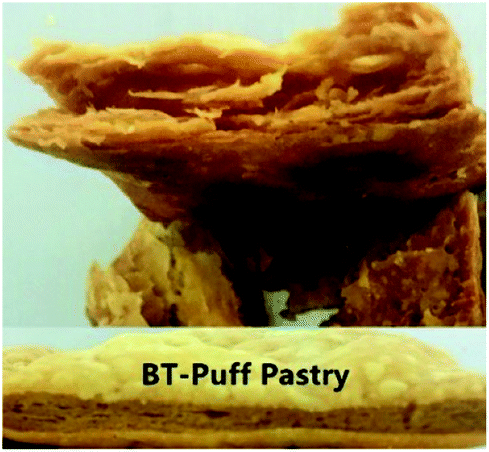 |
A picture of the puff pastry margarine samples used in this study is shown in Table 7. This picture provides a good visual feeling of what the plasticity of sheet margarine looks like, and how their texture is. The decrease in the cohesiveness of IE-BT puff pastry margarine thus indicates an increase in the brittleness of the sample, since IE-BT-based margarine had the highest hardness at the same temperature compared to the margarines from IE-sample A and IE-sample 1 (Fig. 3B). A-puff pastry and 1-puff pastry gave the clear layers of the end products, since their decent operation ability with proper plasticity. Due to the low plasticity, IE-BT based sheet margarine appeared some fracture during folding with the dough. The fuzzy slice happened after baking since the discontinuity oil layers in the dough, in consequence, affected the lifting height (1.44 cm).
The results from the tests done on cakes and puff pastry can be summarized as follows: (a) the air incorporation in IE-sample 1 based cake batter and pound cake volume was higher than that in IE-sample A and IE-BT based products possibly because of the aeration ability as well as fat crystals in PMF-based IE fats; (b) puff pastry margarine for IE-sample 1 and IE-sample A were more expanded easily under the applied force as compared to IE-BT based puff pastry margarine; this considerable plasticity could be considered to be an advantage in terms of ease of handling.34
4 Conclusions
This work compares approaches to optimize formulation of hybrid BT PMF based plastic fat through either direct blending which can retard crystallization rate and stabilizing β′ crystals or chemical IE method which accelerates the crystallization rate and smooths the SFC profile by increasing the SFC between 25 and 40 °C. The BT-PMF-based IE margarines showed comparable strong shear-thinning and flow behaviours. Based on preliminary bakery trails where cakes with IE-BT-based were successfully prepared the PMF-based IE fats are suitable for use as bakery fat alternatives. The functionality of PMF-based IE margarines was studied by comparing batter and cake properties. The rheological and physical characteristic results, and functionality of BT-PMF-based IE cake margarine was significantly improved in cake volume and structure, while BT-PMF-based IE puff pastry margarine were comparable to IE-BT margarine samples and in some cases to traditional formula margarine with suitable plasticity in both lifting properties and operability.Conflicts of interest
The authors have declared no conflict of interest.Acknowledgements
The National Key Research and Development Program of China under grant 2017YFD0400200, the financial support from the National Natural Science Foundation of China under grant 31371785, 31671781, 31701525, and 31601503, the Department of Science and Technology of Qingyuan City under grant 2016D008, the Department of Science and Technology of Guangdong Province under grant 2017B090907018, 2014A010107014, 2016YT03H132, 2016A010105010, and 2013B090800009, and the Bureau of Science and Information of Guangzhou under grant 201803020032 are gratefully acknowledged.References
- M. H. A. Jahurul, I. S. M. Zaidul, N. A. N. Norulaini, F. Sahena, M. Z. Abedin, K. Ghafoor and A. K. Mohd Omar, Food Res. Int., 2014, 55, 103–109 CrossRef CAS.
- Z. Zhang, X. Ma, H. Huang and Y. Wang, LWT--Food Sci. Technol., 2017, 86, 492–500 CrossRef CAS.
- H. M. D. Noor Lida and A. R. Md Ali, J. Am. Oil Chem. Soc., 1998, 75, 1625–1631 CrossRef.
- Z. Meng, Y. Liu, L. Shan, Q. Jin and X. Wang, J. Am. Oil Chem. Soc., 2010, 87, 1435–1442 CrossRef CAS.
- M. Sahri, Y. C. Man, M. S. A. Yusoff and R. Rahman, Asia Pac. J. Clin. Nutr., 2005, 14, 387–394 Search PubMed.
- Z. Zhang, Y. Wang, X. Ma, E. P. Wang, M. M. Liu and R. A. Yan, Food Chem., 2015, 173, 70–79 CrossRef CAS PubMed.
- P. Adhikari and P. Hu, J. Food Sci., 2012, 77, 1284–1291 CrossRef PubMed.
- X. Chai, Z. Meng, P. Cao, X. Liang, M. Piatko, S. Campbell, S. K. Lo and Y. Liu, Food Chem., 2018, 255, 49–57 CrossRef CAS PubMed.
- M. Cerdeira, S. Martini, R. J. Candal and M. L. Herrera, J. Am. Oil Chem. Soc., 2006, 83, 489–496 CrossRef CAS.
- AOCS Official Method Cd 16-81 (AOCS, 2009).
- Z. Zhang, X. Ma, H. Huang and Y. Wang, J. Am. Oil Chem. Soc., 2017, 94, 1175–1188 CrossRef CAS.
- L. Bouzidi, M. Boodhoo, K. L. Humphrey and S. S. Narine, Thermochim. Acta, 2005, 439, 94–102 CrossRef CAS.
- M. Bockisch, Fats and Oils Handbook, AOCS Press, Champaign, IL, 1993, pp. 151−156 Search PubMed.
- P. T. Gee, Eur. J. Lipid Sci. Technol., 2007, 109, 373–379 CrossRef CAS.
- M. H. A. Jahurul, I. S. M. Zaidul, N. A. N. Norulaini, F. Sahena, M. Z. Abedin, K. Ghafoor and A. K. Mohd Omar, Food Res. Int., 2014, 55, 103–109 CrossRef CAS.
- H. M. D. Noor Lida, K. Sundram, W. L. Siew, A. Aminah and S. Mamot, J. Am. Oil Chem. Soc., 2002, 79, 1137–1144 CrossRef.
- T. Jeyarani and S. Y. Reddy, Food Chem., 2010, 123, 249–253 CrossRef CAS.
- L. Tanaka, S. Miura and T. Yoshioka, J. Am. Oil Chem. Soc., 2007, 84, 421–426 CrossRef CAS.
- S. Bripason-danthine and C. Deroanne, Food Res. Int., 2004, 37, 941–948 CrossRef.
- V. J. F. Toro, M. E. M. Briceno and A. E. Dibildox, J. Am. Oil Chem. Soc., 2000, 77, 197–309 Search PubMed.
- S. Braipton-Danthine and V. Gibon, Eur. J. Lipid Sci. Technol., 2007, 109, 359–372 CrossRef.
- S. S. Narine and A. G. Marangoni, Phys. Rev. E, 1999, 59, 1908–1920 CrossRef CAS.
- S. S. Narine and A. G. Marangoni, Phys. Rev. E, 1999, 60, 6991–7000 CrossRef CAS.
- S. S. Narine and A. G. Marangoni, Food Res. Int., 1999, 32, 227–248 CrossRef CAS.
- E. Dibildox-Alvarado, J. N. Rodrigues, L. A. Gioielli, J. F. Toro-Vazquez and A. G. Marangoni, Cryst. Growth Des., 2004, 4, 731–736 CAS.
- V. Cavillot, C. Pierart, M. K. De MeerendrÉ, M. Vincent, M. Paquot, J. Wouters, C. Deroanne and S. Danthine, J. Food Lipids, 2009, 16, 273–286 CrossRef CAS.
- L. H. Wiedermann, J. Am. Oil Chem. Soc., 1978, 55, 823–829 CrossRef CAS.
- V. Cavillot, C. Pierart, M. K. De Meerendré, M. Vincent, M. Paquot, J. Wouters, C. Deroanne and S. Danthine, J. Food Lipids, 2009, 16, 273–286 CrossRef CAS.
- A. Bell, M. H. Gordon, W. Jirasubkunakorn and K. W. Smith, Food Chem., 2007, 101, 799–805 CrossRef CAS.
- J. W. Goodwin and R. W. Hughes, Rheology for Chemists: An Introduction, The Royal Society of Chemistry, 2000, pp. 213–285 Search PubMed.
- C. Tropea, A. L. Yarin and J. F. Foss, Springer Handbook of Experimental Fluid Mechanics, Springer-Verlag, Berlin, Germany, 2007 Search PubMed.
- H. A. Barnes, J. F. Hutton and K. Walters, Viscosity, Rheology Series, 1989, ch. 2, vol. 3, pp. 11–35 Search PubMed.
- A. R. Patel, N. Cludts, M. D. B. Sintang, A. Lesaffer and K. Dewettinck, Food Funct., 2014, 5, 2833–2841 CAS.
- B. S. Ghotra, S. D. Dyal and S. S. Narine, Food Res. Int., 2002, 35, 1015–1048 CrossRef CAS.
| This journal is © The Royal Society of Chemistry 2018 |