
 Open Access Article
 This Open Access Article is licensed under a
 Creative Commons Attribution 3.0 Unported Licence
The effect of heat treatment on the anatase–rutile phase transformation and photocatalytic activity of Sn-doped TiO2 nanomaterials
Xiaodong Zhu ab,
Shihu Hanb,
Wei Feng*ac,
Qingquan Kongac,
Zhihong Donga,
Chenxi Wanga,
Jiahao Leia and
Qian Yia
ab,
Shihu Hanb,
Wei Feng*ac,
Qingquan Kongac,
Zhihong Donga,
Chenxi Wanga,
Jiahao Leia and
Qian Yia
aCollege of Mechanical Engineering, Chengdu University, Chengdu 610106, China. E-mail: fengwei1981_829@foxmail.com
bCollege of Materials and Chemistry & Chemical Engineering, Chengdu University of Technology, Chengdu 610059, China
cCollege of Architecture and Environment, Sichuan University, Chengdu 610065, China
First published on 17th April 2018
Abstract
Sn-doped TiO2 nanomaterials with different amounts of Sn (1, 2.5, 5, 10, and 15 at%) were prepared by a sol–gel method and characterized by XRD, TG, DTA, EDS, XPS, DRS, SEM, BET, and PL. The photocatalytic activity of the prepared samples was investigated by measuring the degradation of rhodamine B in aqueous solution under UV light. The experimental results indicate that doping with Sn promotes phase transformation from anatase to rutile. The photocatalytic activity of TiO2 is influenced by both the heat treatment temperature and the Sn doping concentration. 1% Sn–TiO2 exhibits the highest degradation rate at 350 °C and 5% Sn–TiO2 exhibits the best photocatalytic activity at 500 °C and 650 °C. The enhancement of the photocatalytic activity can be ascribed to a larger surface area and a better hydration ability, as well as less recombination of the photogenerated pairs.
Introduction
Following industrial development, water pollutants have become a serious environmental problem in the last few decades. In terms of the methods used for waste water treatment, using photocatalysts for decomposing harmful organic pollutants into CO2 and H2O is one of the most promising strategies. There are several candidate photocatalysts that have been applied to water treatment.1–4 Among them, TiO2 has been extensively studied owing to its high oxidation, non-toxicity, low cost, and chemical stability.5–7 However, pure TiO2 is severely restricted in application due to its low solar energy utilization on account of its large bandgap and the fast recombination of photogenerated electrons and holes.8,9 Among the several strategies designed to improve the photocatalytic activity of TiO2, ion doping is a convenient and effective approach.10–15 Among numerous elements, Sn has been reported to be an effective doping resource and is widely used for enhancing the photocatalytic properties of TiO2.16–22 Sn doping can promote the photocatalytic activity of TiO2 due to the fact that Sn4+ ions and Ti4+ ions have similar radii. Sn4+ ions are able to enter into TiO2 lattices and create electron traps, resulting in the enhancement of the separation of photogenerated pairs.23,24 In addition, the SnO2 band is 3.6 eV and its structure is similar to rutile TiO2 and, therefore, the recombination of the photogenerated pairs can be inhibited effectively, owing to the combination of TiO2 and SnO2.25The Sn dopant content plays a key role in the photocatalytic activity of TiO2 since there is an optimal concentration. The doping effect cannot be fully exhibited when the doping content is too low. However, Sn ions form recombination centers for the photogenerated pairs when the concentration surpasses the optimal content. Chua et al.26 prepared Sn-doped TiO2 films via aerosol assisted chemical vapor deposition and found that the degradation of stearic acid reached the highest value when the Sn/Ti atom ratio was 3.8%. Besides this, heat treatment affects the crystal structure of TiO2 significantly and thus annealing temperature is a decisive factor in the photocatalytic performance of TiO2. There is usually a transition from an anatase structure to a rutile structure with increasing annealing temperature. The anatase/rutile phase transition temperature is strongly affected by ion doping. The doping of several ions, such as Nd,27 La,28 Fe,29 et al., raises the temperature. Meanwhile, doping with Sn reduces the temperature and promotes the transition from anatase to rutile. Alves et al.21 reported that pure TiO2, which demonstrated a single anatase structure, presented excellent photocatalytic activity after annealing at a temperature of 650 °C. At the same temperature, 0.5 wt% Sn-doped TiO2, which consisted of 82.4% anatase and 17.6% rutile, showed the highest photocatalytic efficiency.
In view of the above, both the heat treatment temperature and doping concentration have important impacts on the crystal structure and photocatalytic activity of TiO2. Therefore, in the present work, pure and Sn-doped TiO2 with various amounts of Sn4+ ions were synthesized via a sol–gel method and the influence of the heat treatment temperature and Sn4+ doping concentration on the crystal structure and the photocatalytic activity of TiO2 were studied systematically.
Experimental
Preparation of pure and Sn-doped TiO2 nanomaterials
All the TiO2 nanomaterials were prepared via a sol–gel method. In a typical preparation of pure TiO2, 30 mL tetrabutyl titanate and 60 mL absolute ethanol were added into a beaker. 6 mL deionized water, 15 mL acetic acid, and 45 mL absolute ethanol were added into a pear-shaped funnel. The solution in the pear-shaped funnel was added to the beaker dropwise with continuous stirring. After several hours of aging, the resulting sol formed a gel. The gel was dried at 80 °C for 12 hours and was then annealed for 2 hours at 350 °C, 500 °C, and 650 °C, respectively. Sn-doped TiO2 with atom ratios (Sn/Ti) of 1%, 2.5%, 5%, 10%, and 15% was prepared from appropriate amounts of SnCl4·5H2O being added into a pear-shaped funnel whilst the other experimental conditions were kept equal. For simplicity, X% Sn-doped TiO2 is labelled as X% Sn–TiO2 (X = 1, 2.5, 5, 10, 15).Characterization
X-ray diffraction (XRD) spectra were recorded with a diffractometer (DX-2700, China). Thermogravimetric (TG) and differential thermal analysis (DTA) were performed using a thermal analyzer (STA409PC, Germany). X-ray photoelectron spectra (XPS) were recorded using a spectrometer (XSAM800, Britain) to examine the chemical states. The UV-vis diffused reflectance spectra (DRS) were collected using a spectrophotometer (UV-3600, Japan). The surface morphologies (SEM) and element compositions (EDS) were determined using a field-emission scanning electron microscope (FEI-Inspect F50, USA) equipped with an energy dispersive X-ray spectrometer. Specific surface areas were measured using BET theory on the nitrogen adsorption–desorption data. Photoluminescence (PL) spectra were obtained using a luminescence spectrometer (F-4600, Japan) with a 150 W Xenon lamp as an excitation source.Photocatalytic activity experiments
The photocatalytic activity of the prepared TiO2 nanomaterials was evaluated from the degradation of rhodamine B (RhB). 300 mL RhB solution (10 mg L−1) and 0.3 g TiO2 sample were added into a beaker and the suspension was stirred for 30 min in darkness to establish an adsorption–desorption equilibrium between the photocatalysts and RhB molecules. A 250 W high-pressure mercury lamp was employed as a UV light source. The degradation of RhB was monitored by measuring the absorbance of the RhB solution at 553 nm. The degradation rate (D) was calculated by the following equation:| D = (A0 − At)/A0 |
Results and discussion
XRD analysis
The XRD patterns of pure TiO2 and Sn–TiO2 with different concentrations of Sn, annealed at 350 °C, 500 °C, and 650 °C, are shown in Fig. 1. In Fig. 1a, the patterns of all the samples are similar and the peaks can be assigned to the anatase structure. The width of the peaks is relatively wide and the intensity of the peaks is weak, which indicates that both pure TiO2 and Sn–TiO2 show poor crystallinity at a temperature of 350 °C.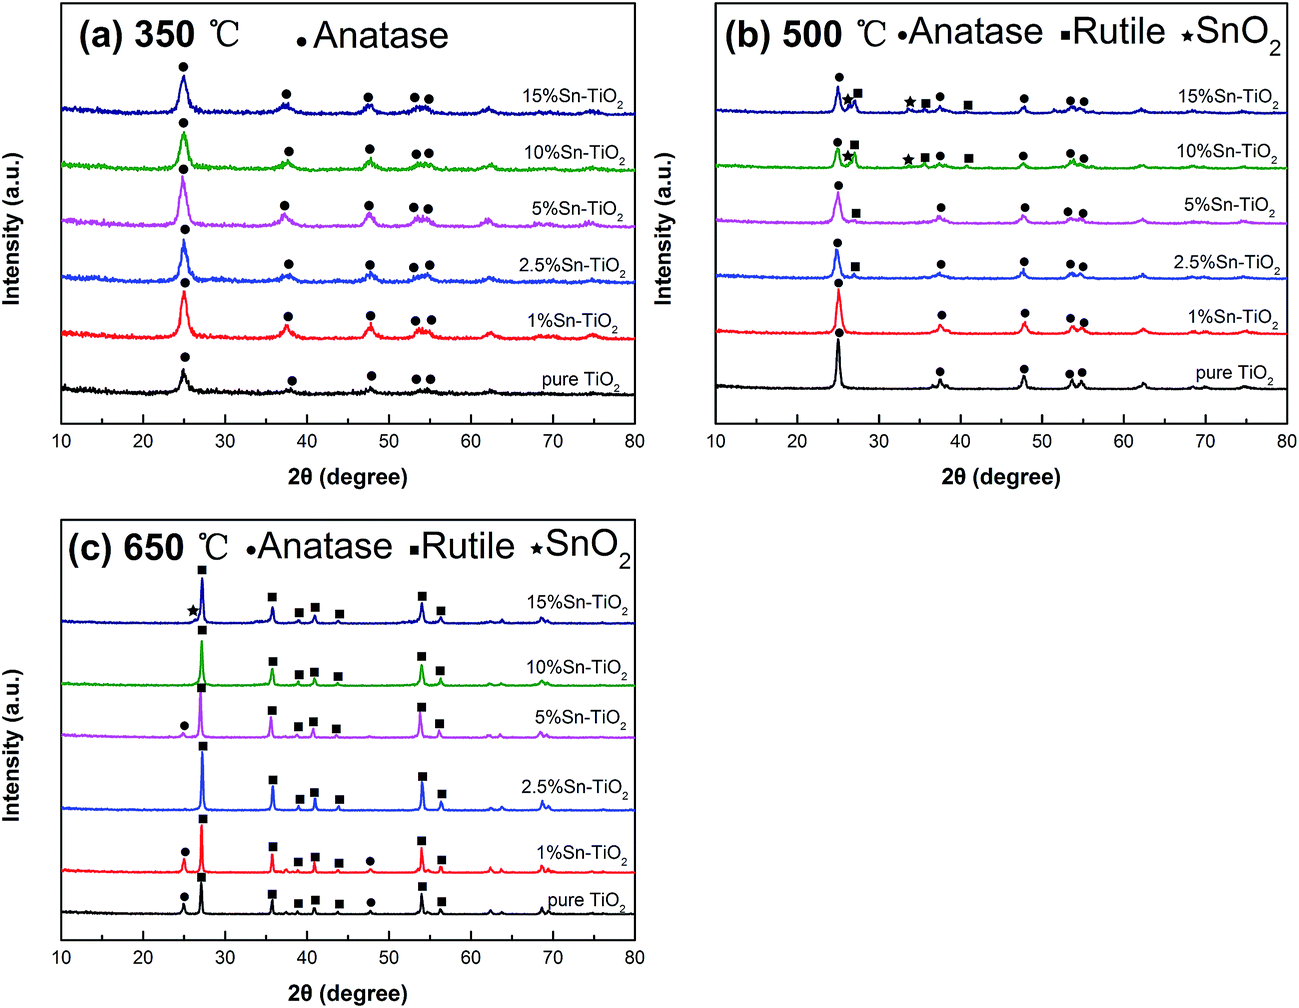 | ||
| Fig. 1 XRD patterns of pure TiO2 and Sn–TiO2 annealed at 350 °C (a), 500 °C (b), and 650 °C (c). | ||
The peak intensity of pure TiO2 increases and the peak width narrows as annealing temperature is increased to 500 °C, which suggests that the crystallinity of TiO2 increases with increasing temperature. The crystallinity of pure TiO2 annealed at 350 °C is determined to be 23.7%, while it is 74.5% for pure TiO2 annealed at 500 °C. There is no peak for the rutile structure, which suggests that 500 °C is insufficient for starting the phase transformation from anatase to rutile. 1% Sn–TiO2 shows a similar pattern to pure TiO2. The rutile peaks appear when the Sn doping concentration reaches 2.5%. The SnO2 peaks can be detected in the patterns of 10% Sn–TiO2 and 15% Sn–TiO2, indicating that SnO2 forms in Sn–TiO2 when the Sn content is at a sufficiently high level.
It is observed that both anatase and rutile peaks appear in the pattern of pure TiO2 at 650 °C, which means that phase transition from anatase to rutile occurs with increasing temperature. The anatase structure peaks become weaker in the Sn–TiO2 patterns, and even disappear when the Sn content is 10% and 15%. There is little SnO2 forming in the 15% Sn–TiO2 sample.
The average crystallite size (D) was calculated by the formula D = 0.89λ/β![[thin space (1/6-em)]](https://www.rsc.org/images/entities/char_2009.gif) cosθ (ref. 30) (where λ is the wavelength of Cu Kα, β is the full width at half maximum of the XRD peak, and θ is the Bragg diffraction angle) and the mass fraction of anatase (XA) was calculated by the formula XA = (1 + 1.26(IR/IA))−1 (ref. 31) (where IA and IR are the intensities of the anatase (101) plane and rutile (110) plane) and all the results are shown in Table 1. The crystallite size of pure TiO2 increases with increasing temperature. Sn–TiO2 shows a smaller crystallite size compared to pure TiO2 at the same temperature and the decreasing trend increases with increasing Sn content.
cosθ (ref. 30) (where λ is the wavelength of Cu Kα, β is the full width at half maximum of the XRD peak, and θ is the Bragg diffraction angle) and the mass fraction of anatase (XA) was calculated by the formula XA = (1 + 1.26(IR/IA))−1 (ref. 31) (where IA and IR are the intensities of the anatase (101) plane and rutile (110) plane) and all the results are shown in Table 1. The crystallite size of pure TiO2 increases with increasing temperature. Sn–TiO2 shows a smaller crystallite size compared to pure TiO2 at the same temperature and the decreasing trend increases with increasing Sn content.
| Temperature | Sample | Crystal structure | Crystallite size/nm |
|---|---|---|---|
| 350 °C | Pure TiO2 | Anatase | 15.7 |
| 1% Sn–TiO2 | Anatase | 12.0 | |
| 2.5% Sn–TiO2 | Anatase | 13.7 | |
| 5% Sn–TiO2 | Anatase | 11.3 | |
| 10% Sn–TiO2 | Anatase | 10.3 | |
| 15% Sn–TiO2 | Anatase | 10.8 | |
| 500 °C | Pure TiO2 | Anatase | 19.0 |
| 1% Sn–TiO2 | Anatase | 15.0 | |
| 2.5% Sn–TiO2 | Anatase (84.4 wt%)/rutile (15.6 wt%) | 14.6/35.6 | |
| 5% Sn–TiO2 | Anatase (89.2 wt%)/rutile (10.8 wt%) | 13.5/20.8 | |
| 10% Sn–TiO2 | Anatase (49.7 wt%)/rutile (50.3 wt%) | 14.0/15.1 | |
| 15% Sn–TiO2 | Anatase (61.8 wt%)/rutile (38.2 wt%) | 17.6/12.1 | |
| 650 °C | Pure TiO2 | Anatase (20.2 wt%)/rutile (79.8 wt%) | 25.8/36.9 |
| 1% Sn–TiO2 | Anatase (18.2 wt%)/rutile (81.8 wt%) | 27.0/42.3 | |
| 2.5% Sn–TiO2 | Rutile | 35.9 | |
| 5% Sn–TiO2 | Anatase (6.8 wt%)/rutile (93.2 wt%) | 23.7/34.0 | |
| 10% Sn–TiO2 | Rutile | 28.5 | |
| 15% Sn–TiO2 | Rutile | 26.5 |
As shown by the results in Table 1, it is clear that the mass percentage of rutile increases with increasing Sn content, suggesting that the transition from anatase to rutile is promoted and the phase transformation temperature is reduced by Sn doping. There are several explanations for this phenomenon. Tripathi et al.23 believe that higher surface energy is beneficial for the phase transformation. Anatase of smaller size has a higher surface energy and higher surface area and, therefore, it is easier to start the transformation. This viewpoint is still somewhat disputed. The doping of elements such as La28 and Ce32 in TiO2 always leads to a reduction in crystallite size. However, the phase transformation is inhibited and the transition temperature is evidently enhanced. Ding et al.33 are convinced that the melting point of MXOY (M is the doping element) is a key factor in the anatase–rutile phase transformation. The phase transformation will be promoted if the melting point of MXOY is lower than that of TiO2 (1640 °C) and it will be restrained when the melting point of MXOY is higher than that of TiO2. The melting point of SnO2 is 1127 °C, which is much lower than TiO2, and thus the addition of Sn promotes the phase transformation. Besides this, Kumar et al.34 and Merhraz et al.35 hold that the phase structure of SnO2 is similar to the rutile structure, which is in favor of the formation of the rutile phase during the phase transition. Consequently, the phase transformation temperature is reduced. In the present study, we believe the relatively low melting point of SnO2 and the structural similarity between SnO2 and TiO2 are propitious to the transition from anatase to rutile. There has been considerable research to demonstrate that TiO2 with an anatase structure or anatase/rutile mix structure exhibits excellent photocatalytic activity. From the discussion above, both the heat treatment temperature and Sn doping content affect the phase structure and further affect the photocatalytic activity of TiO2. This provides a feasible method to regulate the phase structure and obtain better photocatalytic activity for TiO2 via combining a proper heat treatment temperature and doping amount.
TG and DTA analyses
The thermal behavior and weight loss curves of pure TiO2 and 10% Sn–TiO2 are shown in Fig. 2. The TG curves of both samples are divided into three steps that are attributed to the evaporation of physically adsorbed water, the combustion of organic compounds, and dehydroxylation, respectively.20 However, the total weight loss of 38.91% of 10% Sn–TiO2, especially in the second stage with a weight loss of 14.32%, is more than that of the pure TiO2 sample, which indicates higher residual organic species losses in 10% Sn–TiO2.23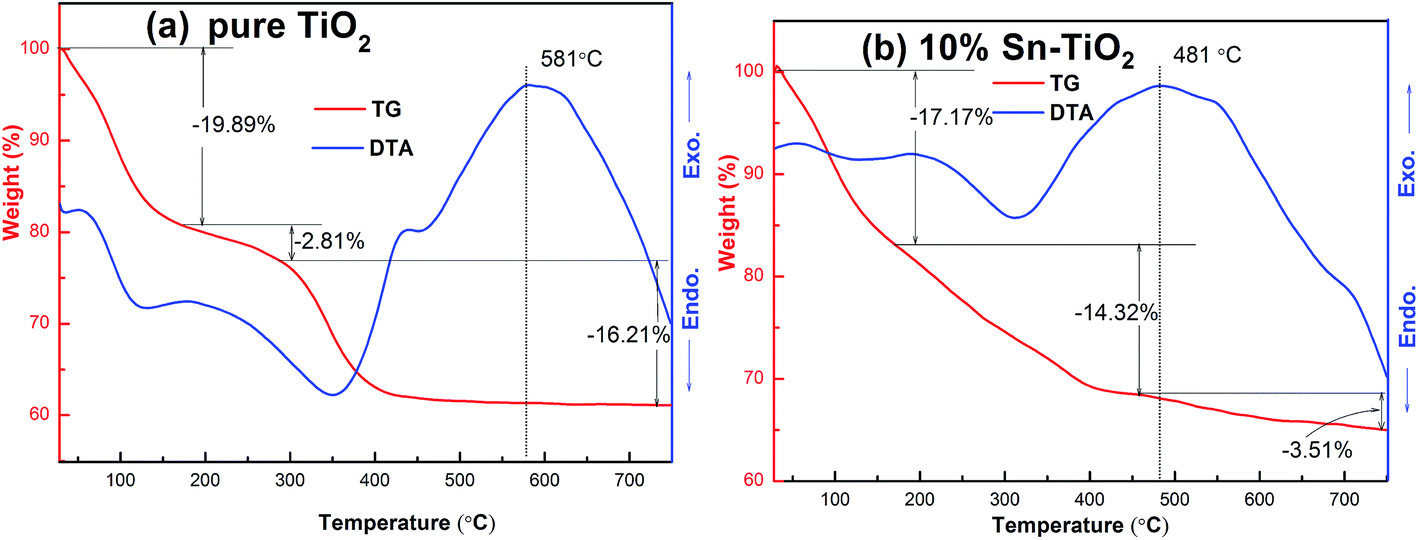 | ||
| Fig. 2 TG and DTA curves for pure TiO2 and 10% Sn–TiO2. | ||
As shown by the DTA curves, the exothermic and endothermic peaks of both samples are caused by the decomposition of physically adsorbed water and organic compounds at a temperature below 450 °C. Beyond 581 °C, the exothermic peak in the DTA curve reflects the phase transformation from anatase to rutile TiO2. The exothermic peak of pure TiO2 at approximately 581 °C can be attributed to both the combustion of organic compounds and the phase transition from anatase to rutile.7 Meanwhile, it is noticeable that the exothermic peak of 10% Sn–TiO2 is around 481 °C, which is lower than 581 °C, suggesting that the phase transformation temperature of anatase to rutile decreases with Sn doping. It is obvious that the phase transformation from anatase to rutile is promoted by Sn addition, which is in agreement with the XRD analysis in Fig. 1.
EDS and XPS analyses
Fig. 3 shows the EDS spectrum of 5% Sn–TiO2 annealed at 500 °C. The signals of the elements Ti, O, and Sn appear in the pattern, which confirms that Sn exists in the TiO2 sample.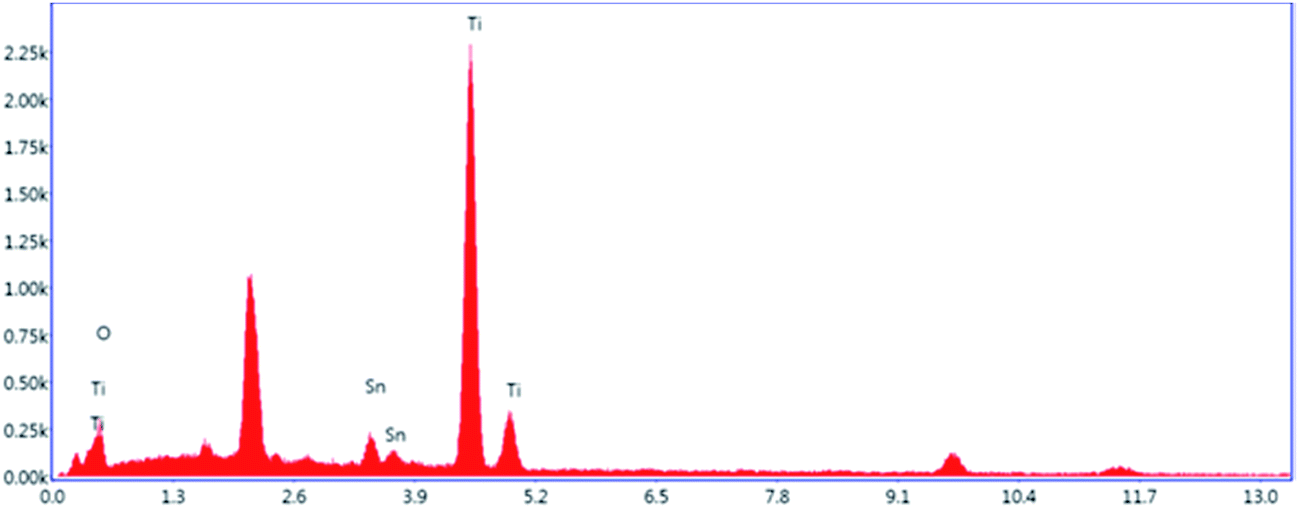 | ||
| Fig. 3 EDS spectrum of 5% Sn–TiO2 annealed at 500 °C. | ||
To identify the chemical valence states of the existing elements in TiO2, XPS measurement was carried out and the results for pure TiO2 and 5% Sn–TiO2 annealed at 500 °C are shown in Fig. 4. The total spectra of pure TiO2 and 5% Sn–TiO2 are depicted in Fig. 4a, in which the signals of C, Ti, and O can be detected in pure TiO2. Meanwhile, a peak of Sn 3d appears in 5% Sn–TiO2, which confirms that Sn exists in TiO2 via doping. The peaks of C 1s can be attributed to oil pollution from the equipment.
 | ||
| Fig. 4 The total spectra of pure TiO2 and 5% Sn–TiO2 annealed at 500 °C. | ||
The high-resolution spectra of Ti 2p are shown in Fig. 4b. There are two peaks of pure TiO2 at 458.33 eV and 463.99 eV, which are assigned to Ti 2p3/2 and Ti 2p1/2, respectively. The peak position of Ti 2p3/2 and Ti 2p1/2 suggests that Ti exists as Ti4+.20,36 Compared to pure TiO2, the Ti 2p of 5% Sn–TiO2 exhibits a slight positive shift, probably derived from the band bending, which is the consequence of the interaction between Sn, Ti, and O.37,38
Fig. 4c shows the high-resolution spectra of the O 1s of pure TiO2 and 5% Sn–TiO2. The O 1s of pure TiO2 consists of two peaks, located at 529.94 eV and 532.13 eV, corresponding to lattice oxygen and surface hydroxyl groups, respectively.25,37,39 Similarly, the O 1s of 5% Sn–TiO2 can also be divided into two peaks at 529.76 eV and 532.39 eV ascribed to lattice oxygen and surface hydroxyl groups. The ratio of surface hydroxyl groups in pure TiO2 is calculated to be 18.9% and it is 21.3% in 5% Sn–TiO2. It is obvious that the number of surface hydroxyl groups increases after Sn doping, which is conducive to the photocatalytic process.25,39
Fig. 4d depicts the high-resolution spectrum of Sn 3d with two peaks at 486.00 eV and 494.65 eV. These two peaks correspond to Sn 3d5/2 and Sn 3d3/2, respectively, indicating that the Sn is in the +4 state.20,25
DRS analysis
The influence of the addition of Sn on the optical properties of TiO2 is controversial. Several studies report that a red shift occurs upon Sn doping.16,17,23,40 On the contrary, others have concluded that the band gap energy of TiO2 increases, thus presenting a blue shift after the addition of Sn.19,25 Fig. 5 depicts the DRS spectra of pure TiO2 and Sn–TiO2 annealed at 500 °C. The band gap of TiO2 is calculated following the Kubelka–Monk function:23| (αhν)1/2 = A(hν − Eg), |
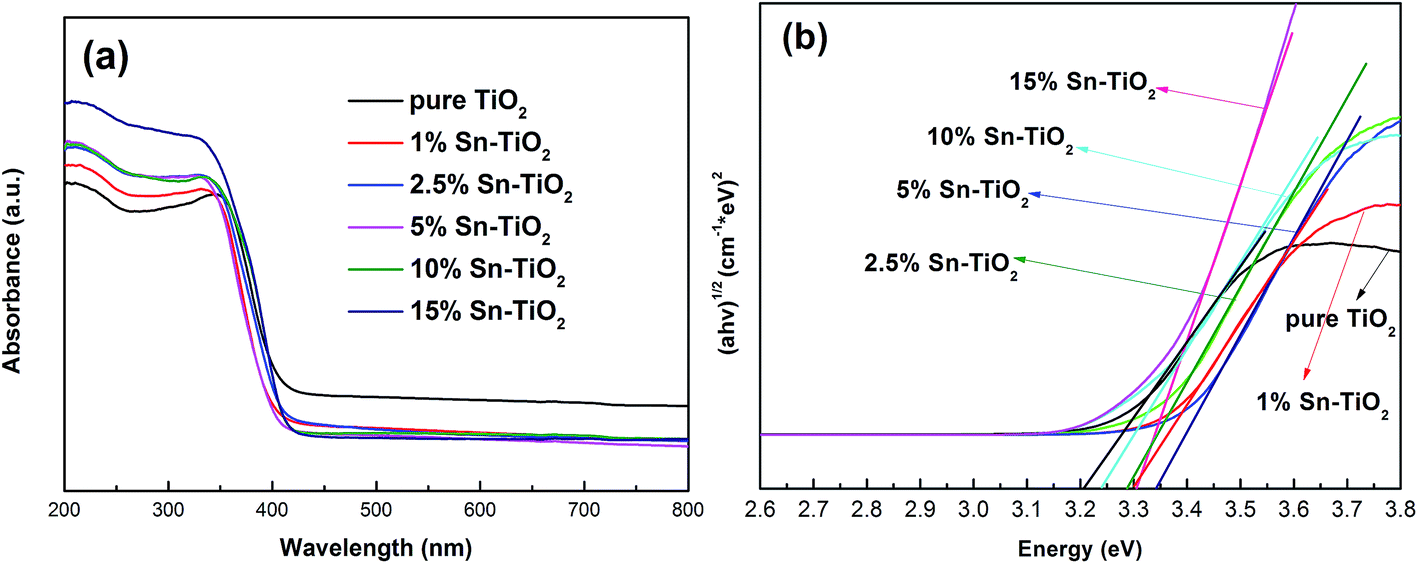 | ||
| Fig. 5 (a) UV-vis diffuse reflectance absorption spectra of pure TiO2 and Sn–TiO2 annealed at 500 °C. (b) Optical band gap of pure TiO2 and Sn–TiO2. | ||
The band gap energy of pure TiO2 is 3.20 eV, which is in accordance with the theoretical value. The Sn–TiO2 samples show a slight blue shift compared to pure TiO2. The band gap energy of 1% Sn–TiO2, 2.5% Sn–TiO2, 5% Sn–TiO2, 10% Sn–TiO2, and 15% Sn–TiO2 are determined to be 3.32 eV, 3.27 eV, 3.31 eV, 3.28 eV, and 3.27 eV, respectively. Obviously, the blue shift in the present work is in accordance with Bhange’s and Zhao’ work.19,25 Since size quantization effects come into play when the crystallite size is below 10 nm,19 the reason for the blue shift effect on account of Sn doping should not be ascribed to size quantization effects because the crystallite size of Sn-TiO2 is from 13.5 to 17.6 nm. The explanation for the blue shift is that the ionic radius of Sn4+ is close to that of Ti4+, and it is possible for Sn4+ ions to substitute Ti4+ ions in TiO2 lattices, changing the electronic structure of TiO2 and forming new energy levels.19
SEM analysis
Fig. 6 depicts the SEM images of pure TiO2 (a) and 5% Sn–TiO2 (b) annealed at 500 °C. The particles in the pure TiO2 sample show an irregular shape and large size distribution. The agglomerated bulks have a diameter in the range of 0.1–3 μm. By comparison, 5% Sn–TiO2 consists of smaller particles and exhibits relatively better distribution. The smaller particle size creates more reaction points, which is beneficial for photocatalytic degradation.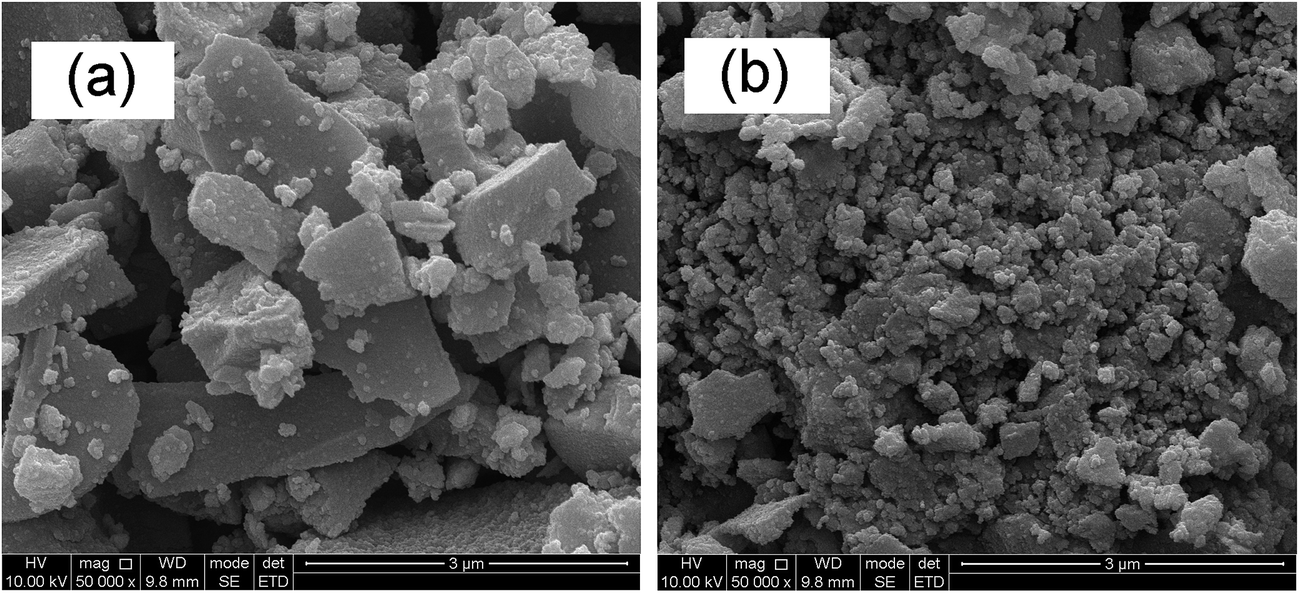 | ||
| Fig. 6 SEM images of pure TiO2 (a) and 5% Sn–TiO2 (b) annealed at 500 °C. | ||
BET analysis
The surface area of the samples was measured using BET theory on the nitrogen adsorption–desorption data and the results are shown in Table 2. The BET surface areas of pure TiO2, 1% Sn–TiO2, 5% Sn–TiO2, and 15% Sn–TiO2 annealed at 500 °C are 2.9, 13.8, 54.4, and 61.2 m2 g−1, respectively. It is obvious that the surface area increases tremendously after adding Sn. A higher Sn dopant level facilitates the enhancement of the surface area. The increased surface area can enhance the absorption of the light source, which contributes to the photocatalytic activity of TiO2.16| Sample | BET surface area (m2 g−1) |
|---|---|
| Pure TiO2 | 2.9 |
| 1% Sn–TiO2 | 13.8 |
| 5% Sn–TiO2 | 54.4 |
| 15% Sn–TiO2 | 61.2 |
PL analysis
Since photoluminescence (PL) emission is derived from the recombination of photogenerated electrons and holes, it can therefore provide accurate data of the recombination and separation of photogenerated pairs.29,41 The photoluminescence spectra of pure TiO2 and Sn–TiO2 annealed at 500 °C are shown in Fig. 7. The intensity of the emission spectra is observed to decrease with Sn concentration up to 5%. Sn4+ ions act as a trap for photogenerated electrons, thus increasing the separation rate of the photogenerated pairs.17 However, the intensity of the PL spectrum increases in the 10% Sn–TiO2, which indicates that further Sn doping content is harmful and increases the recombination of the photogenerated pairs. Unexpectedly, the PL spectrum intensity of 15% Sn–TiO2 is lower than that of 10% Sn–TiO2. Bhange et al.19 hold that the decrease in PL intensity at high Sn doping levels is derived from the formation of SnO2. The photogenerated electrons are able to move to the conduction band of SnO2 from the TiO2 surface, which improves the separation of the photogenerated pairs.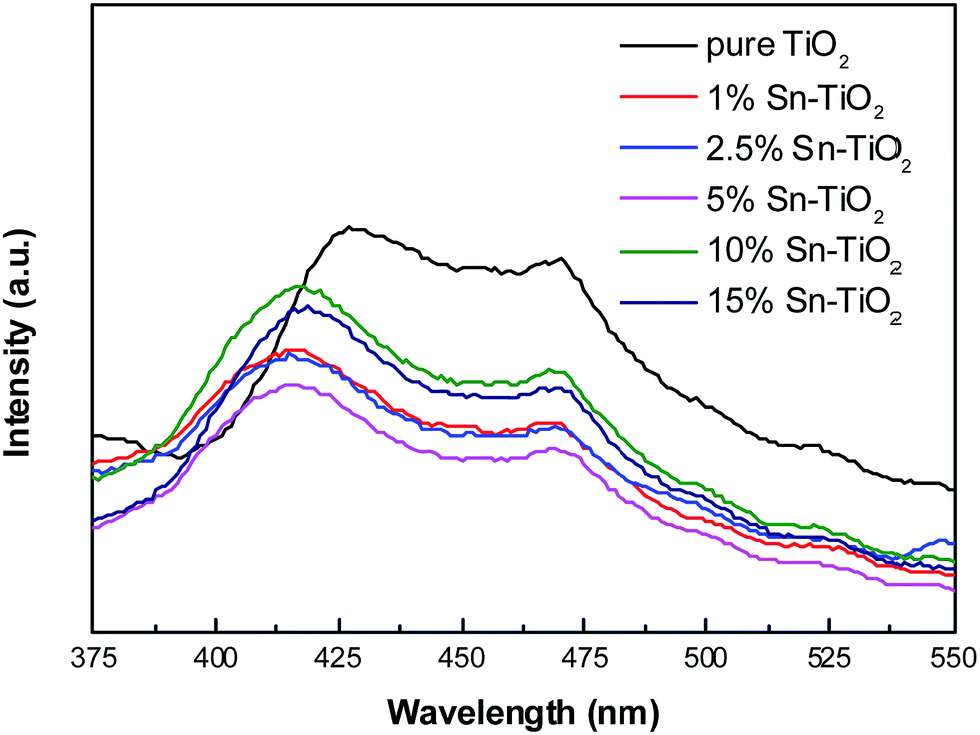 | ||
| Fig. 7 Photoluminescence spectra of pure TiO2 and Sn–TiO2 annealed at 500 °C. | ||
Photocatalytic activity
The photocatalytic activity of all the prepared samples was investigated via the decomposition of RhB solution. The degradation rates of RhB under UV light over pure TiO2 and Sn–TiO2 heat treated at 350 °C, 500 °C, and 650 °C are shown in Fig. 8. The prepared TiO2 nanomaterials that were heat treated at 350 °C show degradation rates of 46.2%, 99.5%, 99.2%, 96.7%, 92.2%, and 85.1% with an Sn dopant concentration of 0%, 1%, 2.5%, 5%, 10%, and 15% after 180 min. The results reveal that pure TiO2 shows relatively low photocatalytic activity at 350 °C. The degradation rate of pure TiO2 annealed at 500 °C is 62.5%, which is 1.35 times higher than that of pure TiO2 annealed at 350 °C. This enhancement is ascribed to the increase in the degree of crystallinity with rising temperature.42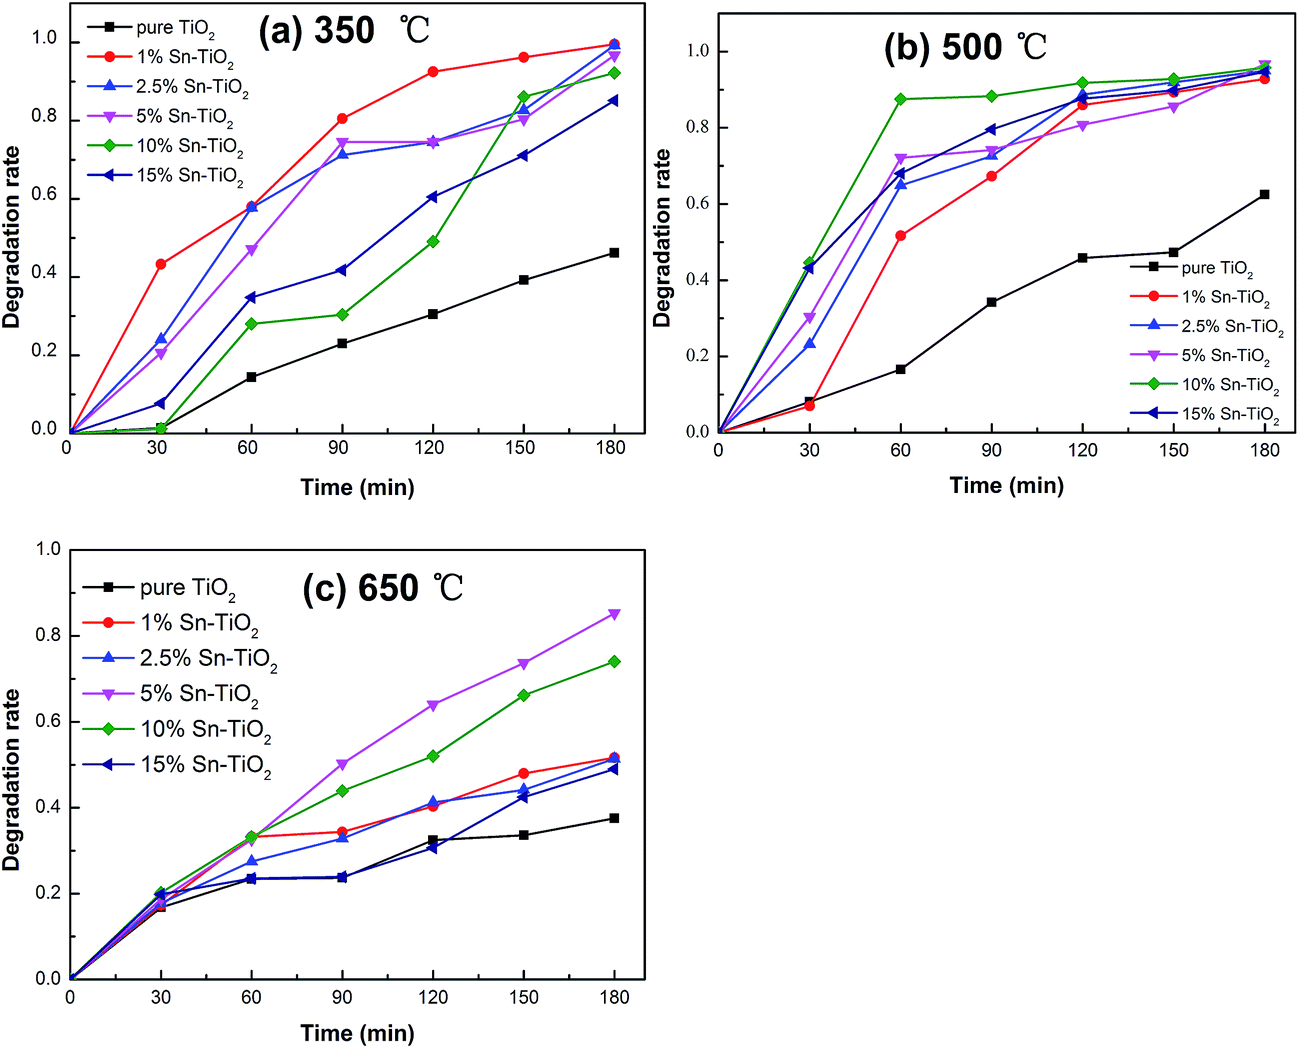 | ||
| Fig. 8 Photocatalytic degradation of RhB for pure TiO2 and Sn–TiO2 annealed at 350 °C (a), 500 °C (b), and 650 °C (c). | ||
The degradation rates of 1% Sn–TiO2, 2.5% Sn–TiO2, 5% Sn–TiO2, 10% Sn–TiO2, and 15% Sn–TiO2 annealed at 500 °C are 92.8%, 95.0%, 96.7%, 95.8%, and 94.7%, respectively. All the Sn–TiO2 samples show higher degradation rates compared to that of pure TiO2, which clearly states that the photocatalytic activity of TiO2 improves significantly with Sn doping. From the results of the XRD and BET analyses, it is clear that Sn–TiO2 nanomaterials have a smaller crystallite size and larger surface area compared to pure TiO2. The increased surface area is in favor of the photocatalytic reaction process, owing to the presence of more reaction spots.19 In addition, the lattice expansion caused by the substitution of Ti4+ ions with Sn4+ ions leads to the formation of more surface defects. The resulting defects capture photogenerated electrons and thus suppress the recombination of the photogenerated pairs effectively,17 which is proven by the PL measurement. Besides this, from the XPS results, it is found that more surface hydroxyl groups form on the surface of Sn–TiO2, indicating that the hydration ability and the adsorption ability of the RhB molecules are enhanced by Sn doping. Therefore, Sn–TiO2 exhibits a higher photocatalytic activity than pure TiO2.25 Among the samples heat treated at 350 °C, 1% Sn–TiO2 shows the best photocatalytic activity. A further increase in the addition of Sn results in a decline in the photocatalytic activity because the excess Sn4+ ions act as recombination centers for the photogenerated pairs.41 It is worth noting that 5% Sn–TiO2 exhibits the best photocatalytic activity, and 10% Sn–TiO2 and 15% Sn–TiO2 also present high photocatalytic activity. From the XRD results, it is observed that rutile TiO2 forms in the 2.5% Sn–TiO2, 5% Sn–TiO2, 10% Sn–TiO2, and 15% Sn–TiO2 samples. The mixture of anatase and rutile can promote the transfer of photogenerated electrons, which prolongs the lifetime of the photogenerated pairs and thus improves the photocatalytic activity.21,24 SnO2 forms in the 10% Sn–TiO2 and 15% Sn–TiO2 samples and the combination of SnO2 with TiO2 also has a mixture effect, which is beneficial to the photocatalytic activity.19,25
The degradation rates of pure TiO2, 1% Sn–TiO2, 2.5% Sn–TiO2, 5% Sn–TiO2, 10% Sn–TiO2, and 15% Sn–TiO2 heat treated at 650 °C are 37.5%, 51.7%, 51.4%, 85.2%, 74.0%, and 49.0%, respectively. All the samples show lower photocatalytic activity compared to those treated at 500 °C, owing to the high rutile content (Fig. 1c). It is well known that rutile TiO2 exhibits lower photocatalytic activity because of its poor hydroxylation and oxygen absorption. As a result, excess rutile leads to lower photocatalytic activity.24,43
The kinetics of the photocatalytic degradation of RhB can be described by a first order kinetics model and the reaction rate constant k can be calculated from the following equation:44
| kt = −ln(Ct/C0) |
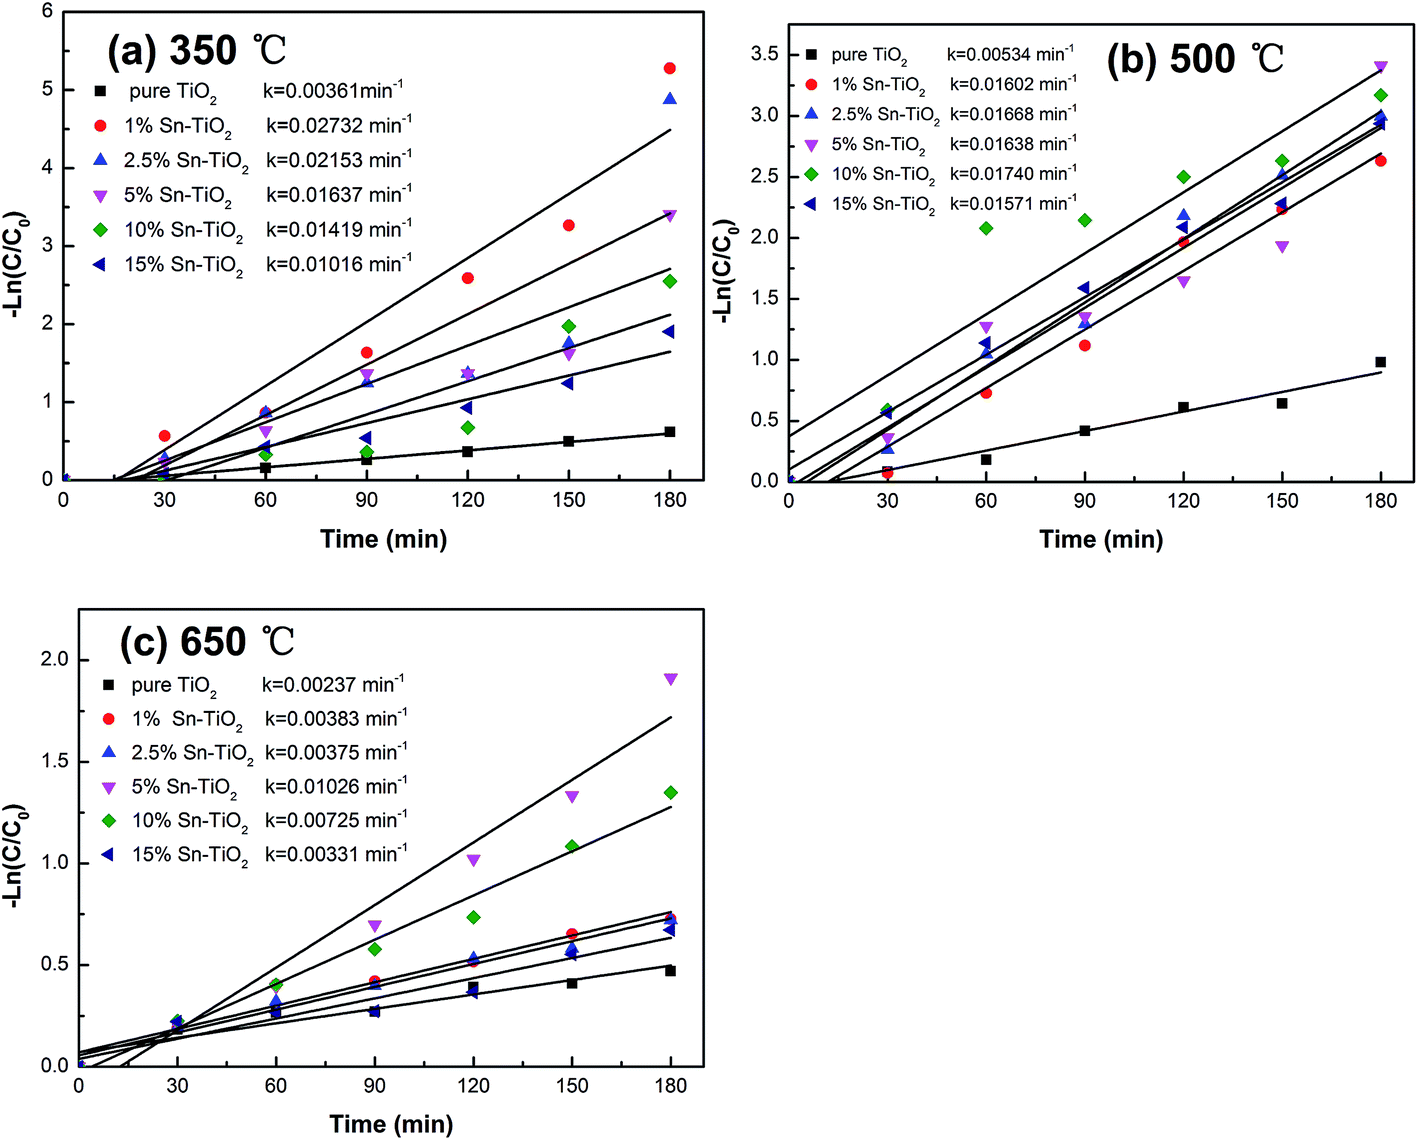 | ||
| Fig. 9 First-order reaction rate constant k against reaction time for different photocatalysts annealed at 350 °C (a), 500 °C (b), and 650 °C (c). | ||
Conclusion
In summary, we reported a simple sol–gel method for the synthesis of pure TiO2 and Sn–TiO2. The prepared TiO2 nanomaterials were characterized by XRD, TG, DTA, EDS, XPS, DRS, SEM, BET, and PL. The results reveal that all the samples form anatase after calcining at 350 °C, while rutile appears in Sn–TiO2 with high dopant levels at temperatures up to 500 °C and rutile is dominant at 650 °C. The addition of Sn promotes the phase transformation from anatase to rutile. The photocatalytic test results show that both the heat treatment temperature and Sn dopant concentration affect the photocatalytic activity of TiO2. 1% Sn–TiO2 shows the highest degradation rate at 350 °C and 5% Sn–TiO2 exhibits the highest degradation rates at 500 °C and 650 °C.Conflicts of interest
There are no conflicts to declare.Acknowledgements
This work was supported by the Open Research Subject of the Powder Metallurgy Engineering Technology Research Center of Sichuan Province, China (grant no. SC-FMYJ2017-03, SC-FMYJ2017-05), the Key Project of the Sichuan Science and Technology Department of China (grant no. 2017GZ0402), Natural Science and Technology Research Projects of Chengdu, China (grant no. 2015-HM01-00385-SF), and the Open Research Subject of the Key Laboratory of Special Material and Preparation Technology of Sichuan Province, China (grant no. szjj2017-062).References
- F. Mehmood, J. Iqbal, T. Jan, A. Gul, Q. Mansoor and R. Faryal, Vib. Spectrosc., 2017, 93, 78 CrossRef CAS.
- A. S. Pawar, S. S. Garje and N. Revaprasadu, Mater. Chem. Phys., 2016, 183, 366 CrossRef CAS.
- O. Bechambi, M. Chalbi, W. Najjar and S. Sayadi, Appl. Surf. Sci., 2015, 347, 414 CrossRef CAS.
- T. S. Jamil, H. A. Abbas, A. M. Youssief, E. S. Mansor and F. F. Hammad, Chimia Rep., 2017, 20, 97 CrossRef CAS.
- B. Choudhury, R. Verma and A. Choudhury, RSC Adv., 2014, 4, 29314 RSC.
- M. G. Alalm, A. Tawfik and S. Ookawara, J. Environ. Chem. Eng., 2016, 4, 1929 CrossRef.
- M. K. Sahnesarayi, H. Sarpoolaky and S. Rastegari, Surf. Coat. Technol., 2014, 258, 861 CrossRef.
- H. J. Lin, T. S. Yang, C. S. Hsi, M. C. Wang and K. C. Lee, Ceram. Int., 2014, 40, 10633 CrossRef CAS.
- M. Iwasaki, M. Hara, H. Kawada, H. Tada and S. Ito, J. Colloid Interface Sci., 2000, 224, 202 CrossRef CAS PubMed.
- I. Horovitz, D. Avisar, M. A. Baker, R. Grilli, L. Lozzi, D. D. Camillo and H. Mamane, J. Hazard. Mater., 2016, 310, 98 CrossRef CAS PubMed.
- Y. Zhang, T. Wang, M. Zhou, Y. Wang and Z. M. Zhang, Ceram. Int., 2016, 43, 3118 CrossRef.
- F. Bensouici, M. Bououdina, A. A. Dakhel, R. Tala-Ighil, M. Tounane, A. Iratni, T. Souier, S. Liu and W. Cai, Appl. Surf. Sci., 2017, 395, 110 CrossRef CAS.
- Q. Guo, Z. H. Zhang, X. P. Ma, K. Jing, M. L. Shen, N. Yu, J. H. Tang and D. D. Dionysiou, Sep. Purif. Technol., 2017, 175, 305 CrossRef CAS.
- J. Su, Z. D. Li, Y. Q. Zhang, Y. J. Wei and X. D. Wang, Catal. Today, 2017, 282, 31 CrossRef.
- C. M. Malengreaux, S. L. Pirard, G. Léonard, J. G. Mahy, M. Herlitschke, B. Klobes, R. Hermann, B. Heinrichs and J. R. Bartlett, J. Alloys Compd., 2017, 691, 726 CrossRef CAS.
- J. L. Li, X. T. Xu, X. J. Liu, C. Y. Yu, D. Yan and Z. Sun, J. Alloys Compd., 2016, 679, 454 CrossRef CAS.
- R. M. Mohamed and E. S. Aazam, J. Alloys Compd., 2014, 595, 8 CrossRef CAS.
- H. B. Jiang, J. Xing, Z. P. Chen, F. Tian, Q. Cuan, X. Q. Gong and H. G. Yang, Catal. Today, 2014, 225, 18 CrossRef CAS.
- P. D. Bhange, S. V. Awate, R. S. Gholap, G. S. Gokavi and D. S. Bhange, Mater. Res. Bull., 2016, 76, 264 CrossRef CAS.
- D. A. Solís-Casados, L. Escobar-Alarcón, L. M. Gómez-Oliván, E. Haro-Poniatowski and T. Klimova, Fuel, 2017, 198, 3 CrossRef.
- A. K. Alves, F. A. Berutti and C. P. Bergmann, Catal. Today, 2013, 208, 7 CrossRef CAS.
- N. P. Tangale, P. S. Niphadkar, V. Samuel, S. S. Deshpande, P. N. Joshi and S. V. Awate, Mater. Lett., 2016, 171, 50 CrossRef CAS.
- A. K. Tripathi, M. C. Mathpal, P. Kumar, M. K. Kumar, M. A. G. Soler and A. Agarwal, J. Alloys Compd., 2015, 622, 37 CrossRef CAS.
- Q. Gao, X. M. Wu, Y. H. Ma, D. Q. Li, Y. M. Fan and C. Du, Ceram. Int., 2016, 42, 17148 CrossRef CAS.
- Y. Zhao, J. Liu, L. Y. Shi, S. Yuan, J. H. Feng, Z. Y. Wang and M. H. Zhang, Appl. Catal., B, 2011, 103, 436 CrossRef CAS.
- C. S. Chua, O. K. Tan, M. S. Tse and X. Z. Ding, Thin Solid Films, 2013, 544, 571 CrossRef CAS.
- A. Bokare, M. Pai and A. A. Athawale, Sol. Energy, 2013, 91, 111 CrossRef CAS.
- W. Zhang, X. J. Li, G. Jia, Y. F. Gao, H. Wang, Z. Z. Cao, G. H. Li and J. R. Liu, Catal. Commun., 2014, 45, 144 CrossRef CAS.
- M. Wei, J. M. Wan, Z. W. Hu, Z. Q. Peng, B. Wang and H. G. Wang, Appl. Surf. Sci., 2017, 391, 267 CrossRef CAS.
- V. Uvarov and I. Popov, Mater. Charact., 2007, 58, 883 CrossRef CAS.
- R. Spurr and H. Myers, Anal. Chem., 1957, 29, 760 CrossRef CAS.
- S. Kityakarn, Y. Pooarporn, P. Songsiriritthigul, A. Worayingyong, S. Robl, A. M. Braun and M. Wörner, Electrochim. Acta, 2012, 83, 113 CrossRef CAS.
- X. Z. Ding, L. Liu, X. M. Ma, Z. Z. Qi and Y. Z. He, Mater. Lett., 1994, 13, 462 CrossRef.
- K. P. Kumar, D. J. Fray, J. Nair, F. Mizukami and T. Okubo, Scripta Mater., 2007, 57, 771 CrossRef CAS.
- S. Mehraz, P. Konsong, A. Taleb, N. Dokhane and L. Sikong, Sol. Energy Mater. Sol. Cells, 2017 DOI:10.1016/j.solmat.2017.06.048.
- D. G. Huang, S. J. Liao, W. B. Zhou, S. Q. Quan, L. Liu, Z. J. He and J. B. Wan, J. Phys. Chem. Solids, 2009, 70, 853 CrossRef CAS.
- Y. D. Duan, N. Q. Fu, Q. Zhang, Y. Y. Fang, X. W. Zhou and Y. Lin, Electrochim. Acta, 2013, 107, 473 CrossRef CAS.
- Z. Zhang and J. T. Yates, Chem. Rev., 2012, 112, 5520 CrossRef CAS PubMed.
- M. V. Dozzi, L. Artiglia, G. Granozzi, B. Ohtani and E. Selli, J. Phys. Chem. C, 2014, 118, 25579 CAS.
- F. E. Oropeza, B. Davies, R. G. Palgrave and R. G. Egdel, Phys. Chem. Chem. Phys., 2011, 13, 7882 RSC.
- A. Kadam, R. Dhabbe, D. Shin, K. Garadkar and J. Park, Ceram. Int., 2017, 43, 5164 CrossRef CAS.
- B. Erjavec, R. Kaplan and A. Pintar, Catal. Today, 2015, 241, 15 CrossRef CAS.
- O. Carp, C. L. Huisman and A. Reller, Prog. Solid State Chem., 2004, 32, 33 CrossRef CAS.
- I. Ali, S. Kim, S. Kim and J. Kim, Catal. Today, 2016, 282, 31 CrossRef.
| This journal is © The Royal Society of Chemistry 2018 |