DOI:
10.1039/C8RA00733K
(Paper)
RSC Adv., 2018,
8, 19570-19579
Three new cardiac glycosides obtained from the roots of Streblus asper Lour. and their cytotoxic and melanogenesis-inhibitory activities†
Received
24th January 2018
, Accepted 17th April 2018
First published on 29th May 2018
Abstract
Three new cardiac glycosides strophanthidin-3-O-α-L-rhamnopyranosyl-(1→4)-6-deoxy-β-D-allopyranoside (1), 5βH-16β-acetylkamaloside (2), and mansonin-19-carboxylic acid (3) along with seven known steroids including five cardiac glycosides were isolated from the methanol extracts of Streblus asper Lour. roots. The structures of these compounds were established by spectroscopic analyses. The cytotoxicities of crude extracts and all the isolated compounds were evaluated against four human cancer cell lines (HL60, A549, AZ521, and SKBR3). Furthermore, the selective index (SI) of each compound was measured by the ratio of cytotoxic effect on a normal cell line (WI38) to the cytotoxic effect on cancer cell line (A549). The results suggested that cardiac glycosides (2, 4, and 6–8) exhibited significant cytotoxicities with IC50 values from 0.01 to 3.77 μM as well as high selective index for WI38/A549 (SI 1.50–24.26), and they displayed superior selectivities when compared with the reference cisplatin (SI 1.09). Preliminary structure–activity relationships (SARs) were also discussed regarding the type of C-10 group in the cardiac glycosides being a crucial factor in determining the cytotoxic activities and regarding the sugar moieties having much less of an active role than the type of C-10 group. In addition, the melanogenesis-inhibitory abilities of these compounds were also evaluated. Cardiac glycosides (3 and 6–8) displayed moderate inhibition effects on melanogenesis with melanin content (MC) of 26.22–74.90% at a concentration of 100 μM, thus showing high cell viability (CV: 77.94–111.70%) compared with that of the reference arbutin (MC: 82.50% and CV: 107.60%). Furthermore, western blot analysis of melanogenesis-related proteins suggested that 3 could inhibit melanogenesis by suppressing the protein expressions of TRP-2 and tyrosinase.
1. Introduction
The small trees of Streblus asper Lour. (Moraceae) are mainly distributed in tropical regions including India, Sri Lanka, Malaysia, Thailand, Vietnam, and South-west China.1,2 S. asper is traditionally used in Ayurveda and in the medicine of Chinese minorities for the treatment of different ailments.1,2 In Ayurveda, the roots of S. asper are used to treat unhealthy ulcers, sinuses, epilepsy, and obesity, and they are applied locally as an antidote to snake bite.1 In current pharmacologic research, S. asper has exhibited antifilarial,3,4 antimicrobial,5 antimalarial,6 anti-HBV,7,8 antidiabetic,9 cytotoxic, and antineoplastic activities.10–12 The chemical constituents of S. asper including flavonoids,7,13 volatile oils,14 phenolic acids,4 fatty acids,15 phenylpropanoids,7,8,16,17 and cardiac glycosides18–21 have been extensively studied. Numerous cardiac glycosides have also been discovered from the roots of this plant.18
In this study, three new cardiac glycosides (1–3) were discovered through phytochemical research on the roots of S. asper. The structures of the isolated compounds were characterized by spectroscopic analyses and compared with the results of the literature data. The cytotoxicities of the crude extracts and isolated compounds were evaluated against HL60, A549, AZ521, and SKBR3 human cancer cell lines as well as WI38 human normal cell line for obtaining the selective index (SI). Combining the structural characteristics, the structure–activity relationships (SARs) of potential bioactive cardiac glycosides were also evaluated. Bufalin is a cardiac aglycone, which belongs to bufanolide, and it can stimulate melanin synthesis in B16F10.22 Thus, cardiac glycosides (3–8) having aglycones belonging to cardenolides were selected for the evaluation of their ability to stimulate melanin synthesis in α-melanocyte (α-MSH)-stimulated B16F10 cells. It was interesting that 3–8 showed melanogenesis-inhibitory abilities. Hence, we chose four key melanogenesis-related proteins to further explore the mechanisms of melanogenesis-inhibitory activities using western blot.
2. Results and discussion
2.1 Cytotoxic and melanogenesis-inhibitory activities of the extracts of S. asper roots
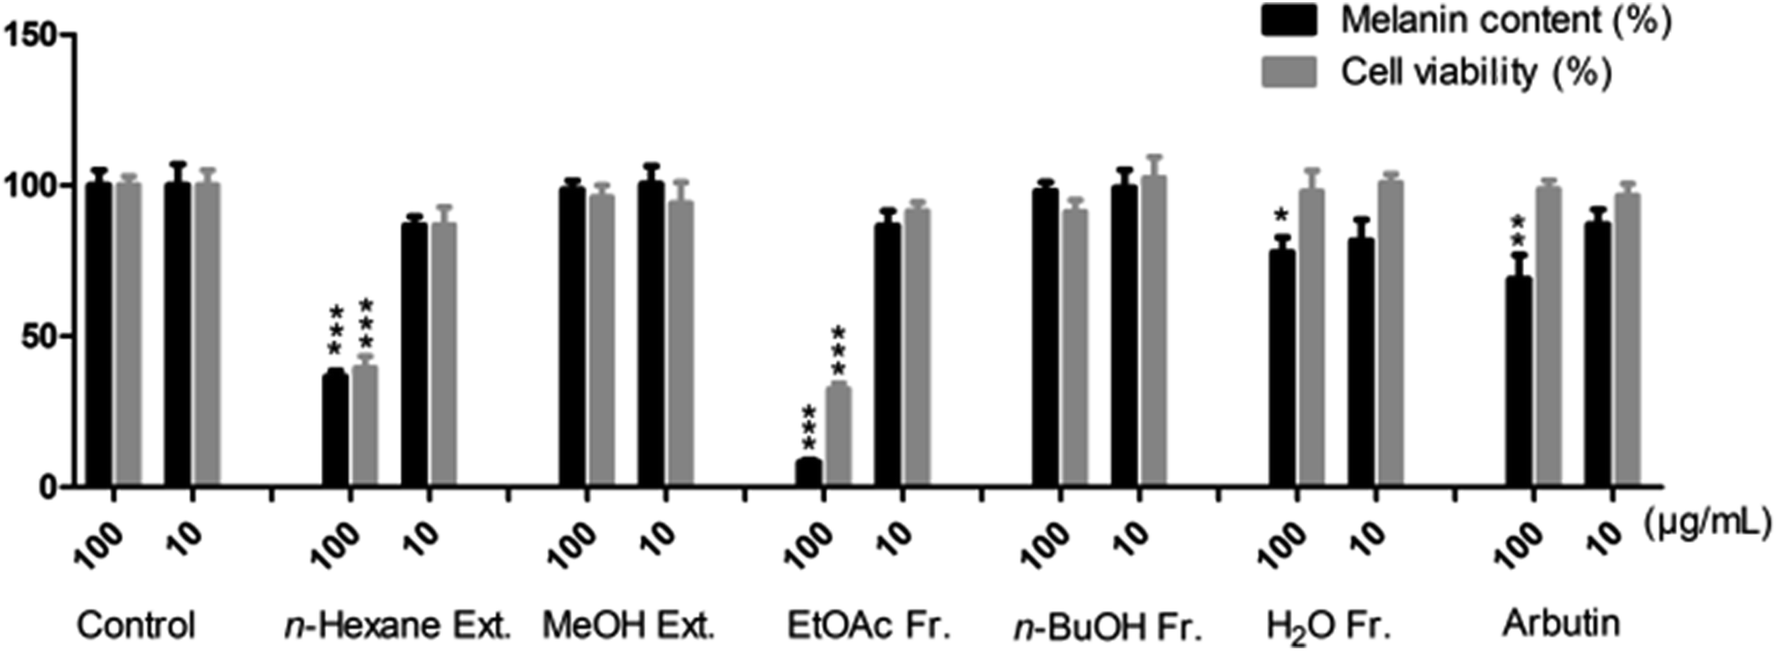
Dried S. asper roots were extracted with n-hexane first and then, the defatted residue was extracted with MeOH. The methanol extract was successively fractionated into EtOAc, n-BuOH and H2O fractions. Both the extracts and fractions were evaluated for cytotoxic activities against four human cancer cell lines (HL60, A549, AZ521, and SKBR3) and inhibitory potentials on the production of melanin in α-MSH-activated B16F10 cells. As shown in Table 1, the EtOAc and n-BuOH fractions exhibited strong activities and IC50 values ranging from 0.05 to 1.79 μg mL−1, which were higher than those of the reference cisplatin (IC50 1.14–5.60 μg mL−1). As shown in Fig. 1, the n-hexane extract and EtOAc fraction inhibited melanin production significantly by 36.6% and 8.3% (MC), respectively, at a high concentration of 100 μg mL−1; moreover, the n-hexane extract and EtOAc fraction displayed values of 86.7% and 86.6% (MC) at a low concentration of 10 μg mL−1 along with weak toxicities (CV: 86.8% and 91.4%, respectively), which were similar to those of the reference arbutin (MC: 87.1%, CV: 96.5%). Herein, the EtOAc and n-BuOH fractions, which exhibited reasonable cytotoxicities and melanogenesis inhibition, were chosen for further investigation of their constituents in this study.
Table 1 Cytotoxicities of extracts and fractions of S. asper roots
| Samples |
Cytotoxicity IC50a (μg mL−1) |
| HL60 |
A549 |
AZ521 |
SKBR3 |
| IC50: 50% inhibition concentration, the values based on quintuple points. Each value represents the mean ± SD (n = 3). |
| n-Hexane Ext. |
63.50 ± 12.80 |
85.50 ± 4.90 |
58.50 ± 4.90 |
>100 |
| MeOH Ext. |
0.22 ± 0.10 |
0.01 ± 0.01 |
0.01 ± 0.01 |
1.00 ± 0.10 |
| EtOAc Fr. |
0.11 ± 0.01 |
0.05 ± 0.01 |
0.05 ± 0.01 |
1.79 ± 0.10 |
| n-BuOH Fr. |
0.31 ± 0.02 |
0.10 ± 0.01 |
0.10 ± 0.01 |
0.94 ± 0.17 |
| H2O Fr. |
5.80 ± 0.10 |
37.50 ± 4.37 |
37.50 ± 4.37 |
>100 |
| Cisplatin |
1.14 ± 0.30 |
5.50 ± 0.60 |
2.90 ± 0.60 |
5.60 ± 0.20 |
 |
| | Fig. 1 Melanin content and cell viability were determined for melanogenesis-inhibitory activities of S. asper in B16F10 cell lines, which with and without α-MSH treatment were used as negative controls, whereas arbutin was used as the positive control. *P < 0.05, **P < 0.01, ***P < 0.001 compared with α-MSH model group in three separate experiments. | |
2.2 Identification and structure elucidation
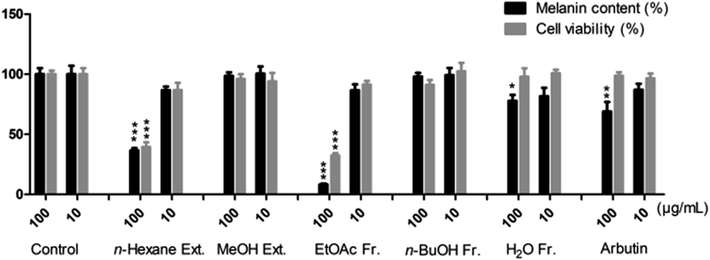
The phytochemical results for EtOAc and n-BuOH fractions were obtained via column chromatography with the use of silica gel (Sephadex LH-20, ODS) and semipreparative RP-18 HPLC, which led to the isolation of ten compounds. Three new cardiac glycosides strophanthidin-3-O-α-L-rhamnopyranosyl-(1→4)-6-deoxy-β-D-allopyranoside (1), 5βH-16β-acetylkamaloside (2), and mansonin-19-carboxylic acid (3) as well as seven known compounds mansonin (4),10 strebloside (5),10 glucostrebloside (6),10,23 kamaloside (7),10,24 glucokamaloside (8),10,23,24 β-sitosterol (9)25 and β-sitosterol-3-O-β-D-glucopyranoside (10)25 (Fig. 2) were obtained. The structures of these isolated compounds were elucidated using spectroscopic data including 1D-NMR and 2D-NMR.
 |
| | Fig. 2 The structures of 1–10 isolated from the MeOH extract of S. asper roots. | |
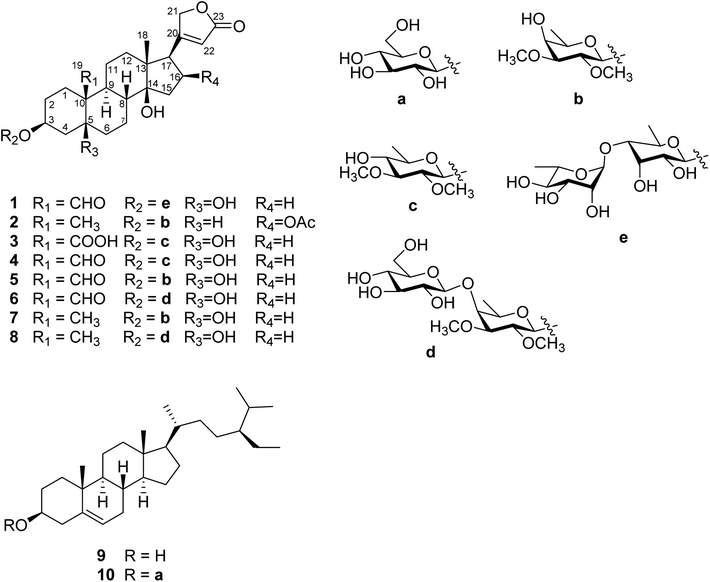
Compound 1 was obtained as white powder, and it was assigned the molecular formula C35H52O14, which was deduced from HR-ESI-MS (m/z 719.3233 [M + Na]+, calcd for 719.3255), thus indicating ten degrees of unsaturation. The 1H-NMR data showed resonance characteristics of the α, β-unsaturated-γ-lactone moiety at δH 6.15 (1H, s, H-22), 5.30 (1H, d, J = 18.0 Hz, H-21a), and 5.04 (1H, d, J = 18.0 Hz, H-21b). Furthermore, the presence of signals at δH 10.41 (1H, s, H-19), 4.44 (1H, m, H-3), 2.79 (1H, m, H-17), and 1.01 (3H, s, H-18) suggested that its aglycone moiety was similar with that of the known strophanthidin-3-O-β-D-glucopyranosyl-(1→6)-O-β-D-glucopyranosyl-(1→4)-O-β-D-diginopyranosyl-(1→4)-O-β-D-oleandropyranosyl-(1→4)-O-β-D-digitoxopyranosyl-(1→4)-β-D-digitoxopyranoside compound, which was confirmed as the strophanthidin skeleton by 1D-NMR and 2D-NMR data (Table 2).26 The resonance characteristics at δH 5.39 (1H, d, J = 7.8 Hz, H-1′), 5.52 (1H, s, H-1′′), 1.41 (3H, d, J = 5.4 Hz, H-6′), 1.48 (3H, d, J = 6.0 Hz, H-6′′), and δC 99.5 (C-1′), 104.9 (C-1′′) suggested that 1 had two 6-deoxysugars. Analyses of 1D-NMR and 2D-NMR data revealed that the sugar moieties were 6-deoxy-β-D-allose and α-L-rhamnose;27,28 their absolute configurations were determined by acid hydrolysis, and the results were compared with those of the standard substances. The HMBC correlations between H-1′ and C-3 as well as H-1′′ and C-4′ were used to establish the positions of the sugar units. Accordingly, compound 1 was identified as strophanthidin-3-O-α-L-rhamnopyranosyl-(1→4)-6-deoxy-β-D-allopyranoside (Fig. 3).
Table 2 1H-NMR and 13C-NMR spectroscopic data of compounds 1–3 (δ in ppm, J in Hz)
| Position |
1a |
2b |
3b |
| δC |
δH |
HMBC (H→C) |
δC |
δH |
HMBC (H→C) |
δC |
δH |
HMBC (H→C) |
| 1H-(600 MHz) and 13C-(150 MHz) NMR spectroscopic data in pyridine-d5. 1H-(400 MHz) and 13C-(100 MHz) NMR spectroscopic data in chloroform-d. |
| 1 |
19.2 |
1.89, m |
10 |
30.3 |
1.44, m |
|
21.4 |
1.44, m |
19 |
| |
|
2.68, dd (13.8, 13.8) |
|
|
1.51, m |
|
|
2.39, m |
|
| 2 |
25.4 |
1.41, m |
|
26.7 |
1.26, m |
|
25.6 |
1.57, m |
|
| |
|
2.45, d (13.8) |
|
|
1.50, m |
|
|
1.93, m |
|
| 3 |
73.9 |
4.44, m |
|
73.1 |
4.06, br s |
|
73.5 |
4.25, br s |
|
| 4 |
35.5 |
1.84, m |
5 |
29.6 |
1.26, m |
|
33.7 |
1.81, m |
|
| |
|
2.12, m |
|
|
1.73, m |
|
|
2.12, m |
|
| 5 |
74.1 |
|
|
36.3 |
1.72, m |
|
75.1 |
|
|
| 6 |
42.4 |
1.55, m |
4, 5 |
26.6 |
1.25, m |
|
36.5 |
1.65, m |
|
| |
|
2.29, d (12.0) |
|
|
1.88, m |
|
|
1.76, m |
|
| 7 |
23.1 |
1.37, m |
5 |
21.2 |
1.69, m |
|
24.1 |
1.17, m |
|
| |
|
1.56, d (5.4) |
|
|
1.74, m |
|
|
2.07, m |
|
| 8 |
40.1 |
1.41, m |
6 |
41.9 |
1.57, m |
|
40.9 |
1.24, m |
|
| 9 |
40.0 |
1.77, m |
10, 11, 13 |
35.9 |
1.58, m |
|
40.1 |
1.96, m |
|
| 10 |
56.0 |
|
|
35.2 |
|
|
53.4 |
|
|
| 11 |
26.4 |
1.76, m |
13 |
20.9 |
1.20, m |
|
21.9 |
1.86, m |
|
| |
|
2.11, m |
|
|
1.48, m |
|
|
2.25, m |
|
| 12 |
38.2 |
1.76, m |
|
39.4 |
1.32, m |
|
39.6 |
1.34, m |
|
| |
|
2.34, d (16.2) |
|
|
1.54, m |
|
|
1.56, m |
|
| 13 |
50.4 |
|
|
50.1 |
|
|
49.9 |
|
|
| 14 |
84.9 |
|
|
84.4 |
|
|
85.4 |
|
|
| 15 |
32.7 |
1.84, m |
13, 14 |
41.3 |
1.77, dd (15.6, 2.4) |
13 |
32.5 |
1.73, m |
|
| |
|
2.05, m |
|
|
2.73, dd (15.6, 9.6) |
|
|
1.93, m |
|
| 16 |
27.7 |
1.99, m |
|
74.1 |
5.47, td (9.2, 2.4) |
16-O![[C with combining low line]](https://www.rsc.org/images/entities/char_0043_0332.gif) OCH3 OCH3 |
26.9 |
2.09, m |
|
| |
|
2.07, m |
|
|
|
20 |
|
2.20, m |
|
| 17 |
51.6 |
2.79, m |
8, 13, 14, |
56.2 |
3.20, m |
13, 20, 21, |
50.5 |
2.75, m |
16 |
| |
|
|
20, 21, 22 |
|
|
|
|
|
|
| 18 |
16.5 |
1.01, s |
8, 13, 14 |
16.1 |
0.93, s |
12, 13, 14, |
15.8 |
0.96, s |
12, 13, 14, |
| |
|
|
|
|
|
|
|
|
17 |
| 19 |
209.3 |
10.41, s |
1, 10 |
23.9 |
0.92, s |
1, 5 |
176.5 |
|
|
| 20 |
176.3 |
|
|
168.0 |
|
|
174.9 |
|
|
| 21 |
74.3 |
5.04, d (18.0) |
20, 22 |
75.8 |
4.85, dd (18.4, 1.6) |
20 |
73.7 |
4.81, d (18.0) |
|
| |
|
5.30, d (18.0) |
|
|
4.97, dd (18.4, 1.6) |
|
|
4.98, d (18.0) |
|
| 22 |
118.3 |
6.15, s |
17, 20, 21 |
121.5 |
5.96, s |
20 |
117.8 |
5.88, s |
17, 21, 23 |
| 23 |
175.0 |
|
|
174.3 |
|
21 |
174.8 |
|
|
| 16-OCOCH3 |
|
|
|
21.2 |
1.97, s |
|
|
|
|
| |
|
|
|
170.6 |
|
|
|
|
|
| 1′ |
99.5 |
5.39, d (7.8) |
3 |
101.1 |
4.27, d (7.6) |
3 |
100.0 |
4.37, d (7.6) |
3 |
| 2′ |
74.2 |
3.96, d (7.8) |
1′ |
80.5 |
3.19, d (7.6) |
1′, 3′ |
83.7 |
3.02, dd (8.4, 8.0) |
1′, 2′ |
| 3′ |
72.5 |
4.90, s |
1′, 4′ |
83.2 |
3.13, dd (9.6, 3.2) |
4′ |
86.4 |
3.12, dd (8.8, 8.8) |
2′, 4′ |
| 4′ |
83.2 |
3.73, d (9.0) |
5′ |
68.7 |
3.80, d (3.2) |
|
74.8 |
3.18, dd (8.4, 8.0) |
3′, 5′, 6′ |
| 5′ |
69.5 |
4.46, m |
6′ |
70.0 |
3.50, m |
1′, 4′, 6′ |
72.0 |
3.33, m |
|
| 6′ |
18.8 |
1.41, d (5.4) |
|
16.6 |
1.33, d (6.8) |
5′ |
17.8 |
1.29, d (5.6) |
4′, 5′ |
| 2′-OCH3 |
|
|
|
61.1 |
3.59, s |
1′, 2′ |
61.1 |
3.63, s |
2′ |
| 3′-OCH3 |
|
|
|
58.0 |
3.50, s |
3′ |
60.9 |
3.57, s |
3′ |
| 1′′ |
104.9 |
5.52, s |
4′, 2′′, 5′′ |
|
|
|
|
|
|
| 2′′ |
73.0 |
4.66, s |
3′′ |
|
|
|
|
|
|
| 3′′ |
74.4 |
4.29, dd (9.0, 9.0) |
4′′, 5′′ |
|
|
|
|
|
|
| 4′′ |
73.1 |
4.58, d (9.0) |
6′′ |
|
|
|
|
|
|
| 5′′ |
70.8 |
4.63, m |
|
|
|
|
|
|
|
| 6′′ |
18.7 |
1.48, d (6.0) |
3′′ |
|
|
|
|
|
|
 |
| | Fig. 3 Key correlations of compounds 1–3. | |
Compound 2 was obtained as white powder. It was assigned the molecular formula C33H50O10, which was deduced from HR-ESI-MS (m/z 629.3308 [M + Na]+, calcd for 629.3302), thus indicating nine degrees of unsaturation. 1H-NMR data showed resonance characteristics of the α, β-unsaturated-γ-lactone moiety [δH 5.96 (1H, s, H-22), 4.97 (1H, dd, J = 18.4, 1.6 Hz, H-21a) and 4.85 (1H, dd, J = 18.4, 1.6 Hz, H-21b)], two methyl groups [δH 0.92 (3H, s, H-19) and 0.93 (3H, s, H-18)], and one acetyl group [5.47 (1H, td, J = 9.2, 2.4 Hz, H-16), 1.97 (3H, s, OCOCH3-16) and δC 170.6 (OCOCH3-16), 21.2 (OCOCH3-16)]. Besides δH 3.20 (1H, m, H-17) and 4.06 (1H, br s, H-3), the 1H-NMR data indicated that 2 had an oleandrigenin skeleton,29,30 which is scarce in Streblus species. Furthermore, the resonance characteristics at δH 4.27 (1H, d, J = 7.6 Hz, H-1′) and δC 101.1 (C-1′) suggested the presence of a β-configuration of glycosyl in the structure of 2, which was similar to that of glycosyl of 5. Analyses of 1H–1H COSY, HSQC, and HMBC data revealed that the sugar moiety was 6-deoxy-2,3-dimethoxyl-β-D-galactopyranoside.16 HMBC correlation between H-1′ and C-3 was used to establish the position of the sugar unit. The stereo structure was further confirmed by 1D-NMR and 2D-NMR. The combined results showed that compound 2 was 5βH-16β-acetylkamaloside.
Compound 3 was obtained as light yellow powder. It was assigned the molecular formula C31H46O11 with nine degrees of unsaturation, which was deduced from HR-ESI-MS (m/z 617.2944 [M + Na]+, calcd for 617.2938). The aglycone was similar to that of 1 except that in 3, a carboxyl group (δC 176.5) was replaced with an aldehyde group at C-10, and it was determined to have the strophanthidinic acid skeleton by 1D-NMR and 2D-NMR data (Table 2).31 The resonance characteristics at δH 4.37 (1H, d, J = 7.6 Hz, H-1′) and δC 100.0 (C-1′) suggested the presence of a β-configuration of sugar, which was similar to that of the glycosyl of 4. Analyses of 1H–1H COSY, HSQC, and HMBC data revealed that the sugar moiety was 6-deoxy-2,3-dimethoxyl-β-D-gluopyranoside.10 HMBC correlation between H-1′ and C-3 was used to establish the position of the sugar unit. The combined results showed that compound 3 was mansonin-19-carboxylic acid.
2.3 Cytotoxic activities of compounds
The cytotoxic activities of ten compounds, 1–10, and the reference chemotherapeutic drug, cisplatin, against human cell lines (HL60, A549, AZ521, SKBR3, and WI38) were evaluated using MTT assays (Table 3). The phytosterols 9 and 10 showed weak cytotoxicities (IC50 > 77.10 μM) against human cancer cell lines. The cardiac glycosides 1, 2, and 4–8 indicated strong cytotoxic activities (IC50 = 0.01–3.77 μM) against human cancer cell lines compared with cisplatin (IC50 4.20–18.80 μM), but 3 displayed weak cytotoxicity (IC50 = 8.56–68.60 μM). 1, 2, and 4–8 were responsible for the cytotoxicities of the EtOAc and n-BuOH fractions. After comparing the cardiac glycosides having different types of groups at C-10, we found that 5 (IC50 = 0.01–0.16 μM) demonstrated higher activity against human cancer cell lines than 7 (IC50 = 0.06–1.16 μM), 6 (IC50 = 0.01–0.23 μM) showed higher activity than 8 (IC50 = 0.34–3.77 μM), and 4 (IC50 = 0.02–0.15 μM) displayed higher activity than 3 (IC50 = 8.56–68.60 μM). The results indicated that an aldehyde group instead of a methyl group or a carboxyl group linked to C-10 seemed to increase cytotoxicity. Analysis of SARs indicated that the type of C-10 substituent in these cardiac glycosides was a crucial factor in determining the cytotoxic activity.32,33 However, the results showed that the methyl group linked to C-10 seemed to have superior selectivity than the aldehyde group, and the aldehyde group linked to C-10 seemed to have better selectivity than the carboxyl group, which was evidenced from the comparisons between 5 (SI 1.00) and 7 (SI 15.00), 3 (SI 0.66) and 4 (SI 1.50), and 6 (SI 8.00) and 8 (SI 24.26). In addition, OH-5 and OCOCH3-16 were the potential cytotoxic groups compared with these compounds, and the results were supported by the results given in the literature.34,35 Furthermore, observation of two pairs of related compounds 5/6, and 7/8 indicated that cardiac glycosides displayed weaker cytotoxicities with an increase in the number of sugar units. The sugar moiety is another factor while determining cytotoxic activity,34 but the sugar moieties were less active than C-10 groups.
Table 3 Cytotoxicities of isolated compounds 1–10 from S. asper roots
| No. |
Cytotoxicity IC50a (μM) ± SD |
| HL60 |
A549 |
AZ521 |
SKBR3 |
WI38 |
SIb |
| IC50: 50% inhibition concentration, the values based on quintuple points. Each value represents the mean ± SD (n = 3). SI: Selective index. ND: Not determined. |
| 1 |
NDc |
0.03 ± 0.01 |
ND |
0.01 ± 0.01 |
ND |
ND |
| 2 |
0.24 ± 0.03 |
0.03 ± 0.01 |
0.18 ± 0.03 |
0.48 ± 0.08 |
0.18 ± 0.02 |
6.00 |
| 3 |
8.56 ± 0.50 |
11.52 ± 2.60 |
18.37 ± 1.05 |
68.60 ± 7.80 |
7.60 ± 0.40 |
0.66 |
| 4 |
0.09 ± 0.02 |
0.02 ± 0.01 |
0.12 ± 0.03 |
0.15 ± 0.01 |
0.03 ± 0.01 |
1.50 |
| 5 |
0.01 ± 0.02 |
0.01 ± 0.01 |
0.02 ± 0.01 |
0.16 ± 0.03 |
0.01 ± 0.01 |
1.00 |
| 6 |
0.09 ± 0.10 |
0.01 ± 0.10 |
0.04 ± 0.10 |
0.23 ± 0.10 |
0.08 ± 0.01 |
8.00 |
| 7 |
0.40 ± 0.10 |
0.06 ± 0.01 |
0.17 ± 0.03 |
1.16 ± 0.27 |
0.91 ± 0.19 |
15.00 |
| 8 |
1.72 ± 0.16 |
0.34 ± 0.03 |
0.86 ± 0.07 |
3.77 ± 0.64 |
8.25 ± 1.66 |
24.26 |
| 9 |
77.10 ± 0.10 |
>100 |
>100 |
>100 |
ND |
ND |
| 10 |
>100 |
>100 |
>100 |
>100 |
ND |
ND |
| Cisplatin |
4.20 ± 1.10 |
18.40 ± 1.90 |
9.50 ± 0.50 |
18.80 ± 1.07 |
20.00 ± 2.40 |
1.09 |
2.4 Melanogenesis-inhibitory activities of compounds
To identify the active constituents, compounds (3–8) from the EtOAc fraction were investigated for anti-melanogenic effects, with arbutin as positive control. The cytotoxic activities of these compounds against B16F10 cells were also determined by MTT assays. To assess the risk/benefit ratio of each compound, relative activities vs. toxicities were calculated by dividing the melanin content (MC, %), by the cell viability (CV, %), and this was expressed as an activity-to-cytotoxicity ratio (A/C ratio) for each compound.36 As shown in Table 4, the compounds were treated with three concentrations (100 μM, 30 μM, and 10 μM). Cardiac glycosides 3 and 6–8 inhibited melanin production in a dose-dependent manner. 3 proved to be the most potent melanogenesis inhibitor (MC: 26.22%) with weak cytotoxicity (CV: 77.94%) by exhibiting minimum A/C ratio (0.34) at a concentration of 100 μM, and its inhibitory activity was stronger than that of the reference arbutin (MC: 82.5%, CV: 107.60%, and A/C ratio 0.77 at 100 μM). 6–8 in this study proved to be low-risk melanogenesis inhibitors (MC: 61.36–74.90% and CV: 90.54–111.70%) by exhibiting small A/C ratios (0.65–0.80) at a concentration of 100 μM. Conversely, 4 and 5 did not suppress melanin production (MC: 94.65% and 94.47%, respectively) even at a concentration of 100 μM. These results indicated that 3 and 6–8 were responsible for the melanogenesis-inhibitory activities of the EtOAc fraction.
Table 4 Melanogenesis-inhibitory activities of isolated compounds 3–8 in B16F10 cell line
| No. |
Melanogenesis inhibition activitya |
A/C Ratio |
| 100 μM |
30 μM |
10 μM |
100 μM |
30 μM |
10 μM |
| MCb |
CVc |
MC |
CV |
MC |
CV |
| Each value represents the mean ± SD (n = 3). MC: Melanin content (%). CV: Cell viability (%). |
| 3 |
26.22 ± 2.97 |
77.94 ± 3.26 |
89.29 ± 5.32 |
91.14 ± 0.39 |
98.21 ± 2.99 |
96.17 ± 1.74 |
0.34 |
0.98 |
1.02 |
| 4 |
94.65 ± 1.78 |
97.42 ± 0.11 |
94.02 ± 4.07 |
99.90 ± 1.81 |
89.85 ± 2.18 |
99.83 ± 4.32 |
0.97 |
0.94 |
0.90 |
| 5 |
94.47 ± 6.52 |
98.44 ± 9.71 |
103.08 ± 3.60 |
102.40 ± 8.47 |
100.18 ± 6.05 |
108.70 ± 6.53 |
0.96 |
1.01 |
0.92 |
| 6 |
72.63 ± 7.92 |
90.54 ± 5.87 |
98.11 ± 5.48 |
105.25 ± 8.42 |
98.28 ± 5.52 |
102.82 ± 6.02 |
0.80 |
0.93 |
0.96 |
| 7 |
74.90 ± 7.30 |
111.70 ± 6.80 |
81.60 ± 7.90 |
112.30 ± 1.50 |
90.90 ± 4.30 |
100.60 ± 0.70 |
0.67 |
0.73 |
0.90 |
| 8 |
61.36 ± 2.59 |
94.52 ± 8.06 |
83.99 ± 6.88 |
103.08 ± 5.15 |
96.43 ± 7.85 |
101.81 ± 3.47 |
0.65 |
0.81 |
0.95 |
| Arbutin |
82.50 ± 5.80 |
107.60 ± 7.80 |
93.40 ± 6.10 |
107.30 ± 6.80 |
98.90 ± 2.10 |
108.90 ± 0.50 |
0.77 |
0.87 |
0.91 |
2.5 Western blot analysis of melanogenesis-related proteins
Depigmentation can be achieved by regulating the transcriptions and activities of tyrosinase, tyrosinase-related protein-1 (TRP-1) and tyrosinase-related protein-2 (TRP-2).37 Tyrosinase, a rate-limiting enzyme, catalyzes the hydroxylation of L-tyrosine to l-(3,4-dihydroxyphenyl)-alanine (L-DOPA) and the oxidation of L-DOPA to L-DOPA quinone.38 TRP-1 catalyzes the oxidation of 5,6-dihydroxyindole-2-carboxylic acid (DHICA), and TRP-2 functions as DOPAchrome tautomerase.39 Transcription for the expression of these enzymes is regulated by the microphthalmia transcription factor (MITF).38 To clarify the mechanism involved in melanogenesis inhibition by 3, which was the most potent melanogenesis inhibitor at 100 μM (MC: 26.22%, CV: 77.94%, A/C 0.34) in this study, the protein levels of tyrosinase, TRP-1, TRP-2, and MITF were evaluated in B16F10 cells treated with 3 (30 μM and 100 μM) by western blot analysis. As shown in Fig. 4, the protein levels of TRP-2 and tyrosinase decreased in a dose-dependent manner, whereas those of TRP-1 indicated a slight change. However, the protein levels of MITF treated with 3 at 30 μM were higher compared with those of the control group (the second line), but they were much lower at 100 μM. These results indicated that 3 possessed almost no melanogenesis-inhibitory activity at 30 μM (MC: 89.29%). Although the protein levels of MITF and TRP-1 were higher than those of the control group, tyrosinase, which is a rate-limiting enzyme, showed lower level compared with the control group, and this was in accordance with the changes in the melanin contents at 30 μM and 10 μM. It was inferred that 3 exhibited melanogenesis inhibitory activity on α-MSH-stimulated B16F10 cells by decreasing the expressions of TRP-2 and tyrosinase.
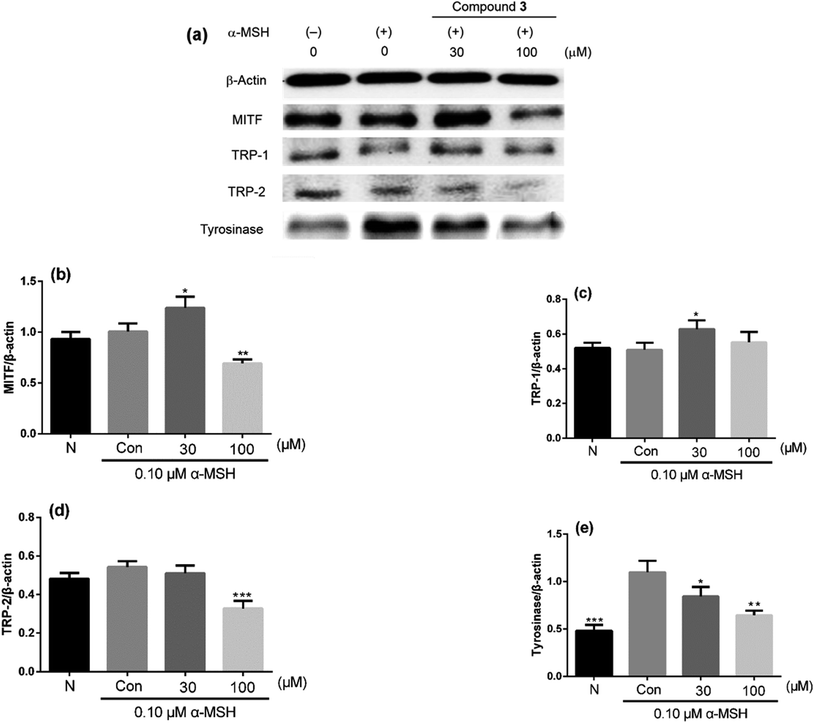 |
| | Fig. 4 (a) Effects on the expressions of MITF, TRP-1, TRP-2 and tyrosinase in α-MSH-stimulated B16F10 cells treated with compound 3 (30 μM and 100 μM). (b–e) MITF, TRP-1, TRP-2 and tyrosinase were quantified. N: negative control. Con: control. *P < 0.05, **P < 0.01, ***P < 0.001 compared with 0.1 μM α-MSH model group in three separate experiments. | |
3. Conclusion
In this study, three new cardiac glycosides strophanthidin-3-O-α-L-rhamnopyranosyl-(1→4)-6-deoxy-β-D-allopyranoside (1), 5βH-16β-acetylkamaloside (2), and mansonin-19-carboxylic acid (3) along with seven known steroids were isolated from the methanol extracts of S. asper roots. The cardiac glycosides 2, 4, and 6–8 indicated potent cytotoxicities and high SI values, and they displayed superior selectivities when compared with the reference cisplatin. SARs were also discussed regarding the type of C-10 groups in the cardiac glycosides and the sugar moieties' effects on cytotoxicity. In addition, the cardiac glycosides 3 and 6–8 displayed moderate inhibition of melanogenesis compared with the reference arbutin. The western blot analysis of melanogenesis-related proteins suggested that 3 could inhibit melanogenesis by suppressing the protein expressions of TRP-2 and tyrosinase. The current study contributes to the understanding of SARs of cytotoxicity and mechanisms of the melanogenesis-inhibitory activities of cardiac glycosides, which will hopefully help develop new potential antitumor and melanogenesis-inhibitory agents.
4. Experimental
4.1 General experimental procedures
IR spectra were acquired on a Bruker Tensor 27 spectrometer in KBr discs. Semipreparative HPLC was operated with an SSC-3461 pump (Senshu Scientific Co., Ltd), an Shimadzu Shodex RI-101 detector (Showa Denko K.K.), an SS-100F Recorder using a Capcell pak AQ column (250 × 10 mm, 5 μm, Shiseido) and a Pegasil SP 100 column (250 × 10 mm, 5 μm, Senshu Scientific Co., Ltd). Semipreparative HPLC was conducted on an SSC-6600 Gradient Controller (Senshu Scientific Co., Ltd) equipped with an SSC-3461 pump (Senshu Scientific Co., Ltd) and a Shodex Model 55 ELSD detector (Sedere, Franc.) with a Capcell pak C18 column (250 × 4.6 mm, 5 μM, Shiseido). HR-ESI-MS spectra were obtained using a Bruker Micro TOF model mass spectrometer. 1D and 2D NMR experiments were carried out on JNM-AL400 and JNM-ECX400 spectrometers (JEOL, Ltd) using tetramethylsilane (TMS) as internal standard. Column chromatography separations were performed on silica gel (100–200 mesh and 200–300 mesh, Merck & Co., Inc.) and ODS gel (50 μm, Fuji Silysia Chemical, Ltd.). TLC was carried out on silica gel GF254 (Millipore, Ltd.). Spots were visualized under UV light (254 and 365 nm) and sprayed with Keddle reagent and vanillin/H2SO4 (1![[thin space (1/6-em)]](https://www.rsc.org/images/entities/char_2009.gif) :100, w/v) (the former reagent showed red spots and the latter reagent showed green spots); this was followed by heating if the compounds were cardiac glycosides. CH3OH used in the preparative HPLC procedure was of HPLC grade, and the other solvents were of analytical grade (Kanto Chemical Co., Inc.).
:100, w/v) (the former reagent showed red spots and the latter reagent showed green spots); this was followed by heating if the compounds were cardiac glycosides. CH3OH used in the preparative HPLC procedure was of HPLC grade, and the other solvents were of analytical grade (Kanto Chemical Co., Inc.).
4.2 Plant materials
The roots of S. asper were collected from Chiang Mai, Thailand in October of 2015. The roots were identified by Prof. Dr Jiradej Manosroi (Manose Health and Beauty Research Center, Chiang Mai, Thailand). A voucher specimen (No. 20150060) was deposited in the Department of Natural Medicinal Chemistry, China Pharmaceutical University, Nanjing, China.
4.3 Extraction and isolation
The roots (2.1 kg) of S. asper were defatted with n-hexane, and the residue was extracted with MeOH by heat refluxing. The MeOH extract (140.7 g) was suspended in H2O, and it was successively partitioned into EtOAc (22.7 g), n-BuOH (32.0 g) and H2O (55.1 g) fractions. The n-BuOH part (18.0 g) was subjected to column chromatography (CC) on Diaion HP-20 (900 g), and it was eluted with H2O:MeOH (100:0 → 0:100, each 0.2 L) to give 6 fractions (B1 to B6); then, compound 6 (178.8 mg) was obtained by recrystallization. B5 (2728.4 mg) was applied to silica gel using gradient elution of CHCl3:MeOH (90:10 to 87:13, v/v) to obtain 4 fractions (B5-1 to B5-4). Then, B5-1 (119.8 mg) was subjected to preparative HPLC [mobile phase of MeOH:H2O (60:40, v/v) at a flow rate of 2.0 mL min−1 with RI detection] to yield 8 (3.2 mg) on a C18 column (Pegasil ODS SP100, tR = 65.6 min). B5-2 (253.4 mg) was subjected to ODS CC, and it was eluted with H2O:MeOH (50:50, v/v) to yield three fractions (B5-2-1 to B5-2-3). B5-2-1 (107.1 mg) was subjected to silica gel CC, and it was eluted with CHCl3:MeOH (15:1, v/v) to yield B5-2-1-1 to B5-2-1-4. B5-2-1-4 (62.5 mg) was subjected to preparative HPLC to obtain B5-2-1-4-1 (21.9 mg, tR = 31.5–34.5 min, mobile phase of MeOH:H2O (50:50, v/v) at a flow rate of 2.0 mL min−1 with UV detection, λ = 220 nm). Then, B5-2-1-4-1 was subjected to silica gel CC, and it was eluted with CHCl3:MeOH (80:10, v/v) to yield compound 1 (9.8 mg). The EtOAc part (22.0 g) was subjected to column chromatography on silica gel (700 g), and it was eluted with n-hexane: EtOAc (100:0 to 0:100, v/v) and EtOAc:MeOH (100:0 to 0:100, v/v, each 0.5 L) to give 6 fractions (E1 to E6, monitored by TLC). E2 (364.7 mg) yielded compound 9 (0.9 mg) by recrystallization. E4 (1290.5 mg) was applied to silica gel using gradient elution of n-hexane:acetone (80:20 to 60:40, v/v) to yield 5 fractions (E4-1 to E4-5). E4-1 (605.4 mg) was purified by ODS CC using a gradient elution of MeOH:H2O (30:70 to 50:50, v/v) to yield 3 fractions (E4-1-1 to E4-1-3). E4-1-1 (167.4 mg) was subjected to silica gel CC, and it was eluted with n-hexane:acetone (90:10 to 30:70, v/v) to yield 3 fractions (E4-1-1-1 to E4-1-1-3). E4-1-1-2 (32.4 mg) was subjected to preparative RP-HPLC [mobile phase MeOH:H2O (60:40, v/v) at a flow rate of 2.0 mL min−1 with RI detection] to yield compound 3 (5.1 mg) on C18 column (Pegasil ODS SP100, tR = 28.0 min). Similarly, E4-2-2 (269.2 mg) was subjected to preparative HPLC to yield compounds 5 (13.5 mg, tR = 28.0 min), 4 (4.8 mg, tR = 33.6 min), and 7 (4.7 mg, tR = 64.0 min). E3 (54.7 mg) was applied to silica gel using a gradient elution of CHCl3:acetone (100:0 to 10:90, v/v) to yield 4 fractions (E3-1 to E3-4), and E3-3 (15.4 mg) was subjected to preparative HPLC [mobile phase of MeOH:H2O (50:50, v/v) at a flow rate of 2.5 mL min−1 with RI detection] to yield 2 (3.6 mg) on a C18 column (Pegasil ODS SP100). E5 (83.7 mg) was separated by silica gel column chromatography (CC) using a gradient elution of CHCl3:acetone (60:40 to 30:70, v/v) to yield 8 fractions (E5-1 to E5-8), and E-5-5 (4.8 mg) yielded compound 10 (3.0 mg) by recrystallization.
4.3.1 Strophanthidin-3-O-α-L-rhamnopyranosyl-(1→4)-6-deoxy-β-D-allopyranoside (1). A white powder, UV (MeOH) λmax nm (logε): 206 (3.16), IR (KBr) νmax: 3443, 2931, 1738, 1075, 1033 cm−1, HR-ESI-MS m/z: 719.3233 [M + Na]+, calcd for 719.3255. 1H-NMR (600 MHz, pyridine-d5) and 13C-NMR (150 MHz, pyridine-d5) (for data, please see Table 2).
4.3.2 5βH-16β-acetylkamaloside (2). A white powder, UV (MeOH) λmax nm (logε): 216 (3.79), IR (KBr) νmax: 3436, 1636 cm−1, HR-ESI-MS m/z: 629.3308 [M + Na]+, calcd for 629.3302. 1H-NMR (400 MHz, chloroform-d) and 13C-NMR (100 MHz, chloroform-d) (for data, please see Table 2).
4.3.3 Mansonin-19-carboxylic acid (3). A light yellow powder, UV (MeOH) λmax nm (logε): 217 (3.68), IR (KBr) νmax: 3464, 2927, 2855, 1739, 1071 cm−1, HR-ESI-MS m/z: 617.2944 [M + Na]+, calcd for 617.2938. 1H-NMR (400 MHz, chloroform-d) and 13C-NMR (100 MHz, chloroform-d) (for data, please see Table 2).
4.3.4 Acid hydrolysis of 1. Compound 1 (2.0 mg) was heated at reflux with 2.0 mL of 2 N HCl for 2 h at 80–90 °C. The reaction mixtures were extracted with EtOAc (3 × 2.0 mL). The H2O layer was concentrated to dryness after repeatedly adding MeOH to remove acid. The residue was then dissolved in pyridine (1.0 mL) and stirred with L-cysteine methyl ester at 60 °C for 1.0 h. Sugar (D/L) standards were also derivatized using L-cysteine methyl ester in the same manner. Then, trimethylsilyl (TMS) was added to the reaction mixtures, and the mixtures were heated for 1 h at 60 °C. The reaction mixtures were analyzed using GC (column: Agilent J&W DB-17, 30 m × 0.32 mm, column temp: 200 °C, injector temp: 270 °C, detector temp: 270 °C, detector: FID, He flow rate: 0.5 mL min−1, α-L-Rha: tR = 13.240 min, 6-deoxy-β-D-allose: tR = 12.240 min).
4.4 Cytotoxicity assays
4.4.1 Cell culture. Cell lines HL60 (human acute promyelocytic leukemia cells), A549 (human lung carcinoma cells), AZ521 (human duodenal cancer cells), SKBR3 (human adenocarcinoma cells), and WI38 (human normal fetal cells) were obtained from Riken Cell Bank (Japan), and B16F10 cells (mouse melanoma cells) were obtained from the cell bank of the Chinese Academy of Sciences. The human cancer cell lines A549, AZ521, SKBR3, and B16F10 were maintained in adhesion on Petri dishes with Dulbecco's Modified Eagle's Medium (DMEM, Sigma-Aldrich, Japan) supplemented with 10% heat-inactivated fetal bovine serum (FBS, GIBCO), penicillin–streptomycin (100 U mL−1, GIBCO). HL60 was suspended in RPMI medium 1640 with 10% FBS, penicillin–streptomycin (100 U mL−1), and WI38 was maintained in adhesion on Petri dishes with Minimum Essential Medium (MEM, Sigma-Aldrich, Japan) with 10% FBS, penicillin–streptomycin (100 U mL−1). Cells were grown at 37 °C in an atmosphere of 5% CO2, 95% air and >95% humidity, and those that passaged three or more times were used for each test. HL60, a floating cell, was recovered with the medium from the dish, and other adherent cells were washed with phosphate buffer saline (PBS) and recovered by the action of 0.05% trypsin–EDTA (GIBCO). The collected cells were centrifuged at 800 rpm at 4 °C for 5 min. After separating and removing the supernatant liquid, an appropriate amount of medium was added and pipetted to prepare a cell suspension. The cell suspension (10 μL) was taken, the number of cells in the corning chamber were counted, and an appropriate amount of the medium was added in each experiment to obtain the appropriate cell density.
4.4.2 MTT assays. All kinds of adherent cell lines were seeded at 3 × 10³ cells per well in a 96-well plate and cultured for 24 h. The floating cell line was seeded at 8 × 10³ cells per well in a 96-well plate. Samples were then added at an appropriate final concentration and allowed to act for 48 h. Followed by the addition of 0.5% 3-(4,5-dimethylthiazol-2-yl)-2,5-diphenyl tetrazolium bromide solution (MTT, Sigma-Aldrich, Japan) and further culturing for 3 h, 100 μL per well of solution (0.04 M HCl/2-PrOH, Wako Pure Chemical Industries) was added, and the cell injury rate was calculated from absorbance at 570–630 nm. The calculation formula of inhibitory rate is as follows: I% = [(Abscontrol − Abssample)/(Abscontrol − Absblank)] × 100%. The 50% inhibition concentration (IC50) was analyzed by GraphPad Prism 5. The SI of compounds were measured by the ratio of cytotoxic effect on the normal cell line (WI38) to the cytotoxic effect on the cancer cell line (A549). An anticancer agent (cisplatin) was used as the reference compound.
4.4.3 Measurement of melanin content. The melanin content of B16F10 cells was determined according to the method in the previous literature with slight modifications.40 The B16F10 cells were cultured at a density of 5 × 10⁴ cells per well in 24-well plates for 24 h. Then, 0.10 μM α-MSH (Sigma-Aldrich, Japan) and the tested compounds were added at varying concentrations, and the cells were incubated for additional 48 h. The cells were washed three times with PBS and centrifuged at 95000 g for 5 min. The harvested cells were dissolved in 100 μL of 2 N NaOH (Wako Pure Chemical Industries) and 10% dimethyl sulfoxide (DMSO, Sigma-Aldrich, Japan) solution, maintained at 80 °C for 0.5 h, and mixed to solubilize the melanin. The absorbance value of the supernatant was measured at 405 nm using a microplate reader. The calculation formula of the melanin content is as follows: MC% = [(Abssample − Absblank)/(Abscontrol − Absblank)] × 100%. The calculation formula of activity-to-cytotoxicity ratio is as follows: A/C = (MC%)/(CV%). The statistical significance of the differences between control and treatment groups was analyzed using the program GraphPad Prism 5. The melanogenesis-inhibitory agent arbutin was used as the reference compound.
4.4.4 Western blot analysis. The B16F10 cells were incubated with various concentrations of 3 (30 μM and 100 μM), and they were subsequently treated with 0.10 μM α-MSH for 48 h. After incubation, the cells were harvested and washed twice with ice-cold PBS. The cells were lysed in lysis buffer (2% sodium dodecyl sulfate, 50 mM Tris–HCl, pH 7.2, 10% glycerol, 2% 2-sulfanylethanol). The cell lysates were centrifuged at 18650 g at 4 °C for 10 min, and the supernatant concentration was determined using the Enhanced BCA Protein Assay Kit (Beyotime, Nanjing, P. R. China). Aliquots of the lysates (30 μg protein) were separated by electrophoresis on 10% sodium dodecyl sulfate-polyacrylamide gel and transferred to a polyvinylidene fluoride membrane in glycine transfer buffer [25 mM Tris–HCl, 192 mM glycine, and 20% MeOH (v/v)]. The nonspecific sites were blocked with 5% non-fat skim milk in Tris-buffered saline (TBS)-Tween 20 solution. The membrane was incubated with primary antibodies against MITF, tyrosinase, TRP-1, TRP-2, and β-actin, and it was then incubated with a secondary antibody (1:5000; Biogot Biotechnology Co., Ltd., Nanjing, P. R. China) at room temperature. The protein bands were detected using the WESTZOL plus Western Blot Detection System (Tanon Science & Technology Co., Ltd., Shanghai, P. R. China).
Conflicts of interest
The authors declare no conflict of interest.
Acknowledgements
This study was supported by the Youth Science Fund Project of the National Natural Science Foundation of China (Grant No. 81703383), the Natural Science Foundation of Jiangsu Province (Grant No. BK20170742), the General Program of National Natural Science Foundation of China (Grant No. 81673567), and National Found for Fostering Talents of Basic Science (Grant No. J1310032).
References
- S. Rastogil, D. K. Kulshreshtha and A. K. S. Rawat, J. Evidence-Based Complementary Altern. Med., 2006, 3, 217–222 CrossRef PubMed.
- Editorial committee of Chinese Academy of Sciences of Flora of China, Flora of China, Science Press, Beijing, 1998, vol. 23, p. 32 Search PubMed.
- R. K. Chatterjee, N. Fatma, P. K. Murthy, P. Sinha, D. K. Kulshrestha and B. N. Dhawan, Drug Dev. Res., 1992, 26, 67–78 CrossRef.
- M. S. Hashim and K. S. Devi, Fitoterapia, 2003, 74, 670–676 CrossRef PubMed.
- S. Wongkham, P. Laupattarakasaem, K. Pienthaweechai, P. Areejitranusorn, C. Wongkham and T. Techanitiswad, Phytother. Res., 2001, 15, 119–121 CrossRef PubMed.
- M. K. Das and M. K. Beuria, Trans. R. Soc. Trop. Med. Hyg., 1991, 85, 40–41 CrossRef PubMed.
- H. Chen, J. Li, Q. Wu, X. T. Niu, M. T. Tang, R. Y. Yang, S. P. Deng and X. J. Su, Fitoterapia, 2012, 83, 643–649 CrossRef PubMed.
- J. Li, A. P. Meng, X. L. Guan, J. Li, Q. Wu, S. P. Deng, X. J. Su and R. Y. Yang, Bioorg. Med. Chem. Lett., 2013, 23, 2238–2244 CrossRef PubMed.
- S. K. Karan, A. Mondal, S. K. Mishra, D. Pal and K. K. Rout, Pharm. Biol., 2013, 51, 369–375 CrossRef PubMed.
- M. Fiebig, C. Y. Duh, J. M. Pezzuto, A. D. Kinghorn and N. R. Farnsworth, J. Nat. Prod., 1985, 48, 981–985 CrossRef.
- Y. L. Ren, W. L. Chen, D. D. Lantvit, E. J. Sass, P. Shriwas, T. N. Ninh, H. B. Chai, X. L. Zhang, D. D. Soejarto, X. Z. Chen, D. M. Lucas, S. M. Swanson, J. E. Burdette and A. D. Kinghorn, J. Nat. Prod., 2017, 80, 648–658 CrossRef PubMed.
- W. L. Chen, Y. L. Ren, J. H. Ren, C. Erxleben, M. E. Johnson, S. Gentile, A. D. Kinghorn, S. M. Swanson and J. E. Burdette, J. Nat. Prod., 2017, 80, 659–669 CrossRef PubMed.
- Y. J. Zhang, J. Li, B. F. Jin, X. S. Huang, Y. Y. Lu and P. Li, Journal of Guangxi Normal University: Natural Science Edition, 2006, 24, 61–63 Search PubMed.
- W. Phutdhawong, A. Donchai, J. Korth, S. G. Pyne, P. Picha, J. Ngamkham and D. Buddhasukh, Flavour Fragrance J., 2004, 19, 445–447 CrossRef.
- J. G. Huang, J. Li, Q. Wu, R. Y. Yang, S. Li, Z. Z. Chen and L. Q. Li, Nat. Prod. Res. Dev., 2012, 24, 780–783 Search PubMed.
- J. Li, Y. J. Zhang, B. F. Jin, X. J. Su, Y. W. Tao, Z. G. She and Y. C. Lin, Magn. Reson. Chem., 2008, 46, 497–500 CrossRef PubMed.
- L. Q. Li, J. Li, H. Yan, Q. Wu, S. P. Deng, X. J. Su, R. Y. Yang, J. G. Huang, Z. Z. Chen and S. Li, Fitoterapia, 2012, 83, 303–309 CrossRef PubMed.
- M. P. Khare, S. S. Bhatnagar, O. Schindler and T. Reichstein, Helv. Chim. Acta, 1962, 45, 1515–1534 CrossRef.
- M. P. Khare, O. Schindler and T. Reichstein, Helv. Chim. Acta, 1962, 45, 1534–1546 CrossRef.
- A. R. Manzetti and T. Reichstein, Helv. Chim. Acta, 1964, 47, 2303–2320 CrossRef.
- A. R. Manzetti and T. Reichstein, Helv. Chim. Acta, 1964, 47, 2320–2330 CrossRef.
- L. S. Zhang, T. Yoshida and Y. Kuroiwa, Life Sci., 1992, 51, 17–24 CrossRef PubMed.
- D. M. Tian, H. Y. Cheng, M. M. Jiang, W. Z. Shen, J. S. Tang and X. S. Yao, J. Nat. Prod., 2016, 79, 38–50 CrossRef PubMed.
- V. K. Saxena 1 and S. K. Chaturvedi, Planta Med., 1985, 51, 343–344 CrossRef PubMed.
- H. Kojima, N. Sato, A. Hatano and H. Ogura, Phytochemistry, 1990, 29, 2351–2355 CrossRef.
- S. Kubo, M. Kuroda, Y. Matsuo, D. Masatani, H. Sakagami and Y. Mimakia, Chem. Pharm. Bull., 2012, 60, 1275–1282 CrossRef PubMed.
- X. S. Li, M. J. Hu, J. Liu, Q. Liu, Z. X. Huang, S. L. Li, X. J. Hao, X. K. Zhang, X. S. Yao and J. S. Tang, Fitoterapia, 2014, 97, 71–77 CrossRef PubMed.
- Z. H. Lei, Z. X. Jin, Y. L. Ma, B. S. Tai, Q. Kong, S. Yahara and T. Nohara, Phytochemistry, 1998, 49, 1801–1803 CrossRef PubMed.
- G. M. Cabrera, M. E. Deluca, A. M. Seldes, E. G. Gros, J. C. Oberti, J. Crockett and M. L. Gross, Phytochemistry, 1993, 32, 1253–1259 CrossRef.
- Y. Rifai, M. A. Arai, T. Koyano, T. Kowithayakorn and M. Ishibashi, J. Nat. Med., 2011, 65, 629–632 CrossRef PubMed.
- H. S. Chang, M. Y. Chiang, H. Y. Hsu, C. W. Yang, C. H. Lin, S. J. Lee and I. S. Chen, Phytochemistry, 2013, 87, 86–95 CrossRef PubMed.
- W. H. Dong, W. L. Mei, Y. X. Zhao, Y. B. Zeng, W. J. Zuo, H. Wang, X. N. Li and H. F. Dai, Planta Med., 2011, 77, 1730–1734 CrossRef PubMed.
- R. Xue, N. Han, C. Ye, L. H. Wang, J. Y. Yang, Y. Wang and J. Yin, Fitoterapia, 2014, 98, 228–233 CrossRef PubMed.
- S. Kruakaew, C. Seeka, T. Lhinhatrakool, S. Thongnest, J. Yahuafai, S. Piyaviriyakul, P. Siripong and S. Sutthivaiyakit, J. Nat. Prod., 2017, 80, 2987–2996 CrossRef PubMed.
- W. Kitdamrongtham, K. Ishii, K. Ebina, J. Zhang, M. Ukiya, K. Koike, H. Akazawa, A. Manosroi, J. Manosroi and T. Akihisa, Chem. Biodiversity, 2014, 11, 73–84 Search PubMed.
- G. E. Costin and V. J. Hearing, FASEB J., 2007, 21, 976–994 CrossRef PubMed.
- S. Briganti, E. Camera and M. Picardo, Pigm. Cell Res., 2003, 16, 101–110 CrossRef.
- T. Kobayashi, K. Urabe, A. Winder, C. Jiménez-Cervantes, G. Imokawa, T. Brewington, F. Solano, J. C. García-Borrón and V. J. Hearing, EMBO J., 1994, 13, 5818–5825 Search PubMed.
- C. Levy, M. Khaled and D. E. Fisher, Trends Mol. Med., 2006, 12, 406–414 CrossRef PubMed.
- M. J. Kim, D. S. Kim, H. S. Yoon, W. J. Lee, N. H. Lee and C. G. Hyun, Interdiscip. Toxicol., 2014, 7, 89–92 Search PubMed.
Footnote |
| † Electronic supplementary information (ESI) available. See DOI: 10.1039/c8ra00733k |
|
| This journal is © The Royal Society of Chemistry 2018 |
Click here to see how this site uses Cookies. View our privacy policy here. 
 Open Access Article
 This Open Access Article is licensed under a Creative Commons Attribution-Non Commercial 3.0 Unported Licence
 f,
Feng Feng*abc and
Jie Zhang
f,
Feng Feng*abc and
Jie Zhang