
 Open Access Article
 This Open Access Article is licensed under a Creative Commons Attribution-Non Commercial 3.0 Unported Licence
Composition-induced phase evolution and high strain response in Ba(Zn1/3Nb2/3)O3-modified (Bi0.5Na0.5)TiO3-based lead-free ferroelectrics
Qiumei Weia,
Mankang Zhu *a,
Tianhe Qina,
Zhihua Guoa,
Mupeng Zhenga,
Yudong Houa,
Hui Liub and
Jun Chenb
*a,
Tianhe Qina,
Zhihua Guoa,
Mupeng Zhenga,
Yudong Houa,
Hui Liub and
Jun Chenb
aCollege of Materials Science and Engineering, Beijing University of Technology, Beijing 100124, China. E-mail: zhumk@bjut.edu.cn; Tel: +86 10 67392733
bSchool of Metallurgical and Ecological Engineering, University of Science and Technology Beijing, Beijing 10083, China
First published on 29th March 2018
Abstract
In this work, a paraelectric complex perovskite Ba(Zn1/3Nb2/3)O3 (BZN) was introduced into the morphotropic boundary composition (Bi0.5Na0.5)0.93Ba0.07TiO3 (BNBT) to modulate the phase structure and electrical properties as well as the field-induced strain behavior. Using a columbite route, the ceramics with pure perovskite structure were successfully fabricated. The structure and electrical measurements showed that the introduction of BZN into BNBT results in the decrease of the rhombohedrality 90-γ, and promotes the evolution from ferroelectric to antiferroelectric (AFE) relaxor. Besides, the introduction of BZN induces the volume increase and dimension reduction of the nanosized AFE relaxor domains. A large field-induced strain of 0.39% with good stability against frequency, field, and temperature was obtained at the BNZ addition of composition x = 0.01, which locates at the critical composition boundary between ferroelectric state and AFE relaxor state.
I. Introduction
Lead-based piezoelectric materials cause serious environmental concerns due to the toxicity of lead, even though they have been widely used in several industries.1 Tremendous effort has been devoted to developing competitive lead-free piezoelectric ceramics.2 Among all the lead-free materials developed, Bi0.5Na0.5TiO3 (BNT) is considered to be one of the most promising candidates due to its high electric field-induced strain level.3,4 Further, to enhance the field-induced strain behavior of BNT-based materials is not only scientifically interesting but also technologically important for practical application. Especially, the BNT-based compositions located in morphotropic phase boundary (MPB) attract extensive interest of researchers due to their relatively large strains originating from the nanotwins as an intermediate bridging phase between tetragonal P4mm and rhombohedral R3c phases.5,6 By incorporating strong ferroelectric compounds as modifier, the ferroelectric order of the BNT-based MPB compositions could be disrupted,7–9 such as K0.5Na0.5NbO3,10 LiNbO3,11 thus obtaining a large and hysteresis-free strain.Ba(Zn1/3Nb2/3)O3 (BZN) is paraelectric perovskite a with cubic structure.12 BZN could form a stable solid solution with BNT due to its adequate tolerance factor close to 1 (1.0285). Moreover, the polarization of a ferroelectric may be enhanced by weak ferroelectric species,13 which is beneficial to obtain a large field-induced strain. Besides, the complex B-site cations could effectively induce the local inhomogeneity that destroy the ferroelectric order and induce the polar nanoregions (PNRs). So far, the incorporation of BZN into BNT-based solid solutions could disrupt the stability of ferroelectric domains and make the AFE relaxor percolating into low temperatures, which will construct the another base of a large field-induced strain.
In this work, (1-x)(Bi0.5Na0.5)0.93Ba0.07TiO3-xBa(Zn1/3Nb2/3)O3 ceramics was designed and fabricated by a columbite route suggested by Swartz and Shrout.14 Crystal structure, dielectric and ferroelectric response as well as field-induced strain behavior were investigated in details. The experiments demonstrated that a large strain of 0.39% was obtained at composition x = 0.01, which provides the potential in application of environmental friendly solid-state actuators.
II. Experimentals
Samples based on (1-x)(Bi0.5Na0.5)0.93Ba0.07TiO3 (BNBT)-xBa(Zn1/3Nb2/3)O3 (BZN) for 0 ≤ x ≤ 0.02 were fabricated through the columbite route using Bi2O3 (purity ≥ 99.0%), Ba2CO3 (purity ≥ 99.0%), Na2CO3 (purity ≥ 99.8%), TiO2 (purity ≥ 99.0%), ZnO (purity ≥ 99.0%), and Nb2O5 (purity ≥ 99.0%) as raw materials. First, the columbite ZnNb2O6 was prepared by the solid synthesis method: the predetermined amounts of ZnO and Nb2O5 were mixed in ethanol (purity ≥ 99.7%) for 12 h using ZrO2 balls, and then calcined at 1000 °C for 4 h to obtain ZnNb2O6. Then, the precursor ZnNb2O6 was mixed with predetermined amounts of Bi2O3, Ba2CO3, TiO2, and Na2CO3, and calcined at 850 °C for 4 h. The calcined BNBZN100x powders were subsequently ball-milled in ethanol again for 12 h, and pressed into pellets of 11.5 mm diameter under 300 MPa using polyvinyl butyral as binder. After removing the binder at 560 °C for 12 h, the green pellets were sintered at 1150 °C for 4 h in a covered alumina crucible. The ceramic samples were ground and polished to diameter of 9.5 mm and thickness of 0.8 mm.The phase structure was identified by powder X-ray diffraction (XRD, Bruker D8 Advance, Karlsruhe, Germany) in the θ–2θ configuration at room temperature, using Cu Kα (1.54178 Å) radiation (scan range = 20.00–80.00°, scan speed = 2.00° min−1, sampling pitch = 0.02°). Before the XRD measurement, the samples were poled under 5 kV mm−1 in silicone oil bath at 65 °C for 30 min and field-cooled to room temperature, and then crushed to powder. To determine the cell parameters, the cell refinement was performed on the XRD data using JADE 6.5 software (Materials Data, Livermore, CA). To observe the atomic arrangement and local symmetry, a high-resolution transmission electron microscope (HR TEM, JOEL JEM ARM300F) were used. Besides, the micromorphology was observed on the thermally etched fracture surface using a scanning electron microscopy (SEM, Hitachi S4800, Tokyo, Japan). To measure the electric properties, the silver paste was coated on both surfaces of the ceramic samples and fired at 700 °C for 20 min to form electrodes. The dielectric permittivity of poled or unpoled samples was measured with a LCR meter (E4980, Agilent, Santa Clara, CA) equipped with an automated temperature controller at heating ramp rates of 3 °C min−1. Ferroelectric polarization (P)–field (E) loops and field-induced strain were measured in silicone oil using a ferroelectric tester (Premier II, Radiant Technologies, Albuquerque, NM) equipped with a photonic sensor (2000, MTI, Albany, NY) at 1 Hz. Electrical impedance spectrum was measured by an impedance analyzer (Concept 400, Novocontrol Technologies, Montabaur, Germany). The local structure was characterized by a Raman scattering spectrometer (HR800, Horiba Jobin-Yvon, France) using the 532.08 nm Ar-ion laser as the excitation source.
III. Results and discussion
Fig. 1 shows the SEM images of compositions x = 0–0.02. The grains show a polyhedral morphology, and no apparent pores were observed in grain internals or boundaries, which indicate the good sintering ability of the samples. Moreover, the average grain size varies in 0.92–0.99 μm estimated by a freeware SmileView, which is almost independent from BZN content, implying that BZN addition exact a weak impact on the grain growth.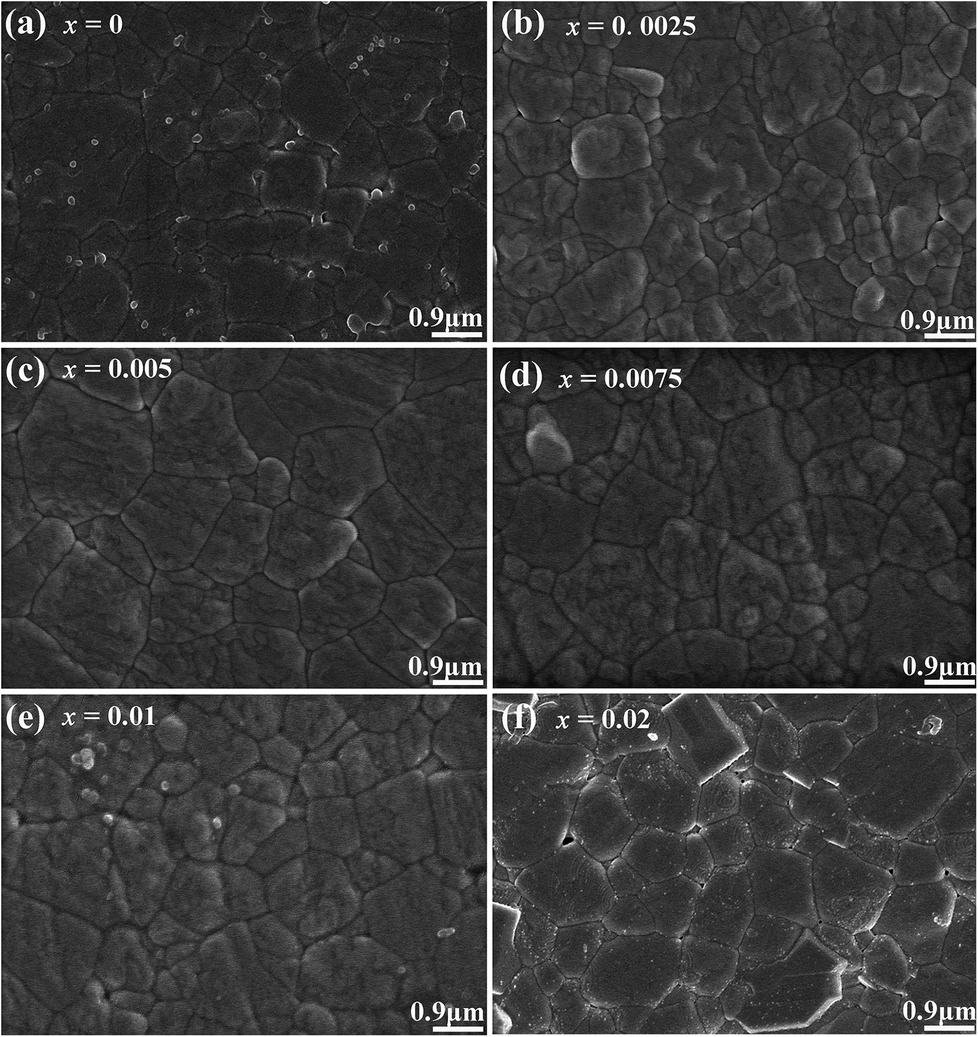 | ||
| Fig. 1 SEM images of compositions x = 0–0.02. | ||
Fig. 2 shows the powder XRD patterns of the unpoled and poled BNBZN100x ceramics. As seen from Fig. 2a, all the unpoled samples present a pseudocubic perovskite structure, and no apparent second phase is observed, which implies that BZN completely diffuse into the lattice of BNBT and form a stable solid solution. To give an insight into the phase evolution induce by BZN addition, the fine scanning XRD patterns of sample before and after poling were recorded in the 2θ range of 39–41° and 67–68.5°, as shown in Fig. 2b and c. For the poled compositions x ≤ 0.01, the (111)PC diffraction around 40° splits, and a shoulder assigned to the (002) diffraction of rhombohedral R3c occurs, verifying their structural nature of rhombohedral R3c symmetry. Meanwhile, the (220)PC diffraction around 68° also splits after poling, further indicating the asymmetric structure. However, when x > 0.01, the (111)PC and (220)PC diffractions keep unchanged after the poling, which means that the compositions x > 0.01 possesses the pseudocubic structure, and should be related to the percolation of AFE relaxor phase with P4bm structure.15 Moreover, to elucidate the effect of BZN incorporation on the crystal lattice, Fig. 2d depicts the lattice constant apc and rhombohedrality 90-γ fixed by a freeware JADE 6.5 based on the XRD data. As seen from Fig. 2d, the incorporation of BZN into BNBT brings in the lattice expansion, which could be assorted to the larger effective ionic radii of Zn2+ (0.74 Å) and Nb5+ (0.69 Å) than that of Ti4+ (0.605 Å). Especially, as BZN added, the 90-γ value decreases gradually to zero when x arrives to 0.075, affirming the composition induced phase evolution from rhombohedral ferroelectric (R3c) and pseudocubic AFE relaxor (P4bm), which may be the result of the disruption of the long-range ferroelectric order.
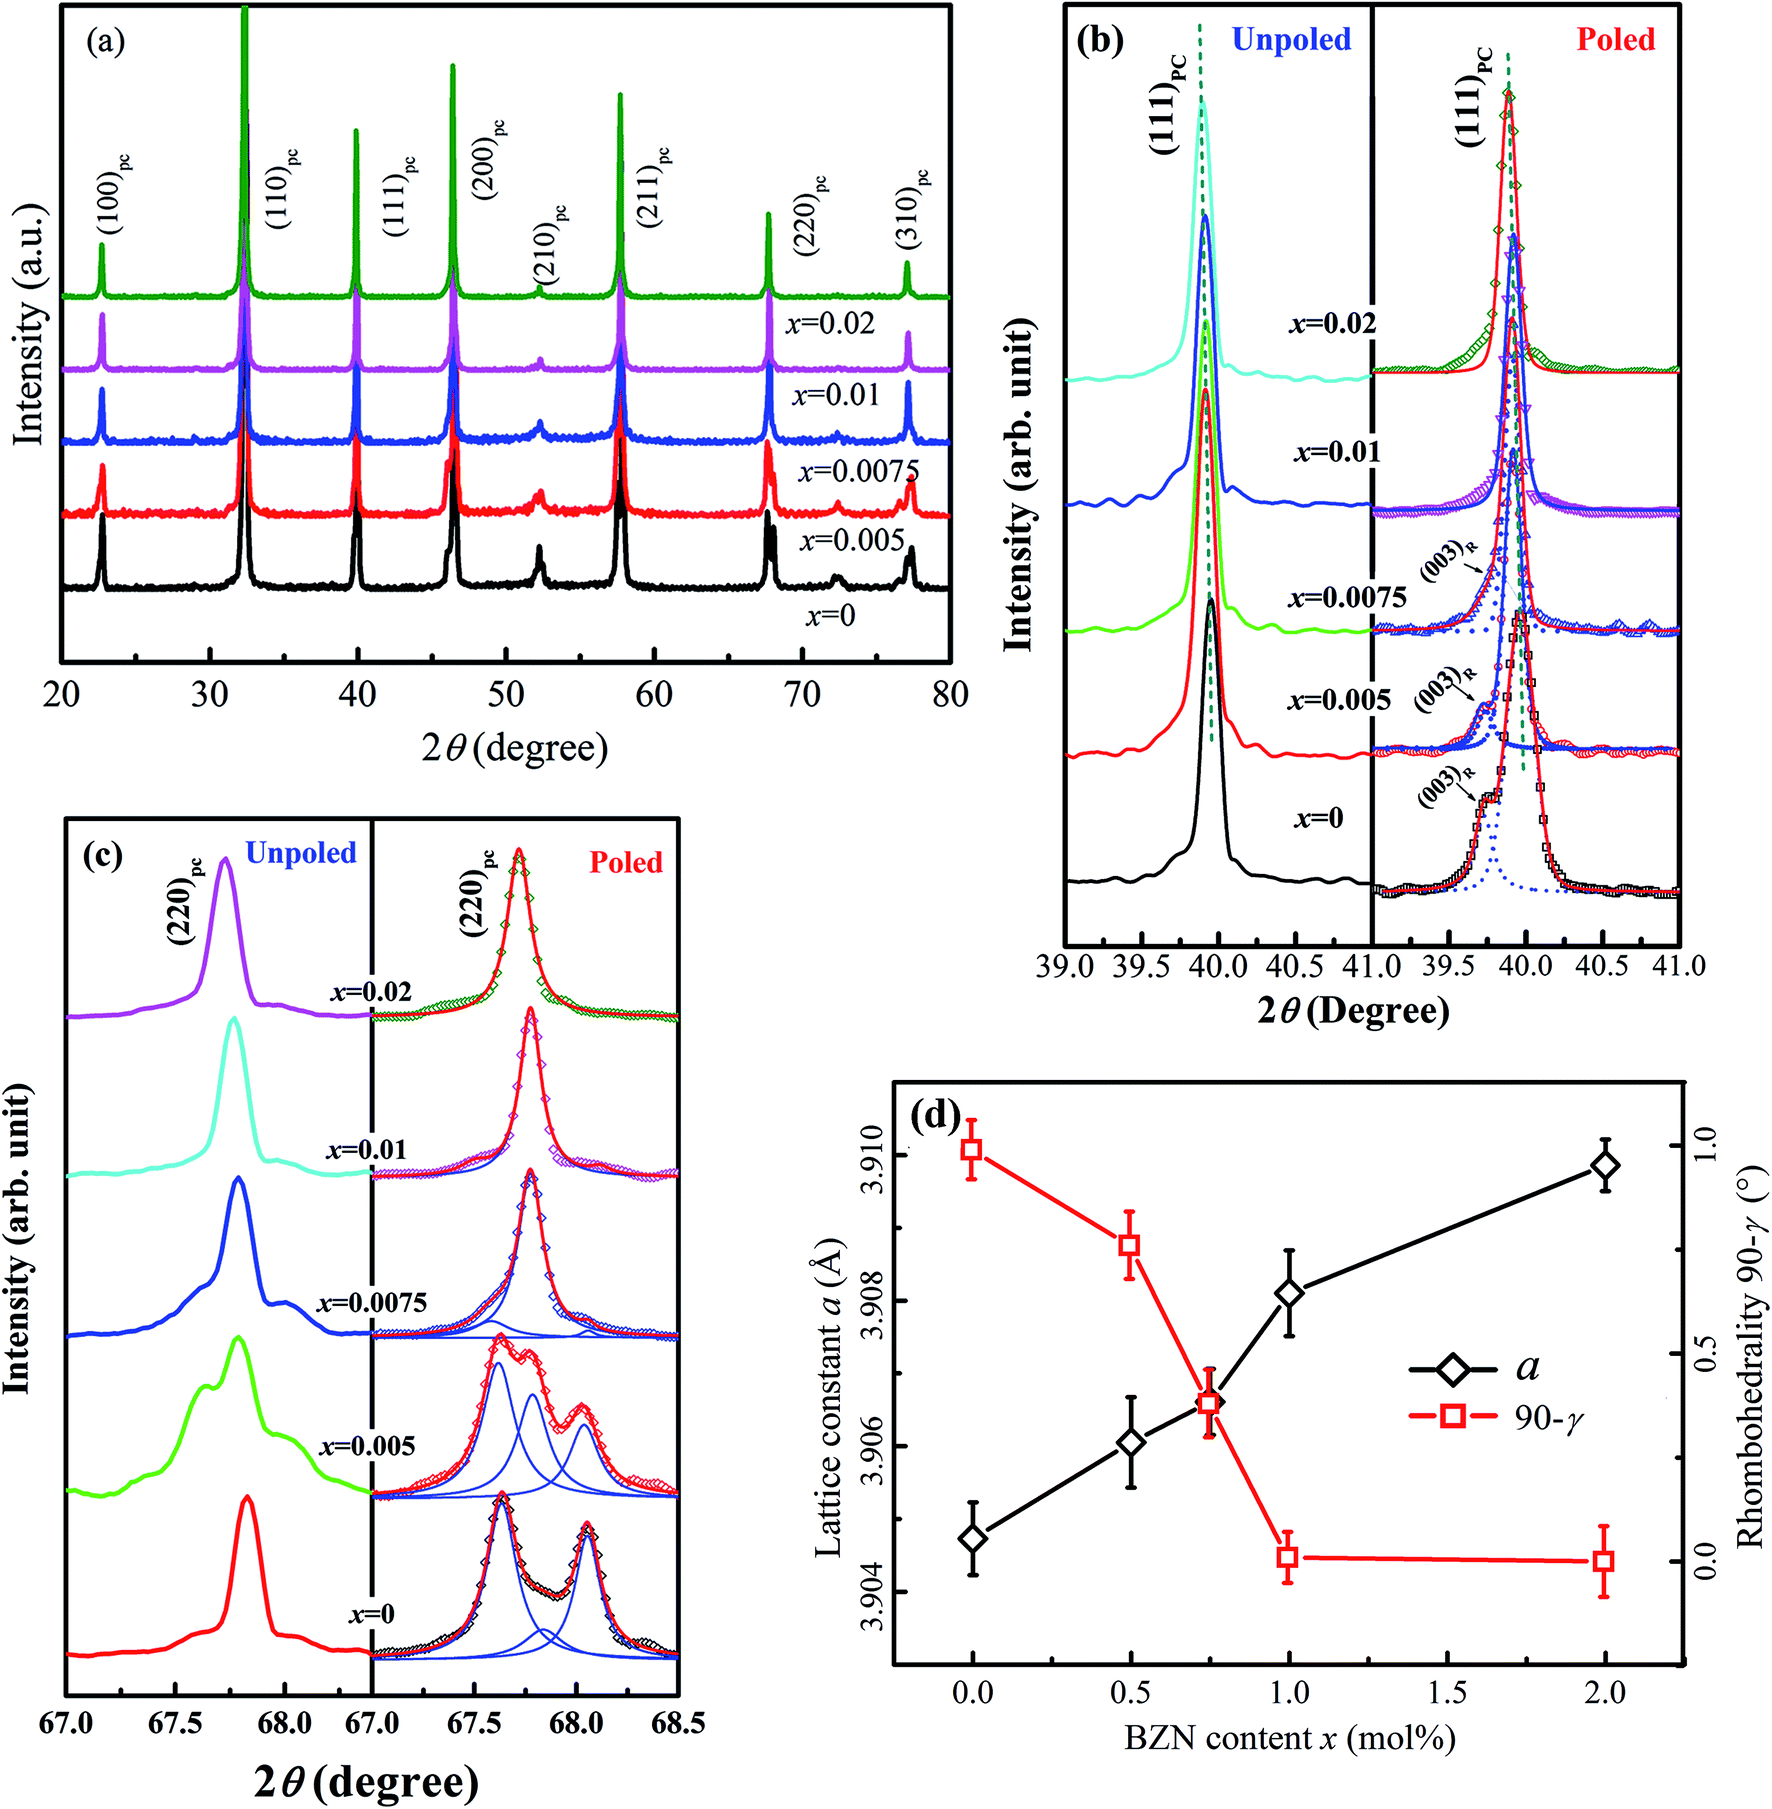 | ||
| Fig. 2 Powder XRD patterns (a), fine-scanning XRD patterns around 2θ = 40° (b) and 68° (c) as well as the cell refinement result (d) of compositions x = 0–0.02. | ||
To verify the percolation of AFE relaxor phase with P4bm structure, the HR TEM observation was carried out on the composition x = 0.01. It can be seen from Fig. 3 that the atomic arrangement is quite orderly along the [001]c zone axis, which indicates its perfect perovskite structure. As given in the inset, the selected-area diffraction pattern (SADP) shows a P4bm symmetry as revealed by the presence of 1/2{ooe} superlattice diffraction spots by fast fourier transformation software analysis.
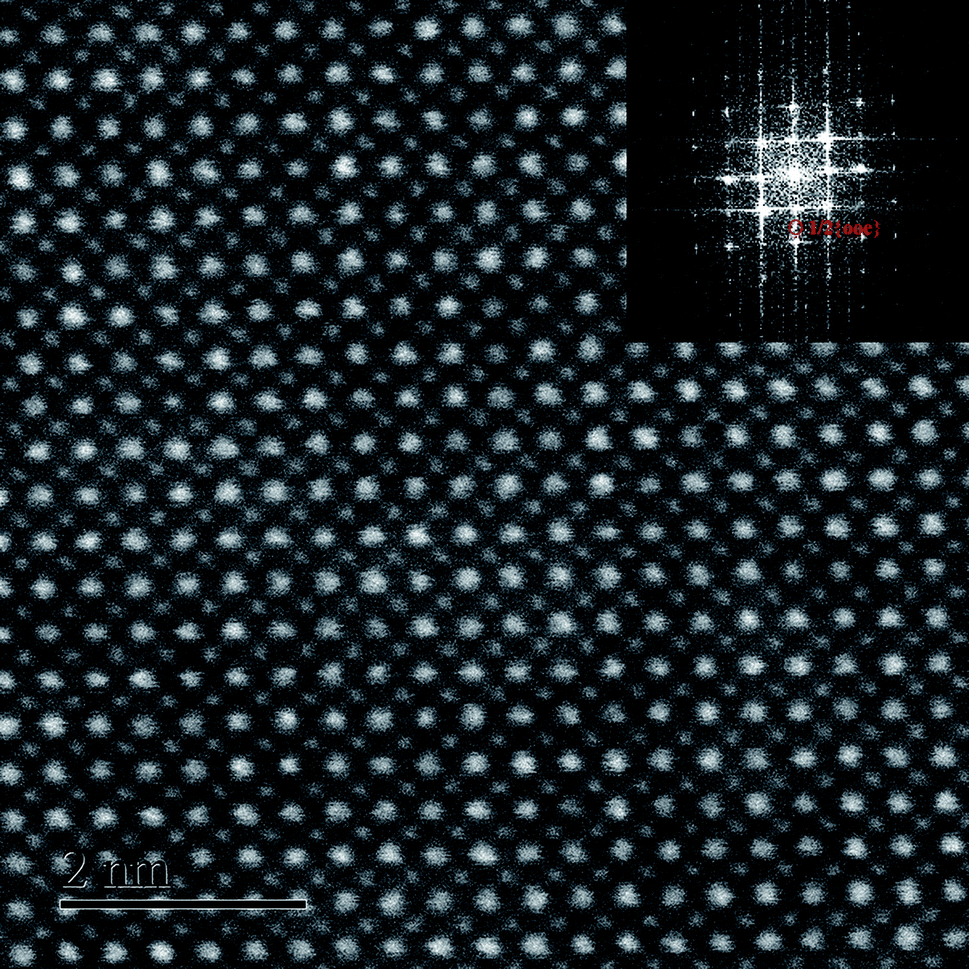 | ||
| Fig. 3 HR TEM image and the selected-area diffraction pattern of composition x = 0.01. | ||
To verify the effect of BZN addition on the long-range ferroelectric order, the electric impedance spectroscopy was carried out. It is reported that the relaxor phase with P4bm symmetry demonstrates a nanosize domain configuration.16 And the nanosized AFE relaxor domains will bring in a shoulder response in the modulus M′′(f) spectra at high temperature.17 Fig. 4 gives the M′′(f) spectra of the compositions x = 0, 0.005, and 0.01 at 300 °C. Obviously, the shoulder response enhances gradually with the BZN addition, affirming that the addition of BZN brings in the volume growth of the AFE relaxor domains. Especially, as the BZN added, the frequency fmax corresponding to maximum M′′ of the shoulder response shifts to high frequency, which infers the dimension reduction of the nanosized AFE relaxor domains.18 In a word, the BZN addition not only increases the volume but also reduces the dimension of the nanosized AFE relaxor domains.
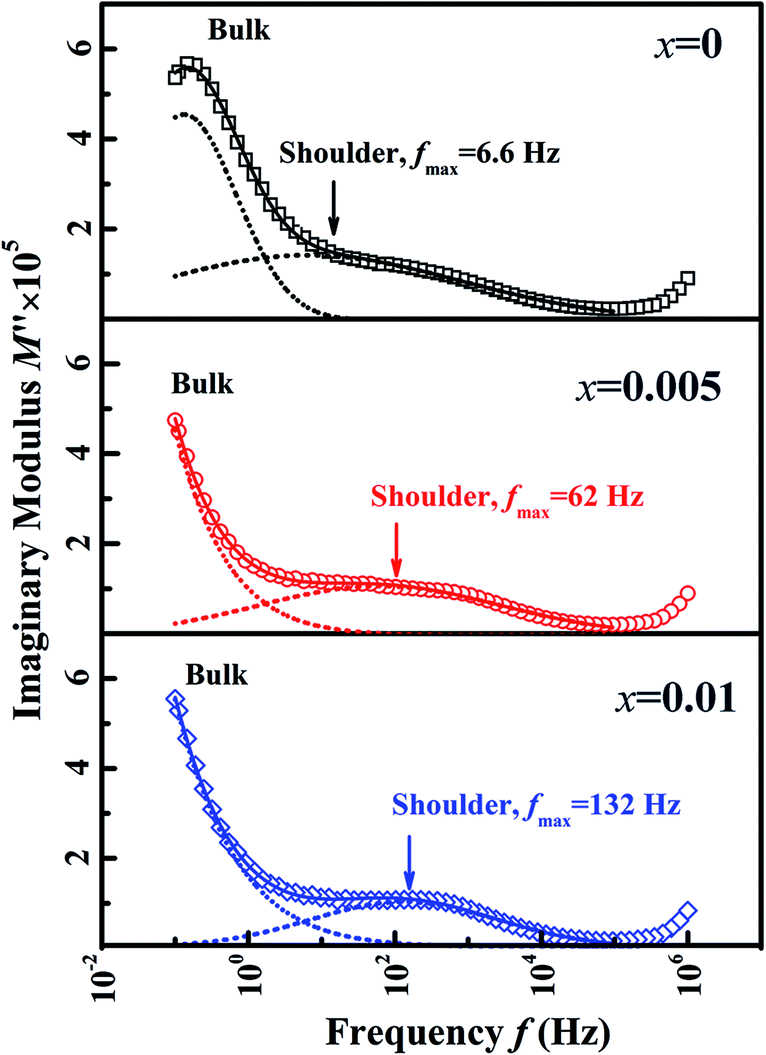 | ||
| Fig. 4 M′′(f) spectra of compositions x = 0, 0.005, and 0.01 at 300 °C. | ||
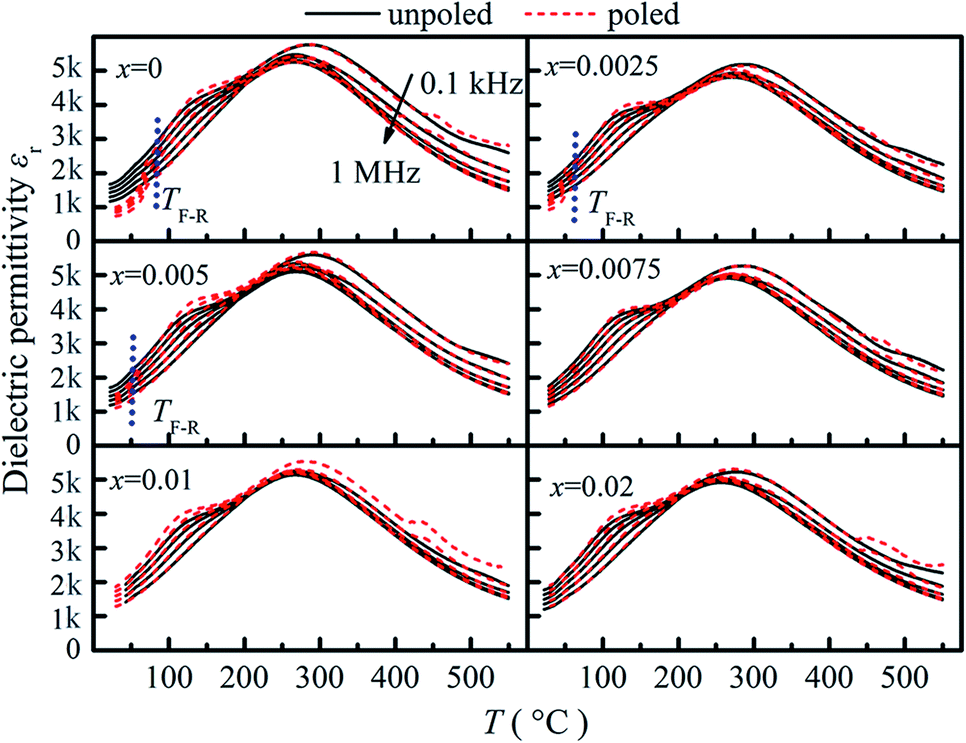
Fig. 5 shows the temperature dependence of dielectric permittivity (εr) of unpoled and poled compositions (x = 0–0.02). As seen from Fig. 5, two anomalies are observed for the composition x = 0. A maximum of dielectric permittivity with significant frequency dispersion occurs at about 280 °C (Tmax), which is the relaxation of AFE relaxor phase with P4bm structure without any measurable structural transition.19 Besides, a frequency-independent divergence of the εr before and after poling is observed at 90 °C for the composition x = 0, which corresponds to the transition from ferroelectric to AFE relaxor20,21 and defined as the temperature TF–R. As BZN added, the TF–R lowers to about 45 °C for composition x = 0.005, indicating the composition-induced ferroelectric to relaxor phase transition.21 Besides, the lowering of the TF–R is also relate to the decrease of the rhombohedrality 90-γ22,23 and reveals that the BZN addition weakened the stability of ferroelectric domains. However, for the compositions x > 0.005, the divergence could not be distinguished in the dielectric responses, which is associated with the fact that the relaxation process of the remanent ferroelectric phase is almost swamped in that of AFE relaxor.24
 | ||
| Fig. 5 Temperature dependent dielectric permittivity of compositions x = 0–0.02 before and after poling. | ||
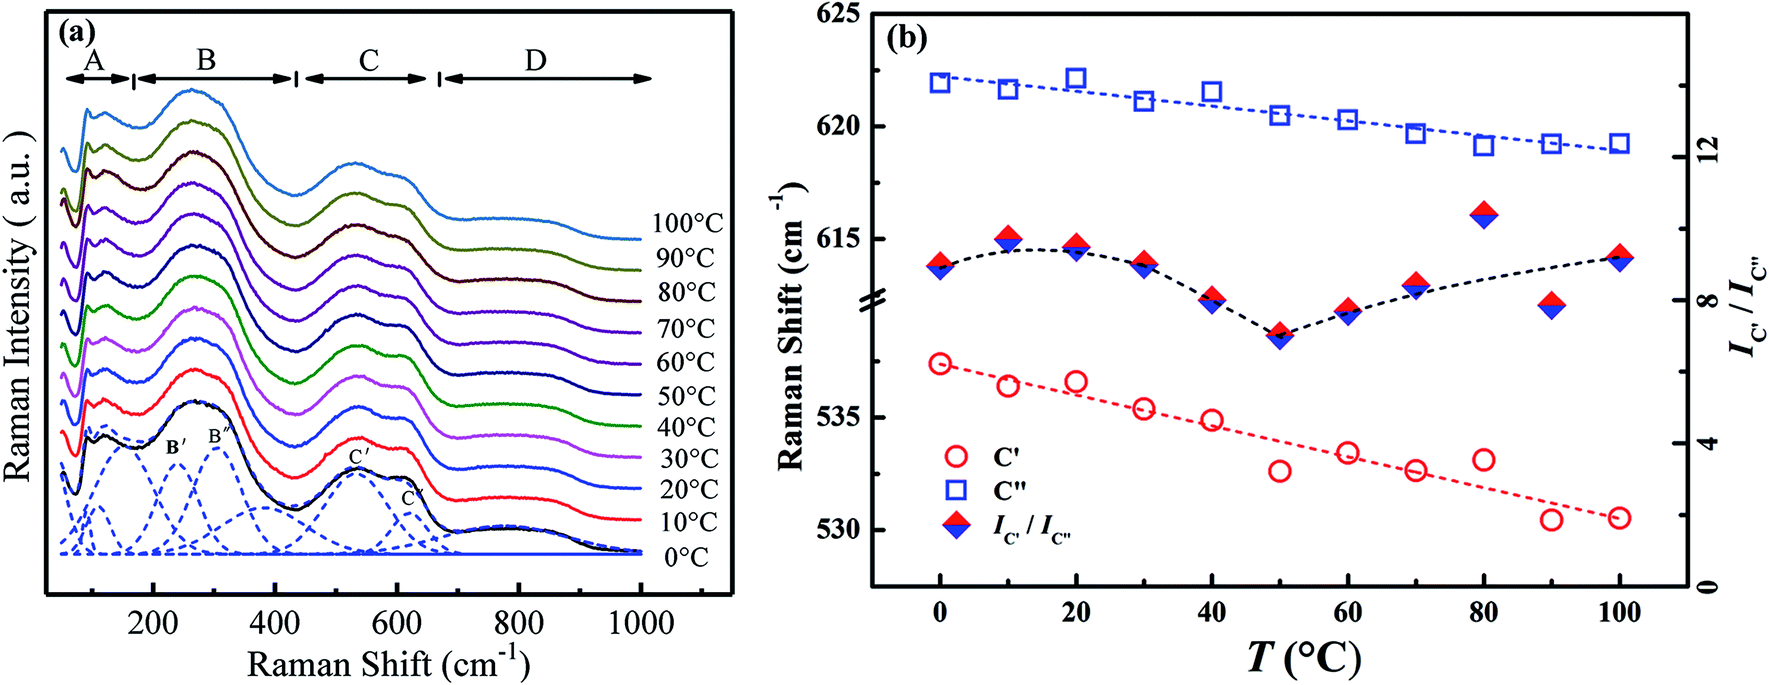
Raman scattering spectroscopy could yield important information about the local phase structure. Fig. 6a exhibits the temperature-variable Raman scattering spectra of the composition x = 0.01 from 0 °C to 100 °C and the deconvolutions by LabSpec5 software using Gaussian shape lines. It is reported that the Raman spectra of BNBT could be divided into four regions A, B, C and D.25 Among them, modes C′ and C′′ in the range of 560–620 cm−1 present double splitting peaks of the oxygen octahedra. Fig. 6b shows the temperature dependence of the Raman shift of the modes C′ and C′′ as well as their intensity ratio IC′/IC′′. It can be seen that the modes C′ and C′′ shift to low wavenumbers, which could be assorted to the enlargement of average B–O bond length induced by the lattice expansion. The softening of modes C will result in the weakening of the coupling between BO6 and induce the phase transition.26–28 Meanwhile, a sudden turning point is observed at 50 °C in the IC′/IC′′ curve, a sign of variation of cation ordering since the B–O bonds are influenced by the dynamics of the nanodomain phases.25 As mentioned above (Fig. 5), for composition x = 0.01, no obvious dielectric divergence could be observed that the TF–R could not be distinguished. The inflection at 50 °C appeared in Raman spectra (Fig. 6b) approves the existence of the ferroelectric to AFE relaxor transition for the composition x = 0.01, implying that the remanent ferroelectric domains exist, similar to the composition with low BZN addition.
 | ||
| Fig. 6 Temperature-dependent Raman scattering spectra (a) and the deconvolutions results (b) of composition x = 0.01 from 0 °C to 100 °C. | ||
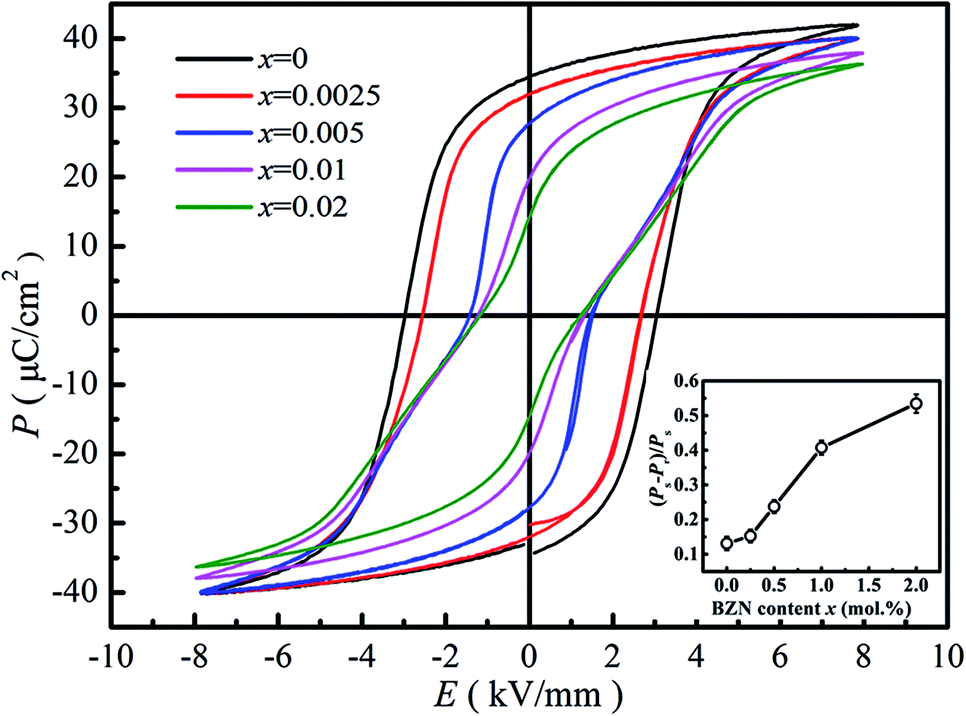
Fig. 7 gives the ferroelectric P–E loops of BNBZN100x samples. As seen from Fig. 7, the saturated P–E loops were observed for compositions x < 0.005, a typical sign of a ferroelectric. As x increased to 0.005, the P–E loops began to be pinched, which is the result that the AFE relaxor phase with tetragonal P4bm structure percolates down to room temperature.15,29 Further increase of BZN addition induces the P–E loop pinched much severely, inferring the contribution of nanosized AFE relaxor phase on the ferroelectric response. Generally, the nanosized AFE relaxor phase can reversibly evolve into a long-range ferroelectric order under an electric field, and return to original ‘nonpolar’ state at zero field.30 Considering that the remanent polarization Pr is the contribution from ferroelectric phase while the spontaneous polarization Ps is the glossary contribution originating both ferroelectric and nanosized AFE relaxor domains, the ratio (Ps − Pr)/Ps could be regarded as the indication of the polarization contribution originating from the nanosized AFE relaxor phase. The inset of Fig. 7 gives the (Ps − Pr)/Ps value as a function of composition x. Obviously, the ratio (Ps − Pr)/Ps increases monotonously with BZN content, indicating that the contribution of nanosized AFE relaxor domains to polarization enhances. In a word, the addition of BZN destroys the ferroelectric order and increases the volume of nanosized AFE relaxor domains, which will affect its field-induced strain behaviors.
 | ||
| Fig. 7 P–E hysteresis loops of compositions x = 0–0.02 at 1 Hz. The inset shows the dependence of (Ps − Pr)/Ps on BZN content. | ||
Fig. 8 shows the field-induced strain behaviors of BNBZN100x ceramics. As mentioned above, BZN addition results in the percolation of AFE relaxor phase with P4bm structure down to room temperature. As seen from Fig. 8a, the compositions x ≤ 0.0075 exhibit the butterfly shaped S–E loops, which is consistent with their nature of ferroelectricity as mentioned in previous section; hence, the back switching of ferroelectric domains results in a visible negative strain Sneg during bipolar cycle.31 However, the compositions x ≥ 0.01, the S–E loops become into a sprout shape since the samples are dominated by the AFE relaxor behaviors. Fig. 8b depicts the positive strain Spos, negative strain Sneg and the dynamic piezoelectric coefficient  (=Smax/Emax) as a function of BZN content. For compositions x ≤ 0.0075, the samples present a relatively large negative strain Sneg. Further increase x to 0.01, the negative strain Sneg approaches to zero. A critical composition boundary between ferroelectric response and AFE relaxor response appears at composition x = 0.01, and dynamic piezoelectric
  up to 487 pm V−1 are achieved at this critical composition boundary.
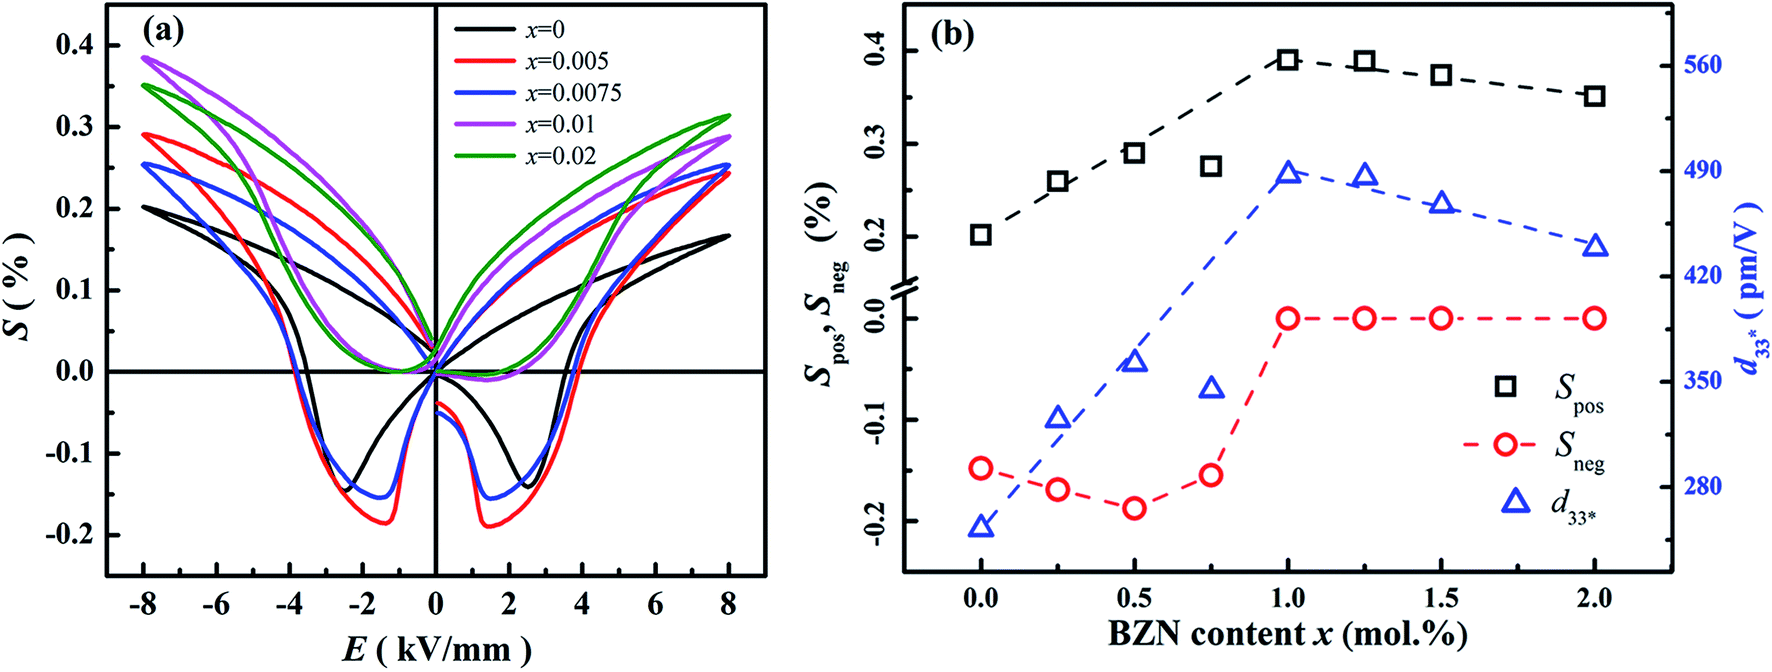 | ||
Fig. 8 S–E strain curves of compositions x = 0–0.02 at 1 Hz (a) and the composition dependence of positive strain Spos, negative strain Sneg and the  as a function of BZN content (b). as a function of BZN content (b). | ||
Besides of the large strain, the composition x = 0.01 demonstrates well stability against frequency, field and temperature. Fig. 9a and b shows the field-induced strain of the composition x = 0.01 as a function of electric field and frequency, respectively. Well-defined field-induced strains at different fields and frequencies could be observed in Fig. 9a and b, and the S–P2 curves almost overlap for different fields and frequencies, indicating the high stability against voltage and frequency. Besides, it is interesting that, within the temperature range from 20 °C to 120 °C in Fig. 9c, the field-induced strain fluctuates in the range from 0.25% to 0.27% by a slight deviation less than 8%. All in all, the composition x = 0.01 shows a giant field-induced strain with excellent stability against frequency, applied field and temperature, which is of importance in application as lead-free actuators and micro-positioners.
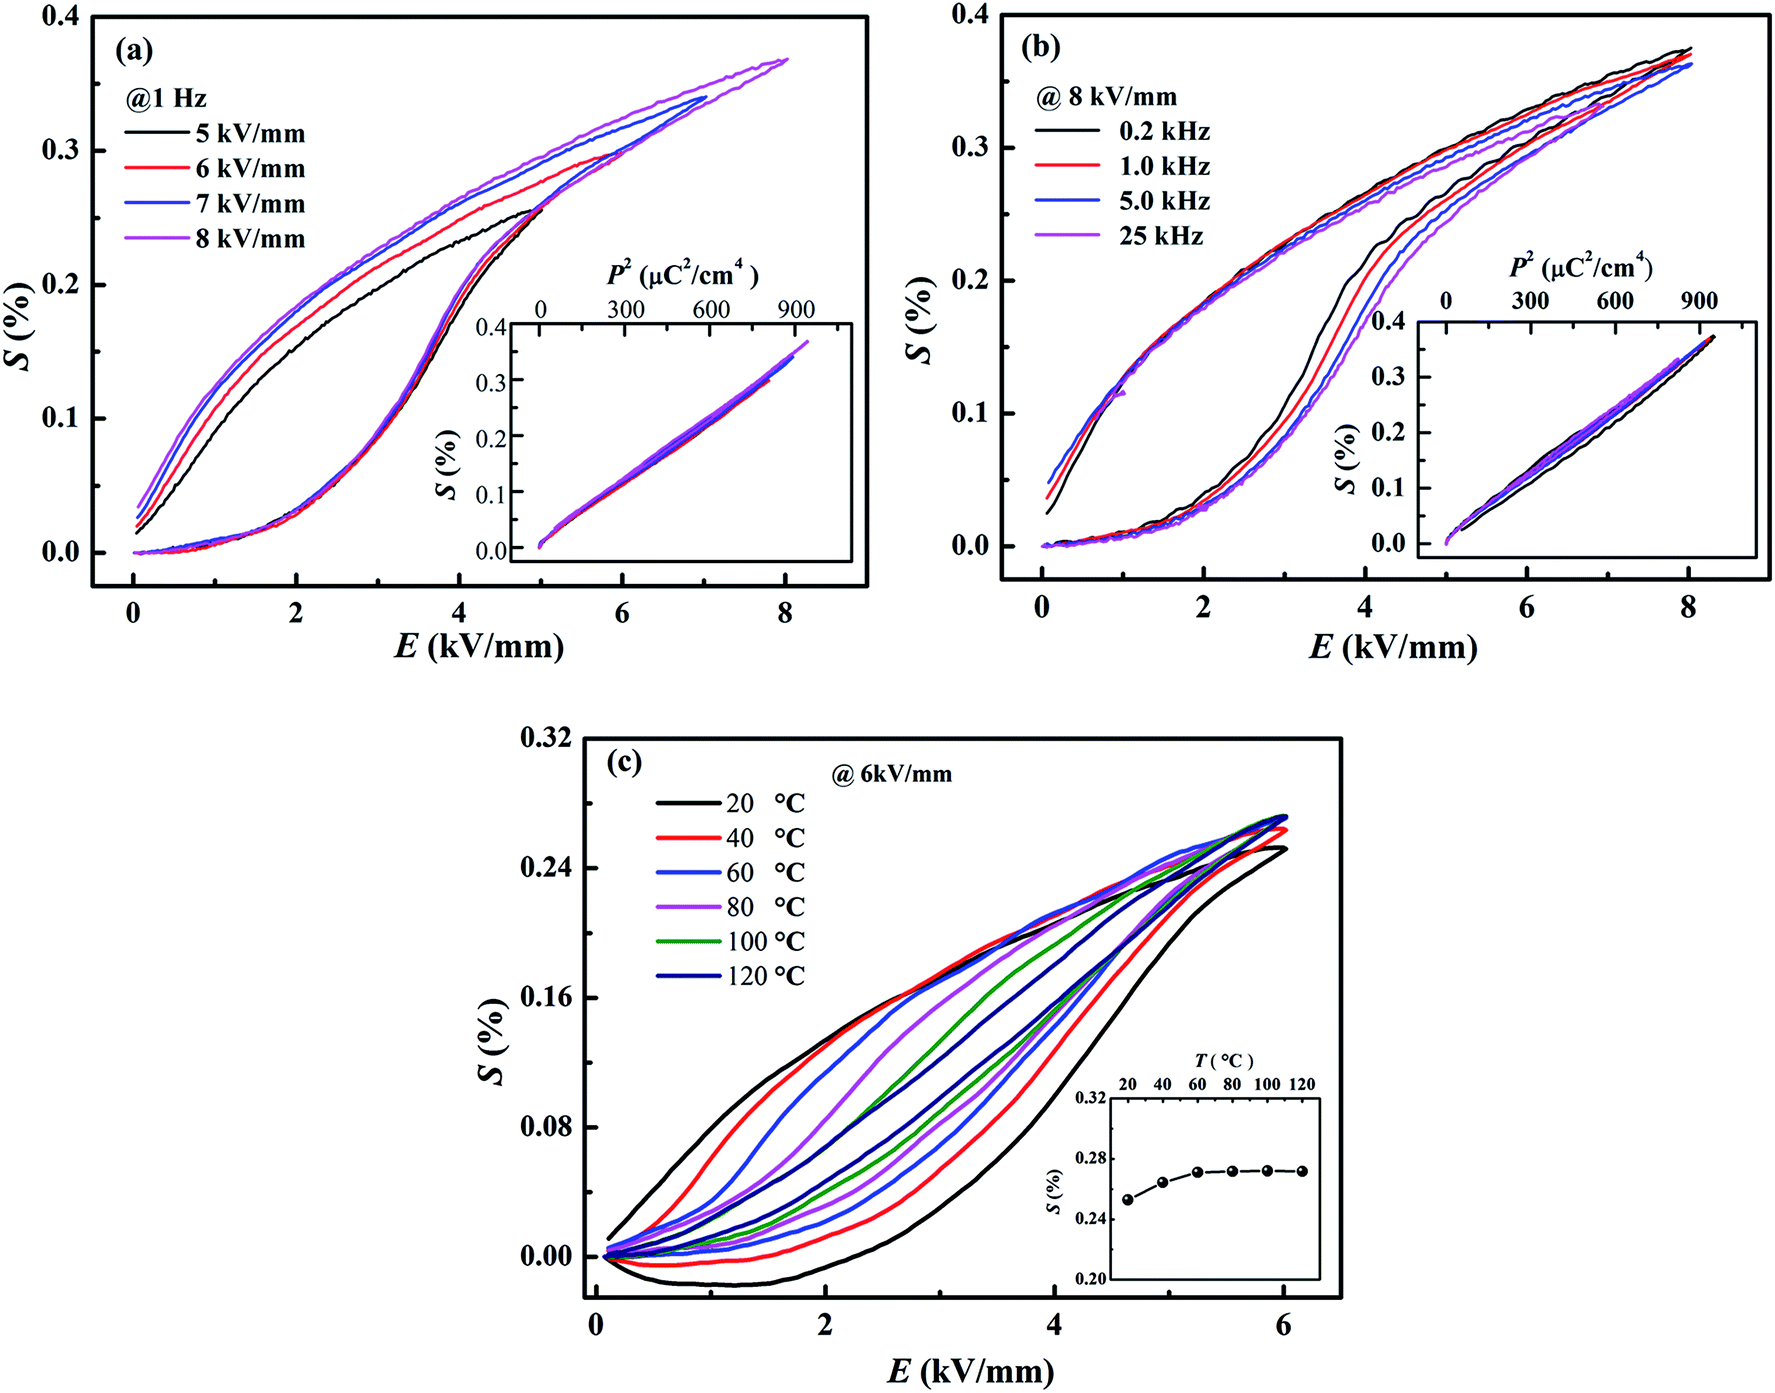 | ||
| Fig. 9 Unipolar strain loops of the composition x = 0.01 at different fields (a), frequencies (b) and temperatures (c). The insets in (a) and (b) show the S–P2 profiles, and the inset in (c) shows the temperature-dependence of field-induced strain. | ||
IV. Conclusion
Lead-free (1-x)(Bi0.5Na0.5)0.93Ba0.07TiO3 (BNBT)-xBa(Zn1/3Nb2/3)O3 (BZN) ferroelectric ceramics with perovskite structure were successfully fabricated by a columbite route. It is found that BZN addition causes the decrease of the rhombohedrality 90-γ and the expansion of the crystal lattice, thus inducing the phase evolution from ferroelectric (R3c) to AFE relaxor (pseudocubic, P4bm). Moreover, the incorporation of BZN into BNBT lattice leads to the nanosize domains of AFE relaxor reducing in the dimension and percolating to low temperature. A large field-induced strain of 0.39% and dynamic piezoelectric of 487 pm V−1 were achieved at the composition x = 0.01, which locates at the critical composition boundary between ferroelectric state and AFE relaxor state. To be highlighted, the composition x = 0.01 shows a stable field-induced strain against voltage, frequency, and temperature, making it of potential application in lead-free solid-state actuators.
Conflicts of interest
The authors declare there is no conflicts of interest regarding the publication of this paper.Acknowledgements
This work was partially supported by the National Natural Science Foundation of China (51602012, 51677001), Natural Science Foundation of Beijing (4164078), Ri-Xin Talents Project of Beijing University of Technology (2017-RX(1)-15), Jing-Hua Talents Project of Beijing University of Technology (2015-JH-L04) and Beijing Municipal High Level Innovative Team Building Program (IDHT20170502).References
- K. Uchino, Sci. Technol. Adv. Mater., 2015, 16, 046001 CrossRef PubMed
.
- J. Rödel, K. G. Webber, R. Dittmer, W. Jo, M. Kimura and D. Damjanovic, J. Eur. Ceram. Soc., 2015, 35, 1659–1681 CrossRef
- N. J. Donnelly, T. R. Shrout and C. A. Randall, J. Am. Ceram. Soc., 2009, 92, 1203–1207 CrossRef CAS
- J. E. Daniels, W. Jo, J. Rödel, V. Honkimäki and J. L. Jones, Acta Mater., 2010, 58, 2103–2111 CrossRef CAS
- E. A. Rogacheva, Phys. B, 2000, 291, 359–367 CrossRef CAS
- V. Dorcet, G. Trolliard and P. Boullay, Chem. Mater., 2009, 20, 5061–5073 CrossRef
- Y. Yu and R. N. Singh, J. Appl. Phys., 2003, 94, 7250–7255 CrossRef CAS
- S.-T. Zhang, F. Yan and B. Yang, J. Appl. Phys., 2010, 107, 114110 CrossRef
- X. Liu, B. Liu, F. Li, P. Li, J. Zhai and B. Shen, J. Mater. Sci., 2018, 53, 309–322 CrossRef CAS
- S. Zhang, A. B. Kounga, E. Aulbach, H. Ehrenberg and J. Rödel, Appl. Phys. Lett., 2007, 91, 1804 Search PubMed
- J. Chen, Y. Wang, Y. Zhang, Y. Yang and R. Jin, J. Eur. Ceram. Soc., 2017, 37, 2365–2371 CrossRef CAS
- S. Zhang, A. Devonport, N. Newman and P. K Davies, J. Am. Ceram. Soc., 2015, 98, 1188–1194 CrossRef CAS
- Q. Wei, M. Zhu, L. Li, Z. Guo, M. Zheng and Y. Hou, J. Alloys Compd., 2018, 731, 631–635 CrossRef CAS
- Y.-J. Siao and X. Qi, J. Alloys Compd., 2017, 691, 672–682 CrossRef CAS
- S.-T. Zhang, A. B. Kounga, W. Jo, C. Jamin, K. Seifert, T. Granzow, J. Rodel and D. Damjanovic, Adv. Mater., 2009, 21, 4716–4720 CrossRef CAS
- C. Ma, X. Tan, E. Dul'kin and M. Roth, J. Appl. Phys., 2010, 108, 104105 CrossRef
- S. Praharaj, D. Rout, S. Anwar and V. Subramanian, J. Alloys Compd., 2017, 706, 502–510 CrossRef CAS
- J. Zang, M. Li, D. C. Sinclair, W. Jo, J. Rödel and S. Zhang, J. Am. Ceram. Soc., 2014, 97, 1523–1529 CrossRef CAS
- W. Jo, S. Schaab, E. Sapper, L. A. Schmitt, H. J. Kleebe, A. J. Bell and J. Rodel, J. Appl. Phys., 2011, 110, 074106 CrossRef
- D. I. Woodward, R. Dittmer, W. Jo, D. Walker, D. S. Keeble, M. W. Dale, J. Rödel and P. A. Thomas, J. Appl. Phys., 2014, 115, 114109 CrossRef
- X. Liu, F. Li, P. Li, J. Zhai, B. Shen and B. Liu, J. Eur. Ceram. Soc., 2017, 37, 4585–4595 CrossRef CAS
- Y. Hiruma, K. Yoshii, H. Nagata and T. Takenaka, J. Appl. Phys., 2008, 103, 084121 CrossRef
- X. Liu, J. Zhai, B. Shen, F. Li, Y. Zhang, P. Li and B. Liu, J. Eur. Ceram. Soc., 2017, 37, 1437–1447 CrossRef CAS
- T. Rödig, A. Schönecker and G. Gerlach, J. Am. Ceram. Soc., 2010, 93, 901–912 CrossRef
- B. Wylie-van Eerd, D. Damjanovic, N. Klein, N. Setter and J. Trodahl, Phys. Rev. B: Condens. Matter Mater. Phys., 2010, 82, 104112 CrossRef
- L. Luo, W. Ge, J. Li, D. Viehland, C. Farley, R. Bodnar, Q. Zhang and H. Luo, J. Appl. Phys., 2011, 109, 6 Search PubMed
- J. Kreisel, A. M. Glazer, P. Bouvier and G. Lucazeau, Phys. Rev. B: Condens. Matter Mater. Phys., 2001, 63, 145–155 CrossRef
- S. V. Kalinin, B. J. Rodriguez, J. D. Budai, S. Jesse, A. N. Morozovska, A. A. Bokov and Z. G. Ye, Phys. Rev. B: Condens. Matter Mater. Phys., 2010, 81, 064107 CrossRef
- C. Moure and O. Peña, Prog. Solid State Chem., 2015, 43, 123–148 CrossRef CAS
- A. Ullah, M. Alam, A. Ullah, C. W. Ahn, J.-S. Lee, S. Cho and I. W. Kim, RSC Adv., 2016, 6, 63915–63921 RSC
- D. L. West and D. A. Payne, J. Am. Ceram. Soc., 2003, 86, 192–194 CrossRef CAS
| This journal is © The Royal Society of Chemistry 2018 |