DOI:
10.1039/C8RA00594J
(Paper)
RSC Adv., 2018,
8, 10185-10196
Synthesis of gemini basic ionic liquids and their application in anion exchange membranes
Received
20th January 2018
, Accepted 8th March 2018
First published on 13th March 2018
Abstract
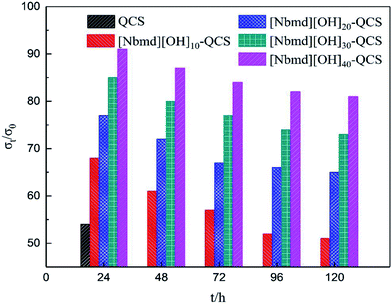
A gemini-type basic morpholine ionic liquid ([Nbmd][OH]) was synthesized via a two-step method with morpholine, bromododecane and 1,4-dibromobutane as raw materials, and its structure was characterized by 1H NMR and FT-IR spectroscopy. Meanwhile, a series of anion exchange membranes ([Nbmd][OH]x–QCS) were prepared with quaternized chitosan (QCS) as the polymer matrix and [Nbmd][OH] as the dopant owing to its strong alkalinity and good solubility. The structures of the [Nbmd][OH]x–QCS composite membranes were characterized in detail by FT-IR spectroscopy, the OH− conductivity by AC impedance spectroscopy, and the morphological features by scanning electron microscopy (SEM), thermal gravity analysis (TGA), etc. The results show that the [Nbmd][OH]x–QCS composite membranes have uniform surfaces and cross-section morphology. Increasing the content of [Nbmd][OH] not only enhances the thermal stability but also increases the OH− conductivity; the thermal decomposition temperature of the [Nbmd][OH]40–QCS membrane is nearly 20 °C higher than that of the pristine QCS membrane, and the maximum OH− conductivity is approximately 1.37 × 10⁻² S cm−2 at 70 °C. The methanol permeability of the [Nbmd][OH]40–QCS membrane in 1 M methanol at room temperature is 2.21 × 10⁻⁶ cm−2 s−1, which is lower than that of Nafion®115, indicating a promising potential use in alkaline direct methanol fuel cells. Moreover, the [Nbmd][OH]40–QCS membrane exhibits the best alkaline stability of all the membranes prepared in this work, retaining approximately 81% of its initial conductivity after immersion in 3 M KOH solution for 120 h at 70 °C.
1 Introduction
Polymer electrolyte membrane fuel cells are generally regarded as effective energy alternatives due to their providing more power for less fuel than current thermal engines.1,2 Among them, the direct methanol fuel cell (DMFC) holds favor as a highly promising candidate for application as a portable power source on account of its ease of storage and use of methanol as a liquid fuel. As one of the most important components of fuel cells, proton exchange membranes (PEMs), such as Nafion® series membranes, have been well developed during recent decades. Although Nafion membranes exhibit high OH− conductivity and excellent thermal and chemical stability, the commercialization of proton exchange membrane fuel cells (PEMFCs) is hindered by the use of high-cost precious metal electro-catalysts, slow oxygen reduction kinetics in acidic conditions3,4 and decreased proton conductivity at temperatures above 70 °C, which results in the evaporation of water from the membranes and thus limits proton mobility.5 Recently, anion exchange membrane fuel cells (AEMFCs) have exhibited many competitive advantages, such as improved electrode reaction kinetics, allowing the use of non-precious metal electro-catalysts (such as Fe, Co, and Ni), reduced corrosion problems, etc., which make these fuel cells more cost effective.
At present, the studies on anion exchange membranes (AEMs) are mainly focused on chemical grafting by quaternary ammonium groups and polymer matrix modified by cationic active sites and other methods of chemical modification.6–8 However, the primary limitations of the use of anion exchange membranes (AEMs) in AEMFCs are still the low OH− conductivity and poor chemical stability at high pH9,10 due to the degradation of cationic groups caused by direct nucleophilic substitution and/or Hofmann elimination.11
In recent years, ionic liquids (ILs), which possess unique properties including high thermal stability, high OH− conductivity and wide electrochemical windows, have been used in a large variety of applications in many kinds of chemical industries, and some achievements have been made in the application of polymer electrolyte membranes.12–14 Zhu et al.15 found that the electrochemical performance of the prepared PVA/[Bmim]OH composite membrane was significantly enhanced by the addition of ILs ([Bmim]OH), and the maximum OH− conductivity reached 1.96 × 10⁻² S cm−2 at ambient temperature when the mass ratio of [Bmim]OH to PVA was 2.0; Yi et al.16 added the imidazole ionic liquids to sulfonated polyetheretherketone (PEEK) and found that the thermal stability of the composite membrane containing ionic liquids was higher than that of the neat PEEK membrane, the conductivity of the composite membrane increased with the increasing content of ILs and the maximum conductivity reached 8.3 × 10⁻² S cm−2 at 70 °C. Although some progress in the field of fuel cell exchange membranes had been made, most studies are still dominated by single-core ionic liquids. Gemini-type ionic liquids, due to their dual-core structure, have somewhat stronger and more intensive basic positions (cationic active sites) than single-core ionic liquids. Thus, they exhibit higher stability and stronger alkalinity.17–19 However, unfortunately, few studies have been reported.
In this work, low-cost morpholine was used as a raw material to synthesize gemini basic morpholine ionic liquids ([Nbmd][OH]) via a two-step procedure based on our previous work,20 and a chitosan derivative, quaternized chitosan (QCS), was used as the membrane matrix. The synthesized ionic liquids ([Nbmd][OH]) were locked in the structure of the membrane as dopants by the crosslinking action of glutaraldehyde (GA). Then, we prepared the composite membranes and assessed their characteristics to investigate the application potential in anion exchange membranes.
2 Experimental
2.1 Materials
Analytical grade N-methyl morpholine, 1-bromododecane, 1,4-dibromobutane and chitosan (deacetylation degree ≥ 90.0%, determined by titration21) were obtained from Sinopharm Chemical Reagent Co., Ltd, China. Analytical grade anhydrous ethanol, sodium hydroxide (NaOH), potassium hydroxide (KOH), glutaraldehyde (GA, 50 wt%), glacial acetic acid, isopropanol, and hydrochloric acid were purchased from Shenyang Xinhua Reagent Factory, China. (2.3-Epoxypropyl) trimethylammonium chloride (EPTMAC, purity ≥ 95%) was commercially supplied by Shandong GuoFeng Fine Chemistry Factory.
2.2 Methods
2.2.1 Synthesis of dual-core basic ionic liquids (ILs). The gemini basic ILs were prepared in two steps. (1) Given amounts of 1-bromododecane and NaOH were added to a dry round-bottomed flask equipped with a condenser and heated to 40 °C. In addition, then, 70 °C preheated N-methyl morpholine aqueous solution was added dropwise into the flask, and stirring was continued for 7 h at 130 °C. After this reaction time, the mixture was allowed to rest at room temperature, and then, the upper layer was separated with a separatory funnel as the intermediate product dodecyl morpholine (molar ratio: n1-bromododecane![[thin space (1/6-em)]](https://www.rsc.org/images/entities/char_2009.gif) :
:![[thin space (1/6-em)]](https://www.rsc.org/images/entities/char_2009.gif) nN-methyl morpholine
nN-methyl morpholine![[thin space (1/6-em)]](https://www.rsc.org/images/entities/char_2009.gif) :
:![[thin space (1/6-em)]](https://www.rsc.org/images/entities/char_2009.gif) nNaOH
nNaOH![[thin space (1/6-em)]](https://www.rsc.org/images/entities/char_2009.gif) :
:![[thin space (1/6-em)]](https://www.rsc.org/images/entities/char_2009.gif) nwater = 1
nwater = 1![[thin space (1/6-em)]](https://www.rsc.org/images/entities/char_2009.gif) :
:![[thin space (1/6-em)]](https://www.rsc.org/images/entities/char_2009.gif) 1.2
1.2![[thin space (1/6-em)]](https://www.rsc.org/images/entities/char_2009.gif) :
:![[thin space (1/6-em)]](https://www.rsc.org/images/entities/char_2009.gif) 1.5
1.5![[thin space (1/6-em)]](https://www.rsc.org/images/entities/char_2009.gif) :
:![[thin space (1/6-em)]](https://www.rsc.org/images/entities/char_2009.gif) 5). (2) A given amount of dodecyl morpholine obtained from step (1) was placed in a dry round-bottomed flask, and then 1,4-dibromobutane was added under magnetic stirring for 7 h at 110 °C. The resulting yellow sticky liquid was dried at 50 °C under high vacuum for 24 h. After drying, an amount of the remaining powder (bromododecyl morpholine) and KOH were placed in an Erlenmeyer flask at a molar ratio of 1
5). (2) A given amount of dodecyl morpholine obtained from step (1) was placed in a dry round-bottomed flask, and then 1,4-dibromobutane was added under magnetic stirring for 7 h at 110 °C. The resulting yellow sticky liquid was dried at 50 °C under high vacuum for 24 h. After drying, an amount of the remaining powder (bromododecyl morpholine) and KOH were placed in an Erlenmeyer flask at a molar ratio of 1![[thin space (1/6-em)]](https://www.rsc.org/images/entities/char_2009.gif) :
:![[thin space (1/6-em)]](https://www.rsc.org/images/entities/char_2009.gif) 2 (nbromododecyl morpholine
2 (nbromododecyl morpholine![[thin space (1/6-em)]](https://www.rsc.org/images/entities/char_2009.gif) :
:![[thin space (1/6-em)]](https://www.rsc.org/images/entities/char_2009.gif) nKOH), and then 30 mL of anhydrous ethanol was added until the powder was completely dissolved, and the mixture was stirred for 48 h at room temperature to allow adequate ion exchange to proceed. After that time, KBr as a white solid was separated with a centrifugal separator from the liquid mixture, the solvent ethanol was removed from the remaining liquid by vacuum distillation, and then the resulting liquid was further dried at 80 °C under high vacuum for 48 h to obtained the synthesized dual-core basic ionic liquids, which were termed [Nbmd][OH]. The preparation of gemini basic ILs is schematically illustrated in Scheme 1.
nKOH), and then 30 mL of anhydrous ethanol was added until the powder was completely dissolved, and the mixture was stirred for 48 h at room temperature to allow adequate ion exchange to proceed. After that time, KBr as a white solid was separated with a centrifugal separator from the liquid mixture, the solvent ethanol was removed from the remaining liquid by vacuum distillation, and then the resulting liquid was further dried at 80 °C under high vacuum for 48 h to obtained the synthesized dual-core basic ionic liquids, which were termed [Nbmd][OH]. The preparation of gemini basic ILs is schematically illustrated in Scheme 1.
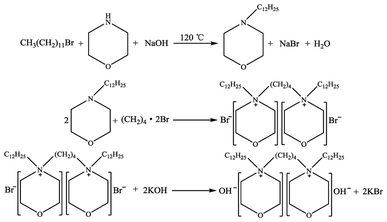 |
| | Scheme 1 Synthesis scheme of [Nbmd][OH] ILs. | |
2.2.2 Preparation of [Nbmd][OH]–QCS membranes. QCS with a quaternization degree of 23.5 (±2.5)% was synthesized based on our previous work.22 In a round-bottom flask equipped with a condenser and a magnetic stirrer, given amounts of QCS and [Nbmd][OH] were dissolved in 40 mL 2% (v/v) acetic acid aqueous solution in a N2 atmosphere at room temperature. After complete dissolution, GA aqueous solution (2%, v/v) was added to the mixture at a feeding rate of 0.5 mL min−1 to crosslink the QCS. The final mixture was stirred at room temperature for 4 h and then sonicated for another 30 min.The resulting mixture was poured onto a glass plate, and the solvent was then evaporated in an oven at 40 °C. Before characterization, the dried membrane was soaked in 1 M KOH aqueous solution for alkalization. The alkaline doping process lasted for 24 h. The membrane was then washed thoroughly with de-ionized water and dried at 40 °C to a constant weight. All procedures were performed in N2 atmosphere. Then, the obtained anion exchange membranes were termed [Nbmd][OH]x–QCS, where x denoted the final mass fraction of [Nbmd][OH] in the composite membrane. The preparation of the [Nbmd][OH]x–QCS membrane is schematically illustrated in Scheme 2.
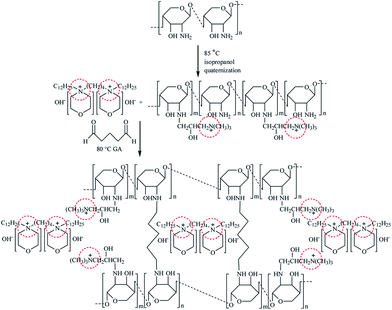 |
| | Scheme 2 Synthesis scheme of [Nbmd][OH]–QCS membrane. | |
2.3 Instruments and techniques
The nuclear magnetic resonance (NMR) spectra of [Nbmd]OH were recorded on a 1H NMR spectrometer (AV ANCE III 400, Bruker Company, Germany) in D2O and calibrated with tetramethylsilane (TMS) as the internal standard. In addition, FT-IR spectroscopy (Perkin-Elmer, America) was employed to characterize the chemical composition of pure QCS and QCS/[Nbmd]OH membranes, and all the samples were prepared as KBr pellets. The surface and cross-section of membranes were imaged using a scanning electron microscope (SEM, SSX-550, Shimadzu, Japan) after being coated with a conductive layer of sputtered gold. Thermogravimetric analysis (TGA) was performed using a TGA 290C analyzer (Netzsch Company, Germany) from 20 to 500 °C at a heating rate of 10 °C min−1 with continuous flushing with pure N2 at 200 mL min−1. The mechanical properties of the dry membrane were determined with a CMT6502 (SANS Company, China). Dumbbell-shaped membrane samples 25 mm × 4 mm in size were prepared, and the measurements were carried out by setting a constant separating speed of 5.00 mm min−1 under the ambient atmosphere. The tensile stress (TS) (MPa) was calculated by eqn (1):23where F is the applied force at break, A0 is the initial cross-section area of the sample, which is equal to 4 × L mm2, and L is the thickness of the membrane.
2.4 Water uptake (WU) and swelling ratio (SR) of the membranes
The water uptake and swelling ratio of the composite membranes were determined by measuring the changes in the weight and dimension of the composite membranes before and after hydration. The OH− form composite membranes were immersed in de-ionized water at room temperature and equilibrated for more than 48 h. The weight of the wet membrane was measured after wiping off the excess surface water. Then, the wet membrane was dried under vacuum at a fixed temperature of 60 °C until a constant dry weight was obtained. The WU and SR were calculated by the following equations:24,25| | |
WU(%) = (mwet − mdry)/mdry × 100%
| (2) |
| | |
SR(%) = (Xwet − Xdry)/Xdry × 100%
| (3) |
where mwet is the mass (g) of the wet membrane; mdry is the mass (g) of the dry membrane; Xwet is the dimension of the wet membrane; and Xdry is the dimension of the dry membrane.
2.5 Ion exchange capacity (IEC)
The IEC value is one of the important indices of the membrane conductivity performance. In this work, the IEC was measured using the conventional back titration method. A membrane sample (in OH− form) with known dry mass was first equilibrated with DI water for at least 24 h and rinsed copiously to remove any physisorbed ions; it was then soaked in a known volume of 0.01 M hydrochloric acid (HCl) for 48 h to change the membrane to the Cl− form. The HCl solution was titrated against 0.01 M NaOH (aq.) with phenolphthalein as an indicator. The IEC was calculated as follows:26| | |
IEC = (CHClVHCl – CNaOHVNaOH)/Wdry × 100%
| (4) |
where Wdry is the mass of the dried membrane, CHCl and CNaOH are the concentrations of HCl and NaOH solution, respectively, and VHCl and VNaOH are the volumes of HCl solution and NaOH solution consumed in the titration, respectively.
2.6 Anionic (OH−) conductivity
The OH− conductivity of the membranes was measured by an electrochemical impedance analyzer (CHI760) with an alternating current (AC) frequency scanned from 100 kHz to 0.1 Hz at a voltage amplitude of 100 mV. The fully hydrated membrane was sandwiched in a Teflon electrolyte cell equipped with Pt strips.27 The impedance was measured by placing the cell in a temperature-controlled chamber at a temperature range from 20 °C to 90 °C. The OH− conductivity (σ) of the membrane was calculated by eqn (5):| | |
σ (S cm−1) = 1/Rm × S
| (5) |
where l is the thickness of the membrane (cm), S is the membrane surface area (cm−2) for ion transport, and Rm is the membrane resistance (Ω) from the AC impedance data. The temperature was controlled by placing the conductivity measurement cell in an oven. The thicknesses of the membranes were obtained by previous swelling of the samples in the electrolyte solution before the measurements to prevent any deviation resulting from distortion of the membranes. All operations were performed in N2 atmosphere to prevent OH− from changing to HCO3− (or CO32−) by reacting with CO2.
2.7 Methanol permeability
The methanol permeability of the composite membranes was determined at room temperature using a homemade diffusion cell consisting of two compartments. To ensure uniformity during the experiments, magnetic stirrers were used in each compartment. The membrane was clamped between the two compartments. One compartment was loaded with 1 M methanol aqueous solution (compartment A) and the other with de-ionized water (compartment B). The methanol concentration resulting from permeation in compartment (B) at any time t (in seconds), i.e., CB in mmol L−1, was monitored using a gas chromatograph (GC-6820, Agilent, USA). The methanol permeability P (cm−2 s−1) through the membrane was calculated by eqn (6):| | |
P = LCBVB/(A2(CA − CB)t)
| (6) |
where A (cm2) and L (cm) are the membrane area and thickness, respectively; CA (mmol L−1) is the initial concentration of methanol in compartment (A); and VB (mL) is the water volume in compartment (B).
2.8 Alkaline resistance stability
The alkaline resistance stability was investigated by monitoring the conductivity of the membranes as a function of immersion time in KOH solutions. The detailed procedure was that the membranes were immersed in aqueous KOH (3 M) solutions at room temperature for different times. They were later thoroughly washed with de-ionized water (to remove the excess KOH) and immersed in de-ionized water for more than 24 h prior to the measurement of ionic conductivity at 70 °C. To distinguish the OH− conductivity of the membrane treated in KOH solution for 0 h and the composite membrane treated for different times (immersion time > 0 h), the former was designated σ0, and the latter was designated σt. The σt/σ0 ratios were recorded as a function of immersion time in the KOH solution.
2.9 Membrane electrode assemblies and fuel cell tests
Commercial Pt–Ru/C (30 wt% Pt, 15 wt% Ru) for the anode and Pt/C (20 wt% Pt) for the cathode were purchased from Johnson Matthey. The loading of Pt–Ru and Pt catalysts at the anode and cathode were both 0.5 mg cm−2. The obtained membrane/electrodes assembly (MEA) was then set into a 5 cm2 fuel cell for testing using a commercial fuel cell system (Arbin Instrument Corporation). 5 M KOH and 3 M ethanol were fed to the anode at a flow rate of 1 mL min−1 to provide three-phase boundary and sufficient OH−. At the same time, the cathode was supplied with 0.2 MPa O2.
3 Results and discussion
3.1 Characterization of [Nbmd][OH] by 1H NMR and FT-IR
Fig. 1 shows the 1H NMR spectra of the synthesized [Nbmd][OH] (400 MHz, D2O, TMS; ppm): a = 0.89 (6H, –CH3), b = 1.27 (32H, –(CH2)8–), c = 1.33 (4H, –CH2–), d = 1.75 (4H, –CH2–), g = 1.81 (4H, –CH2–), h = 3.29 (8H, –CH2–), e = 3.45 (4H, –CH2–), f = 3.57 (4H, –CH2–), i = 3.88 (8H, –CH2–), which are consistent with the hydrogen proton positions and numbers. The peak belonging to the OH− was absent from the spectrum of [Nbmd][OH], probably due to substitution by deuterium from D2O.
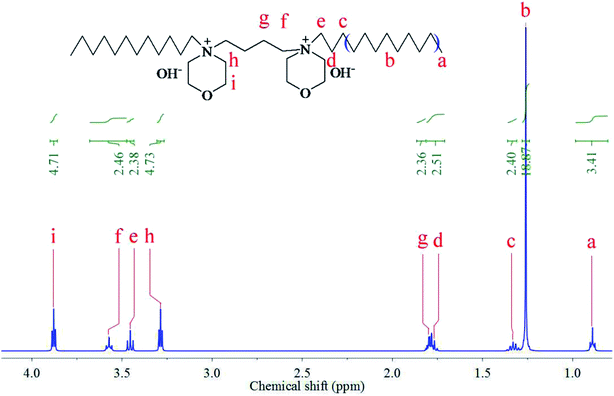 |
| | Fig. 1 1H NMR spectrum of the synthesized [Nbmd][OH]. | |
FT-IR was employed to study the chemical structure of the synthesized [Nbmd][OH] (Fig. 2), where the band at 3439 cm−1 is assigned to the stretching vibration of O–H28 caused by residual ethanol. The bands at 2925 cm−1 and 2856 cm−1 are attributed to the saturated C–H stretching vibration.29 The bands at 1479 cm−1 results from the –CH2 deformation vibration in alkane.30 The band at approximately 725 cm−1 indicates the presence of long-chain alkanes in [Nbmd][OH].20 The stretching vibration of C–N–C can be observed at 1061 cm−1, and the band at 1115 cm−1 originates from the C–O–C skeleton stretching vibration of the morpholine ring.31 As mentioned above, the test sample has both alkyl chains and morpholine rings, which is consistent with the predicted chemical structure of the synthesized [Nbmd][OH]. The cooperative analysis of FT-IR spectra and 1H NMR spectra proved that the [Nbmd][OH] was successfully synthesized.
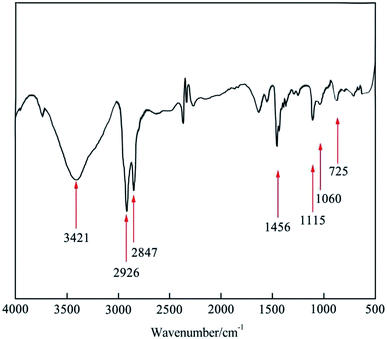 |
| | Fig. 2 FT-IR spectrum of the synthesized [Nbmd][OH]. | |
3.2 Alkalinity and solubility of [Nbmd][OH]
Different concentrations of [Nbmd][OH] at 25 °C. As seen in Table 1, the [Nbmd][OH] aqueous solution shows a weaker alkaline character than KOH aqueous solution at the same concentration. However, the alkaline intensity of [Nbmd][OH] aqueous solution could also meet the requirements for attracting OH−. In addition, for application in the anion exchange membranes of fuel cells, the problem of catalyst deactivation and CO2 deposition caused by the traditional alkali doping method can be avoided. Hence, the synthesized ionic liquid [Nbmd][OH] in this work has practical significance.
Table 1 pH values of different concentrations of [Nbmd][OH] aqueous solution and KOH aqueous solution at 25 °C
| Concentration/ mol L−1 |
pH value |
| [Nbmd][OH] solution |
KOH solution |
| 0.1 |
10.74 |
12.9 |
| 0.05 |
10.01 |
12.6 |
| 0.01 |
9.1 |
11.9 |
Table 2 lists the solubility of the synthesized [Nbmd][OH] in different solvents at 20 °C. As expected by the theory that similar substances can be dissolved easily in each other, the ionic liquids are soluble in strong polar solvents rather than nonpolar solvents. As shown in Table 2, the [Nbmd][OH] ionic liquids synthesized in this work have good solubility in common organic solvents, which may be due to the protonation of morpholine rings. This property is of great practical significance for the preparation of anion exchange membranes with different polymer matrices.
Table 2 Solubility of [Nbmd][OH] in different solventsa
| Solvent |
Solubility |
| +: Soluble; −: insoluble. |
| Water |
+ |
| Methanol |
+ |
| Ethanol |
+ |
| Glycerol |
− |
| Dichloromethane |
+ |
| Ether |
− |
| Ethyl acetate |
− |
3.3 Characterization of [Nbmd][OH]x–QCS (x = 10, 20, 30, 40) membranes by FT-IR
Fig. 3 presents the FT-IR spectra of CS, QCS and [Nbmd][OH]x–QCS (x = 10, 30), respectively. As shown in Fig. 3, broad bands at approximately 3439 cm−1 are observed for all the membrane samples, which are assigned to the vibration of both N–H and O–H as a result of overlap. The band at 1594 cm−1 for CS is due to the N–H bending vibration of the primary amino group; however, there is no distinct absorption associated with the N–H bending vibration of the primary amine at 1594 cm−1 for QCS-0%. Instead, a new band at approximately 1640 cm−1 was recorded for QCS-0%, revealing the transformation of the primary amine to a secondary amine due to the quaternary reactions at –NH2 sites on the chitosan chains.18 In addition, the increased absorptions at 2925 cm−1, 2856 cm−1 and 1479 cm−1 assigned to the C–H vibration and bending of the trimethylammonium group for QCS-X membranes also indicate the existence of quaternary ammonium groups in the QCS.30 The band at 1061 cm−1 corresponds to the C–O–C skeleton stretching vibration of the morpholine ring. In addition, a main band at 725 cm−1 attributed to a long-chain alkane can be observed in [Nbmd][OH]x–QCS (x = 10, 30) membranes, but no band appears in QCS, which indicates the presence of [Nbmd][OH] in the membranes. Moreover, during the preparation of the [Nbmd][OH]x–QCS membranes, increasing the content of [Nbmd][OH] resulted in increasingly large numbers of –CH2– in alkyl chains, which can be confirmed by the increased intensity of the 725 cm−1 band. The same structure of –CH2– in alkyl chains can also be proved by 1H NMR, as shown in Fig. 1 (chemical shift b).
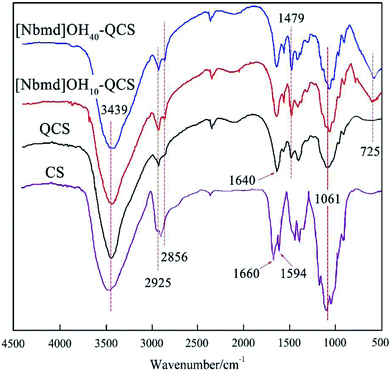 |
| | Fig. 3 FT-IR spectrum of the CS, QCS and [Nbmd][OH]x–QCS (x = 10, 30) membranes. | |
3.4 Membrane morphologies
SEM photographs of the surface and the cross-sectional views of the [Nbmd][OH]x–QCS membranes are shown in Fig. 4. For the first two membranes (A and B), the surfaces are clearly smooth, and both cross-sectional views show complete, compact structure and no obvious holes can be observed. The structures are compact due to the lower [Nbmd][OH] content. For the last two membranes (C and D), some dots are clearly visible on the surfaces due to the increased [Nbmd][OH] content, and the cross-sectional views are still compact, with no phase separation phenomena. The results indicate that QCS and [Nbmd][OH] are combined well with GA as the crosslinking reagent.
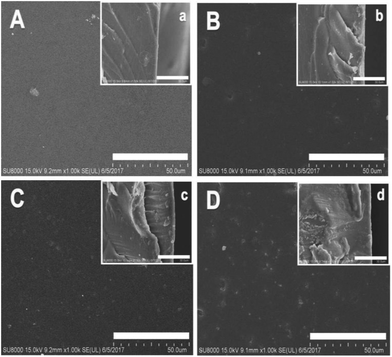 |
| | Fig. 4 Surface (A, B, C and D) and cross-sectional (a, b, c and d) SEM images of [Nbmd][OH]x–QCS membranes (x = 10, 20, 30, 40, respectively). | |
3.5 Mechanical properties of the [Nbmd][OH]x–QCS membranes
Stress–strain tests were used to determine the mechanical properties of the [Nbmd][OH]x–QCS membranes (x = 10, 20, 30, 40) with various concentrations of [Nbmd][OH], as well as commercial QCS, as shown in Fig. 5. The TS values are in the range of 14.39–9.12 MPa, and the Eb values (elongation at break) are in the range of 49.1–96.2%. It can be seen that the TS values tend to decrease as the [Nbmd][OH] content increases because a higher proportion of [Nbmd][OH] means a lower proportion of the QCS matrix, thus reducing the number of –NH2 groups available as crosslinking sites. This change would weaken the crosslinking effect, leading to a decrease in tensile strength. However, the Eb values show an increasing trend because the number of long alkyl chains increases with the increasing [Nbmd][OH] content, which improves the flexibility of the membranes. In addition, a larger number of hydrophilic quaternary ammonium groups in membrane means that more moisture is drawn into membrane, which will also lead to better flexibility of the membrane.
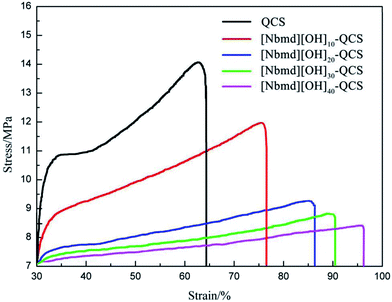 |
| | Fig. 5 Stress–strain curves of [Nbmd][OH]x–QCS membranes (x = 10, 20, 30, 40) at various concentrations of [Nbmd][OH], as well as commercial QCS. | |
We listed some membranes' mechanical properties reported in recent 5 years. As shown in Table 3, the prepared membranes in our work though show somewhat less tensile strength but with excellent elongation at break and they still have the potential to be used in fuel cells. At 80 °C, the tensile strength of the prepared membranes decreased slightly, which may be due to fact that the increasing temperature makes polymer chain activity more intensely, more likely to produce the intermolecular slippage or intermolecular pull phenomenon.
Table 3 Mechanical properties of the membranesa
| Membrane |
Tensile strength (MPa) |
Elongation at break (%) |
Ref. |
| All membranes were tested at room temperature. |
| TiO2/BC/CHPTAC-OH/PVA |
25.18 |
38.05 |
32 |
| M-20 |
12.5 |
5.1 |
33 |
| XE-Imds |
60.2 |
16.1 |
34 |
| QA-SEBS0.15 g-PEG0 |
15.5 |
250 |
35 |
| PSU-TMA-OH |
20(25 °C) |
11(25 °C) |
36 |
| PSU-DABCO-OH |
24(25 °C) |
5(25 °C) |
| PAES-5-IMPPO |
62 ± 5 |
22.8 ± 0.7 |
37 |
| PAES-15-IMPPO |
36 ± 5 |
8.2 ± 0.5 |
| MPAES-Q-2 |
6.9 |
6.3 |
38 |
| BIm-PPO-0.54 |
22.9 |
4.4 |
39 |
| B-g-Q-2 |
14.2 |
12.74 |
40 |
| I-QPES |
29.89 |
20.8 |
41 |
| [Nbmd][OH]10–QCS |
12(25 °C), 10.6(80 °C) |
76.7(25 °C), 110.2(80 °C) |
This work |
| [Nbmd][OH]20–QCS |
9.1(25 °C), 8.2(80 °C) |
86.3(25 °C), 132.5(80 °C) |
This work |
| [Nbmd][OH]30–QCS |
8.7(25 °C), 7.2(80 °C) |
90.8(25 °C), 135.0(80 °C) |
This work |
| [Nbmd][OH]40–QCS |
8.3(25 °C), 6.9(80 °C) |
96.5(25 °C), 156.8(80 °C) |
This work |
3.6 TGA curves of [Nbmd][OH]x–QCS membranes
Fuel cell performance generally improves at elevated temperature, and the range of 40–120 °C is of interest. Therefore, the thermal stability of the AEM is a key metric in forming ionic conducting ionomers for use in a fuel cell. Thermogravimetric analysis was carried out on the AEMs synthesized in this work to investigate their thermal stability. The TGA curves for QCS, [Nbmd][OH]x–QCS membranes (x = 10, 40) and [Nbmd][OH] ionic liquids are shown in Fig. 6. Clearly, the mass loss of the [Nbmd][OH] is much less than that of the neat QCS and [Nbmd][OH]x–QCS membranes (x = 10, 40) within the temperature range of 100–350 °C. It can be seen that [Nbmd][OH] starts degrading at approximately 300 °C, which shows excellent thermal stability, corresponding to the ring structure of morpholine.42 Neat QCS membrane and [Nbmd][OH]x–QCS membranes (x = 10, 40) all exhibit two degradation stages. The first stage (50–120 °C) is mainly attributed to the evaporation of moisture (mainly bonded water), and the second stage (240–300 °C) is due to the decomposition of the QCS backbone (mainly quaternary ammonium groups). As seen from the enlarged illustrations, the degradation temperature of the [Nbmd][OH]10–QCS membrane is 5 °C higher than that of the neat QCS membrane, and as the content of [Nbmd][OH] increases from 10–40%, the degradation temperature is increased by approximately 15 °C, which means that the thermal stability of the [Nbmd][OH]x–QCS membranes improves greatly when more [Nbmd][OH] is added. As the temperature exceeds 400 °C, the residual mass of all samples tends to be stable; moreover, the mass of the [Nbmd][OH]40–QCS membrane is 7% higher than that of the [Nbmd][OH]10–QCS membrane, which is due to the increased proportion of [Nbmd][OH].
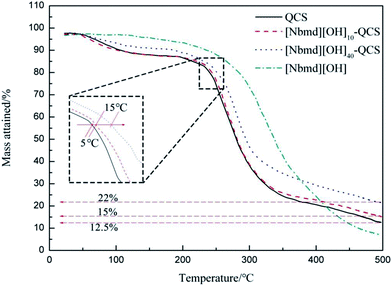 |
| | Fig. 6 TGA curves for pure QCS membrane, [Nbmd][OH]x–QCS membrane (x = 10, 40) and [Nbmd][OH]. | |
3.7 Dynamic swelling behavior of QCS and [Nbmd][OH]x–QCS membranes
The membrane swelling undergoes three stages, they are the diffusion of water molecules into the membrane structure and the relaxation of the polymer structure caused by the hydration and extension of macromolecule chains.43–45 All the membranes prepared in this research performed very fast water absorption, and they all reached swelling equilibrium within 10 min which can be seen in Fig. 7. This rapidity is due to the large amount of hydrophilic quaternary ammonium groups in the membrane structure. With increasing [Nbmd][OH] content, the swelling ratio of the composite membranes increases. This increase may be caused by the following two reasons: the number of quaternary ammonium groups is twice the number of [Nbmd][OH] molecules because each [Nbmd][OH] has two quaternary ammonium groups, which greatly increases the number of hydrophilic quaternary ammonium groups; and more [Nbmd][OH] means less QCS, resulting in a decreased number of amino groups as crosslinking sites. The decrease in the degree of crosslinking makes the structure of the composite membrane loose, which increases the space for holding water molecules.
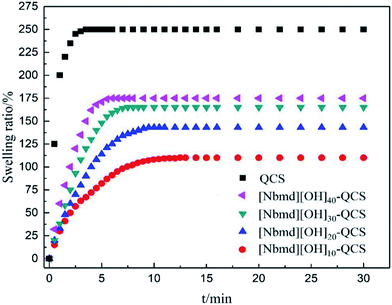 |
| | Fig. 7 Dynamic swelling behavior of QCS and [Nbmd][OH]x–QCS membranes (x = 10, 20, 30, 40) in de-ionized water at room temperature. | |
To better understand the swelling mechanism of the composite membranes in the process of water absorption, the swelling process of the composite membranes was fitted by the Schott second-order swelling kinetic equation as follows:46
| | |
t/Wt = 1/(KSW∞2) + t/W∞
| (7) |
where
Wt is the swelling ratio of the membrane after immersion time
t;
W∞ is the swelling ratio of the membrane after reaching swelling equilibrium; and
KS is the swelling rate constant, which is calculated from the slope (1/
W∞) and intercept (1/
KSW∞2) of the plots of the Schott second-order swelling kinetic equation.
The data obtained from the swelling process (see Fig. 10) were substituted into eqn (7). The reciprocal of the swelling rate (t/Wt) had a good linear relationship with the time (t) of the swelling process. The swelling kinetic parameters are listed in Table 4. As seen in Table 4, the experimental equilibrium swelling ratio and the theoretical equilibrium swelling ratio are close to each other, and the determination coefficients (R2) are all larger than 0.995, indicating that the swelling processes of the QCS and the series of composite membranes follow the Schott second-order swelling kinetics model. When the [Nbmd][OH] content increases from 10% to 30%, the swelling rate constant increases from 3.53 × 10⁻³ to 5.00 × 10⁻³ because more [Nbmd][OH] means less QCS, resulting in a decrease in the number of crosslinking sites (e.g., –OH, –NH2). In addition, the large steric hindrance of [Nbmd][OH] could also hinder the crosslinking effect, making the membrane structure relatively loose. These factors lead to the result that water molecules are more likely to diffuse into the relatively loose membrane structure, thus increasing the swelling rate constant. However, when the [Nbmd][OH] content continues to increase to 40%, the swelling rate constant is reduced, which may be related to the fact that a larger number of hydrophobic alkane tail chains causes excessive extrusion into the hydrophilic region, blocking the diffusion of water molecules and thus reducing the swelling rate constant. From another point of view, at a certain temperature, the composite membrane with higher [Nbmd][OH] content would have a stronger ability to hold moisture, which is beneficial for improving water retention at high temperature. In this work, the [Nbmd][OH]30–QCS membrane and the [Nbmd][OH]40–QCS membrane have the largest swelling rate constant and initial swelling rate, indicating that these two membranes are the most suitable for moisture absorption. It can also be seen in Fig. 7 and 8 that even though the QCS membrane has the largest swelling ratio and swelling rate constant, its excessive swelling ratio leads to poor mechanical properties that make it impractical for application in fuel cells.
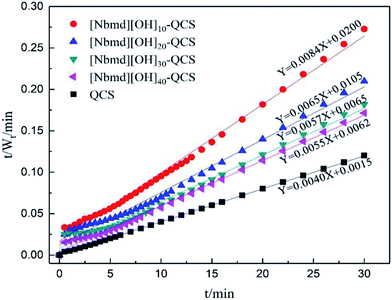 |
| | Fig. 8 Variation in the reciprocal rate of swelling t/Wt as a function of the swelling time for QCS and [Nbmd][OH]x–QCS membranes (x = 10, 20, 30, 40) in de-ionized water at room temperature. | |
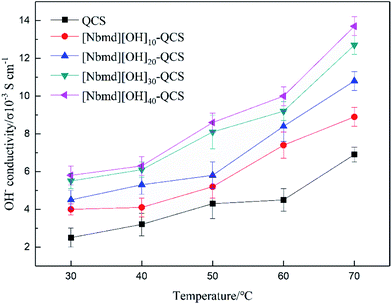 |
| | Fig. 9 OH− conductivity of QCS and [Nbmd][OH]x–QCS membranes (x = 10, 20, 30, 40). | |
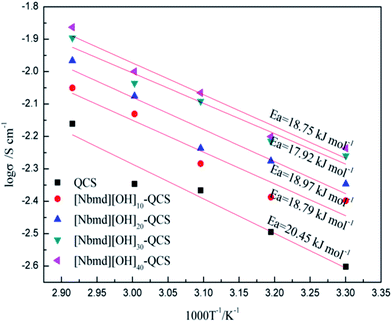 |
| | Fig. 10 Arrhenius plots for the QCS and [Nbmd][OH]x–QCS membranes (x = 10, 20, 30, 40). Ea: activation energy of the OH− transportation. | |
Table 4 Swelling kinetic parameters and water uptake of QCS and [Nbmd][OH]x–QCS membranes (x = 10, 20, 30, 40)
| Samples |
Wsa |
W∞b |
Ksc |
KsW∞2c |
R2 |
Water uptake/% |
| Experimental equilibrium swelling ratio (g water/g membrane). Theoretical equilibrium swelling ratio (g water/g membrane). (g water/g membrane)/min. |
| [Nbmd][OH]10–QCS |
110.00 |
119.05 |
3.53 × 10⁻³ |
50.00 |
0.9953 |
132.12 |
| [Nbmd][OH]20–QCS |
143.00 |
153.84 |
4.02 × 10⁻³ |
95.24 |
0.9934 |
223.55 |
| [Nbmd][OH]30–QCS |
165.00 |
175.43 |
5.00 × 10⁻³ |
153.85 |
0.9936 |
287.31 |
| [Nbmd][OH]40–QCS |
175.00 |
183.82 |
4.88 × 10⁻³ |
161.29 |
0.9976 |
336.50 |
| QCS |
250.00 |
250.00 |
1.07 × 10⁻² |
666.67 |
0.9999 |
462.33 |
3.8 Ionic conductivities of [Nbmd][OH]x–QCS membranes
The OH− conductivity of the membrane is of particular importance and plays a significant role in fuel cell performance. The OH− conductivity of QCS and [Nbmd][OH]x–QCS membranes (x = 10, 20, 30, 40), determined by means of an AC impedance method at different temperatures, is shown in Fig. 9. The following results were found. (1) The OH− conductivities of all the membranes range from 10−3 to 10−2 S cm−1, with the highest being 1.37 S cm−2 ([Nbmd][OH]40–QCS). (2) Under the same temperature conditions, the OH− conductivity increases with increasing [Nbmd][OH] content, which is because the higher [Nbmd][OH] content means more positively charged groups providing OH− active sites. (3) At the same [Nbmd][OH] content, all membranes show the same trend of positive correlation between the OH− conductivity and temperature. This correlation occurs because with increasing temperature, the structure of the membranes becomes relatively loose, resulting in widened run-through anion transport channels for OH− migration.47,48 Hence, the transport of OH− anions in membranes is easier at high temperature.
Table 5 lists several IEC values and OH− conductivities of anion exchange membranes reported in the literature, which are based on quaternary ammonium groups and imidazolium groups as cationic active sites. As seen in Table 5, the [Nbmd][OH]40–QCS membrane prepared in this work shows better conductivity than those in the literature. It should be noted that IEC is related to the amount of available exchangeable groups, which are actually carrier sites for OH−. The higher IEC value is the main factor causing [Nbmd][OH]40–QCS membrane to have a higher conductivity than the membranes in the literature.
Table 5 IEC values and OH− conductivities of the membranes in this work and in the literature
| Membrane |
Ionic group |
IEC (mmol g−1) |
Temp (°C) |
Conductivity (10−3 S cm−1) |
Ref. |
| QA refers to quaternary ammonium. QATMA refers to TMA-based quaternary ammonium. |
| [Nbmd][OH]40–QCS |
QAa |
1.93 |
30 |
5.8 |
This work |
| c6PAES-4IM-2.2 |
Imidazolium |
2.20 |
20 |
3.8 |
49 |
| c6PAES-NIM-1.9 |
Imidazolium |
1.8 |
20 |
2.1 |
49 |
| c6PAES-QA-2.0 |
QA |
1.9 |
20 |
1.6 |
49 |
| QPVA/5 wt%GA |
QA |
0.41 |
30 |
1.2 |
50 |
| CS/C4-QPSS-6 |
QA |
0.53 |
20 |
3.78 |
51 |
| QPAE |
QA |
0.87 |
20 |
5.6 |
52 |
| Quaternized poly (ether-imide) |
QA |
0.98 |
30 |
2.3 |
52 |
| Cardo polyetherketone |
QATMAb |
0.11 |
20 |
1.6 |
53 |
| Polystyrene (ethylenebutylenes) polystyrene |
QATEA |
0.57 |
30 |
0.69 |
54 |
Fig. 10 shows the relation between ln![[thin space (1/6-em)]](https://www.rsc.org/images/entities/char_2009.gif) σ and 1000/T−1. Assuming that the OH− conductivity follows the Arrhenius behavior, the ion transport activation energy Ea of the composite membranes can be obtained according to the Arrhenius equation:
σ and 1000/T−1. Assuming that the OH− conductivity follows the Arrhenius behavior, the ion transport activation energy Ea of the composite membranes can be obtained according to the Arrhenius equation:
where
b is the slope of the regression line of ln
![[thin space (1/6-em)]](https://www.rsc.org/images/entities/char_2009.gif) σ
σ (S cm
−1)
vs. 1000/
T−1 (K
−1) plots, and
R is the gas constant (8.314472 J K
−1 mol
−1). The results are presented in
Fig. 12.
 |
| | Fig. 11 σt/σ0 values of QCS and [Nbmd][OH]x–QCS membranes (x = 10, 20, 30, 40) as a function of time after immersion in N2-saturated 3 M KOH aqueous solution at 70 °C. | |
 |
| | Fig. 12 Polarization and power density curves of [Nbmd][OH]40–QCS membrane at 30 °C and 70 °C. | |
As seen in Fig. 10, the Ea values of the pure QCS and [Nbmd][OH]x–QCS membranes (x = 10, 20, 30, 40) increase with increasing [Nbmd][OH] content. It is possible that, on one hand, the increasing content of [Nbmd][OH] leads to an increased number of cationic active sites in the composite membrane, which could attract more OH−. On the other hand, the increased number of hydrophobic long carbon chains increases the degree of hydrophilic-hydrophobic phase separation,54–56 which provides convenient conditions for OH− migration, reducing the Ea values. In addition, the increased water uptake (Table 4) provides a better water environment for the OH− migration, which also contributes to the reduction in the Ea values. However, as the content of [Nbmd][OH] continues to increase, the Ea value tends to rise, which may be related to the fact that in a composite membrane with a high [Nbmd][OH] content, the long carbon chains of [Nbmd][OH] are more easily intertwined with each other, which would impede the migration of OH− and thus increase the Ea value.
3.9 Methanol permeability
In general, increases in the swelling ratio lead to greater methanol permeability because the relative relaxation of the membrane structure is conducive to the permeation of methanol molecules. However, in this work, as revealed in Table 6, with increasing [Nbmd][OH] content, the composite membrane shows a trend of an increase followed by a decrease in methanol permeability. The increase occurs because when the [Nbmd][OH] content is increased to 20%, the composite membrane structure becomes more relaxed and is easier for methanol to pass through. However, if the [Nbmd][OH] content is increased to 40%, the methanol permeation is reduced to 2.21 × 10³ S s cm−3, which is less than that of Nafion®115. This decrease may occur because, on one hand, a smaller proportion of QCS matrix leads to a limited swelling ratio; on the other hand, the increase in the number of hydrophobic alkane tail chains causes excessive extrusion into the hydrophilic region, resulting in narrow channels for methanol molecules to pass through.
Table 6 Properties of the [Nbmd][OH]x–QCS membranes (x = 10, 20, 30, 40)
| Membrane |
Thickness (μm) |
IEC (mmol g−1) |
OH− conductivity at 70 °C (10−2 S cm−1) |
Methanol permeation (10−6 cm−2 s−1) |
SPa (103 S s cm−3) |
| Theoretical |
Experimental |
| SP is the selectivity parameter (SP) of conductivity at 70 °C and methanol permeation at room temperature measured in this work. |
| QCS |
230 ± 5 |
1.36 |
1.17 |
0.69 |
3.68 |
1.9 |
| [Nbmd][OH]10–QCS |
236 ± 8 |
1.56 |
1.38 |
0.89 |
3.97 |
2.2 |
| [Nbmd][OH]20–QCS |
223 ± 5 |
1.75 |
1.54 |
1.08 |
3.43 |
3.1 |
| [Nbmd][OH]30–QCS |
232 ± 6 |
1.95 |
1.71 |
1.27 |
2.87 |
4.4 |
| [Nbmd][OH]40–QCS |
235 ± 5 |
2.14 |
1.93 |
1.38 |
2.21 |
6.2 |
| Nafion®115 |
125 |
0.89 − 0.95 |
|
2.8 |
2.42 |
11.6 |
Since the anion exchange membrane in DMFCs can be treated as a separator of OH− and methanol, in order to evaluate the efficiency of separating two components (OH− and methanol) by the composite membrane, selectivity57 is investigated as an index. If Fick's law and the Nernst–Plank equation are applied to describe the OH− flux and methanol flux, respectively, then the OH−/methanol selectivity parameter (SP) can be expressed in the form SP = σ/P, i.e., the ratio of OH− conductivity (σ) to methanol permeability (P). As can be seen in Table 6, all composite membranes show higher selectivity than the pure QCS membrane (SP = 1.9). The selectivity increases with increasing [Nbmd][OH] content, and the highest value of 6.2 × 10³ S s cm−3 was obtained for the [Nbmd][OH]40–QCS membrane. The improved selectivity should be attributed to the dual function of the synthesized [Nbmd][OH], where the hydrophilic quaternized ammonium groups facilitate anion conduction, and the hydrophobic alkane tail chains resist methanol crossover. The improved selectivity with increasing [Nbmd][OH] content clearly implied a promising application potential of the composite membranes for DMFC. However, both the selectivity and the methanol permeability of all the composite membranes are lower than those of Nafion®115. Therefore, further improvements of the AEMs are needed.
3.10 Alkaline stability of QCS/[Nbmd]OH membranes
The alkaline stability of AEMs is the key factor affecting the lifetime of fuel cells. It is highly desirable to develop an anion exchange membrane with both high OH− conductivity and excellent alkaline stability.
As Fig. 11 shows, with the extension of immersion time, the conductivities of all samples exhibit decreasing tendencies of different degrees. The conductivity of the QCS membrane decreased by 50% after 24 h of immersion, showing poor alkaline stability due to the degradation of quaternary ammonium groups by OH− attack (Hofmann elimination)58 and direct nucleophilic substitution.59,60 With increasing [Nbmd][OH] content, the alkaline stability of the composite membranes is improved. The [Nbmd][OH]40–QCS membrane exhibits the best alkaline stability, which is approximately 81% of the initial conductivity after immersion in 3 M KOH solution for 120 h at 70 °C. This high stability is because the decrease in QCS content leads to a lower number of quaternary ammonium groups grafted onto the QCS backbone and exposed directly to alkaline environment. However, the ionic liquid ([Nbmd][OH]) prepared in this experiment contains a morpholine ring, a group with high steric hindrance, which could protect the quaternary ammonium groups against OH− attack61,62 and thereby promote an acceptable alkaline stability.
3.11 Single-cell performance
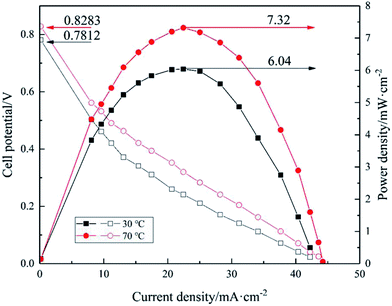
Fig. 12 shows the polarization and power density curves of [Nbmd][OH]40–QCS membrane with the highest OH− conductivity at 30 °C and 70 °C. 3.0 M ethanol combing 5.0 M KOH were used in the cell performance tests.
As can be seen from Fig. 12, the cell performance is improved with the increasing operating temperature. The open circuit potentials (OCPs) of single cell at 30 °C and 70 °C are 0.7812 V and 0.8283 V, respectively, and the peak power density is about 6.04 mW cm−2 at 30 °C, and it increases to about 7.32 mW cm−2 at 70 °C. The improvement of the cell performance caused by the elevating operating temperature is mainly due to the following two reasons. Firstly, higher temperature accelerates the electrochemical reaction rate, depresses negative effect of pH difference between anode and cathode in anion exchange membrane fuel cell. Secondly, a raised temperature also increase the OH− conductivity of the membrane, which can be seen from the measured OH− conductivity results of the [Nbmd][OH]40–QCS membrane in Fig. 9. However, the performance is still low at this stage, the performance of the fuel cell could be improved by further optimizing the electrode structure and lowering the resistance of the membranes. The poor chemical compatibility between the ionomer used (Nafion® ionomer) in the electrodes and the quaternary ammonium-type composite membrane is likely to be the cause of the poor performance observed. Chemical incompatibilities such as this can cause high contact resistances and poor MEA lamination. Another possible reason is the low Pt loading level of the anode and cathode (0.5 mg cm−2).
4 Conclusions
A new gemini basic morpholine ionic liquid ([Nbmd][OH]) was synthesized via a two-step procedure and applied to the preparation of [Nbmd][OH]x–QCS membranes due to its good thermal stability, strong polarity and alkalinity. The characterization results show that, with increasing [Nbmd][OH] content, increasing trends can be observed in water uptake, swelling ratio and thermal stability, while a slight decrease can be found in TS values. However, the methanol permeation of the composite membrane shows a trend of first increasing and then decreasing, with the lowest methanol permeation being 2.21 × 10³ S s cm−3, which is less than that of Nafion®115. The [Nbmd][OH]40–QCS membrane also possesses the highest OH− conductivity of all the prepared membranes, reaching 1.37 S cm−2 at 70 °C. Furthermore, the [Nbmd][OH]40–QCS membrane exhibits the best alkaline stability, which is approximately 81% of the initial conductivity after immersion in 3 M KOH solution for 120 h at 70 °C, indicating a promising application potential in direct methanol fuel cells.
Conflicts of interest
There are no conflicts to declare.
Acknowledgements
We gratefully acknowledge the Scientific Research Fund of Liaoning Provincial Education Department (L2013153), the Fundamental Research Funds for the Doctoral of Liaoning Provincial Natural Science Foundation (20141126), the Science and Technology Development Fund Project of Fushun City (20141115), and the Scientific Research Cultivation Fund of LSHU of China for their financial support.
References
- B. C. H. Steele&Amp and A. Heinzel, Nature, 2001, 345–352 Search PubMed.
- M. Z. Jacobson, W. G. Colella and D. M. Golden, Science, 2005, 308, 1901 CrossRef CAS PubMed.
- Y. J. Wang, J. Qiao, R. Baker and J. Zhang, Chem. Soc. Rev., 2013, 42, 5768–5787 RSC.
- O. Z. Sharaf and M. F. Orhan, Renewable Sustainable Energy Rev., 2014, 32, 810–853 CrossRef CAS.
- L. A. Neves, P. J. Sebastião, I. M. Coelhoso and J. G. Crespo, J. Phys. Chem. B, 2011, 115, 8713–8723 CrossRef CAS PubMed.
- L. Zhu, J. Pan, Y. Wang, J. Han, L. Zhuang and M. A. Hickner, Macromolecules, 2016, 49, 815–824 CrossRef CAS.
- J. Pan, J. Han, L. Zhu and M. A. Hickner, Chem. Mater., 2017, 29, 5321–5330 CrossRef CAS.
- L. Zhu, J. Pan, C. M. Christensen, B. Lin and M. A. Hickner, Macromolecules, 2016, 49 Search PubMed.
- H. Long and B. Pivovar, J. Phys. Chem. C, 2014, 118, 9880–9888 CAS.
- S. Chempath, J. M. Boncella, L. R. Pratt, N. Henson and B. S. Pivovar, J. Phys. Chem. C, 2010, 114, 11977–11983 CAS.
- J. R. Varcoe and R. C. T. Slade, Fuel Cells, 2005, 5, 187–200 CrossRef CAS.
- J. Yang, Q. Che, L. Zhou, R. He and R. F. Savinell, Electrochim. Acta, 2011, 56, 5940–5946 CrossRef CAS.
- C. Wang, B. Lin, G. Qiao, L. Wang, L. Zhu and F. Chu, Mater. Lett., 2016, 173, 219–222 CrossRef CAS.
- H. Zhu, R. Li, F. Wang, N. Chen, Z. Li and Z. Wang, J. Mater. Sci., 2017, 52, 11109–11119 CrossRef CAS.
- X. Zhu, B. Wang and H. Wang, Polym. Bull., 2010, 65, 719–730 CrossRef CAS.
- S. Yi, F. Zhang, L. Wei, H. Chi, H. Zhang and P. Mu, J. Membr. Sci., 2011, 366, 349–355 CrossRef CAS.
- R. A. Patil, M. Talebi, L. M. Sidisky and D. W. Armstrong, Chromatographia, 2017, 1–12 Search PubMed.
- G. Ding, W. Zhang, Z. Zhang, D. Guo, G. Tang and Y. Li, Anal. Bioanal. Chem., 2017, 1–12 CAS.
- A. S. Khan, Z. Man, A. Arvina, M. A. Bustam, A. Nasrullah and Z. Uiiah, J. Mol. Liq., 2017, 227, 98–105 CrossRef CAS.
- L. L. Wang, Y. Zhang, F. Zhang and R. Feng, Energy Sources, Part A, 2016, 38, 2770–2776 CrossRef CAS.
- Y. Wan, B. Peppley, K. A. M. Creber, V. T. Bui and E. Halliop, J. Power Sources, 2008, 185, 183–187 CrossRef CAS.
- J. L. Wang and R. H. He, Solid State Ionics, 2015, 278, 49–57 CrossRef CAS.
- R. He, Q. Li, A. Bach, J. O. Jensen and N. J. Bjerrum, J. Membr. Sci., 2006, 277, 38–45 CrossRef CAS.
- C. Yang, S. Wang, W. Ma, L. Jiang and G. Sun, J. Mater. Chem. A, 2015, 3, 8559–8565 CAS.
- C. Klaysom, R. Marschall, S. H. Moon, B. P. Ladewig and G. Q. M. Lu, J. Mater. Chem., 2011, 21, 7401–7409 RSC.
- M. R. Hibbs, M. A. Hickner, T. M. Alam, S. K. Mcintyre and C. H. Fujimoto, Chem. Mater., 2008, 20, 2566–2573 CrossRef CAS.
- J. Parrondo, M. S. J. Jung, Z. Wang, C. G. Arges and V. Ramani, J. Electrochem. Soc., 2015, 162, F1236–F1242 CrossRef CAS.
- Y. Wu, C. Wu, T. Xu, F. Yu and Y. Fu, J. Membr. Sci., 2008, 321, 299–308 CrossRef CAS.
- D. Z. Liu, X. X. Hou, X. L. Zhu, R. Wang, J. Jing and Y. Cui, Acta Phys.-Chim. Sin., 2013, 29, 2573–2578 CAS.
- Y. Wan, B. Peppley, K. A. M. Creber and V. T. Bui, J. Power Sources, 2010, 195, 3785–3793 CrossRef CAS.
- Y. Li, E. Wang, S. Wang, Y. Lu, C. Hu and N. Hu, J. Mol. Struct., 2002, 607, 133–141 CrossRef CAS.
- A. Them, J. Nanotechno., 2017, 2017, 1–10 Search PubMed.
- Y. F. Wang, H. T. Wan, J. L. Wang, L. L. Wang and R. J. Feng, J. Electrochem. Soc., 2017, 164, F1051–F1062 CrossRef CAS.
- H. L. Kang, D. H. Cho, Y. M. Kim, J. M. Sun and J. G. Seong, Energy Environ. Sci., 2016, 10, 275–285 Search PubMed.
- C. Yang, S. Wang, W. Ma, S. Zhao and Z. Xu, J. Mater. Chem. A, 2016, 4, 3886–3892 CAS.
- R. Narducci, J. Chailan, A. Fahs, L. Pasquini and M. L. D. Vona, J. Polym. Sci., Part B: Polym. Phys., 2016, 54, 1180–1187 CrossRef CAS.
- C. X. Lin, Y. Z. Zhuo, A. N. Lai, Q. G. Zhang and A. M. Zhu, J. Membr. Sci., 2016, 513, 206–216 CrossRef CAS.
- X. Lin, X. Liang, S. D. Poynton, J. R. Varcoe, L. O. Ai and J. Ran, J. Membr. Sci., 2013, 443, 193–200 CrossRef CAS.
- X. Li, G. Nie, J. Tao, W. Wu, L. Wang and S. Liao, ACS Appl. Mater. Interfaces, 2014, 6, 7585 CAS.
- J. Ran, L. Wu and T. Xu, Polym. Chem., 2013, 4, 4612–4620 RSC.
- P. Y. Xu, K. Zhou, G. L. Han, Q. G. Zhang, A. M. Zhu and Q. L. Liu, ACS Appl. Mater. Interfaces, 2014, 6, 6776 CAS.
- L. L. Wang, J. L. Wang and R. J. Feng, J. Fuel Chem. Technol., 2015, 43, 59–64 CAS.
- B. Kim, K. L. Flamme and N. A. Peppas, J. Appl. Polym. Sci., 2010, 89, 1606–1613 CrossRef.
- Q. Duan, S. Ge and C. Y. Wang, J. Power Sources, 2013, 243, 773–778 CrossRef CAS.
- D. J. Enscor, H. B. Hopfenber, V. T. Stannett and A. R. Berens, Polymer, 1977, 18, 1105–1110 CrossRef.
- E. Díezpeña, I. Quijadagarrido and J. M. Barralesrienda, Macromolecules, 2003, 36, 2475–2483 CrossRef.
- Y. Xiong, Q. L. Liu, Q. G. Zhang and A. M. Zhu, J. Power Sources, 2008, 183, 447–453 CrossRef CAS.
- E. A. Weiber and P. Jannasch, J. Membr. Sci., 2016, 520, 425–433 CrossRef CAS.
- C. C. Yang, S. S. Chiu and S. C. Kuo, J. Power Sources, 2012, 199, 37–45 CrossRef CAS.
- H. Zhang, B. Shi, R. Ding, H. Chen, J. Wang and J. Liu, Ind. Eng. Chem. Res., 2016, 55, 9064–9076 CrossRef CAS.
- X. Li, Q. Liu, Y. Yu and Y. Meng, J. Mater. Chem. A, 2013, 1, 4324–4335 CAS.
- Q. H. Zeng, Q. L. Liu and I. Broadwell, J. Membr. Sci., 2010, 349, 237–243 CrossRef CAS.
- J. Wang, S. Li and S. Zhang, Macromolecules, 2010, 43, 3890–3896 CrossRef CAS.
- X. Wu, W. Chen, X. Yan, G. He, J. Wang and Y. Zhang, J. Mater. Chem. A, 2014, 2, 12222–12231 CAS.
- X. Yan, S. Gu, G. He, X. Wu and J. Benziger, J. Power Sources, 2014, 250, 90–97 CrossRef CAS.
- J. J. Han, Q. Liu, X. Q. Li, J. Pan, L. Wei, Y. Wu, H. Q. Peng, Y. Wang, G. W. Li, C. Chen, L. Xiao, J. T. Lu and L. Zhuang, ACS Appl. Mater. Interfaces, 2015, 7, 2809–2816 CAS.
- B. Libby, W. H. Smyrl and E. L. Cussler, AIChE J., 2003, 49, 991–1001 CrossRef CAS.
- Y. S. Ye and Y. A. Elabd, Macromolecules, 2011, 44, 8494–8503 CrossRef CAS.
- C. S. Macomber, J. M. Boncella, B. S. Pivovar and J. A. Rau, J. Therm. Anal. Calorim., 2008, 93, 225–229 CrossRef CAS.
- S. Chempath, B. R. Einsla, L. R. Pratt, C. S. Macomber, J. M. Boncella, J. A. Rau and B. S. Pivovar, J. Phys. Chem. C, 2008, 112, 3179–3182 CAS.
- S. Gu, R. Cai, T. Luo, Z. W. Chen, M. W. Sun, Y. Liu, G. H. He and Y. S. Yan, Angew. Chem., Int. Ed., 2009, 48, 6499 CrossRef CAS PubMed.
- K. J. Noonan, K. M. Hugar, H. A. Kostalik, E. B. Lobkovsky, H. D. Abruña and G. W. Coates, J. Am. Chem. Soc., 2012, 134, 18161–18164 CrossRef CAS PubMed.
|
| This journal is © The Royal Society of Chemistry 2018 |
Click here to see how this site uses Cookies. View our privacy policy here.  Open Access Article
 * and
Lulu Wang
![[thin space (1/6-em)]](https://www.rsc.org/images/entities/char_2009.gif) :
:![[thin space (1/6-em)]](https://www.rsc.org/images/entities/char_2009.gif) nN-methyl morpholine
nN-methyl morpholine![[thin space (1/6-em)]](https://www.rsc.org/images/entities/char_2009.gif) :
:![[thin space (1/6-em)]](https://www.rsc.org/images/entities/char_2009.gif) nNaOH
nNaOH![[thin space (1/6-em)]](https://www.rsc.org/images/entities/char_2009.gif) :
:![[thin space (1/6-em)]](https://www.rsc.org/images/entities/char_2009.gif) nwater = 1
nwater = 1![[thin space (1/6-em)]](https://www.rsc.org/images/entities/char_2009.gif) :
:![[thin space (1/6-em)]](https://www.rsc.org/images/entities/char_2009.gif) 1.2
1.2![[thin space (1/6-em)]](https://www.rsc.org/images/entities/char_2009.gif) :
:![[thin space (1/6-em)]](https://www.rsc.org/images/entities/char_2009.gif) 1.5
1.5![[thin space (1/6-em)]](https://www.rsc.org/images/entities/char_2009.gif) :
:![[thin space (1/6-em)]](https://www.rsc.org/images/entities/char_2009.gif) 5). (2) A given amount of dodecyl morpholine obtained from step (1) was placed in a dry round-bottomed flask, and then 1,4-dibromobutane was added under magnetic stirring for 7 h at 110 °C. The resulting yellow sticky liquid was dried at 50 °C under high vacuum for 24 h. After drying, an amount of the remaining powder (bromododecyl morpholine) and KOH were placed in an Erlenmeyer flask at a molar ratio of 1
5). (2) A given amount of dodecyl morpholine obtained from step (1) was placed in a dry round-bottomed flask, and then 1,4-dibromobutane was added under magnetic stirring for 7 h at 110 °C. The resulting yellow sticky liquid was dried at 50 °C under high vacuum for 24 h. After drying, an amount of the remaining powder (bromododecyl morpholine) and KOH were placed in an Erlenmeyer flask at a molar ratio of 1![[thin space (1/6-em)]](https://www.rsc.org/images/entities/char_2009.gif) :
:![[thin space (1/6-em)]](https://www.rsc.org/images/entities/char_2009.gif) 2 (nbromododecyl morpholine
2 (nbromododecyl morpholine![[thin space (1/6-em)]](https://www.rsc.org/images/entities/char_2009.gif) :
:![[thin space (1/6-em)]](https://www.rsc.org/images/entities/char_2009.gif) nKOH), and then 30 mL of anhydrous ethanol was added until the powder was completely dissolved, and the mixture was stirred for 48 h at room temperature to allow adequate ion exchange to proceed. After that time, KBr as a white solid was separated with a centrifugal separator from the liquid mixture, the solvent ethanol was removed from the remaining liquid by vacuum distillation, and then the resulting liquid was further dried at 80 °C under high vacuum for 48 h to obtained the synthesized dual-core basic ionic liquids, which were termed [Nbmd][OH]. The preparation of gemini basic ILs is schematically illustrated in Scheme 1.
nKOH), and then 30 mL of anhydrous ethanol was added until the powder was completely dissolved, and the mixture was stirred for 48 h at room temperature to allow adequate ion exchange to proceed. After that time, KBr as a white solid was separated with a centrifugal separator from the liquid mixture, the solvent ethanol was removed from the remaining liquid by vacuum distillation, and then the resulting liquid was further dried at 80 °C under high vacuum for 48 h to obtained the synthesized dual-core basic ionic liquids, which were termed [Nbmd][OH]. The preparation of gemini basic ILs is schematically illustrated in Scheme 1.


![[thin space (1/6-em)]](https://www.rsc.org/images/entities/char_2009.gif) σ and 1000/T−1. Assuming that the OH− conductivity follows the Arrhenius behavior, the ion transport activation energy Ea of the composite membranes can be obtained according to the Arrhenius equation:
σ and 1000/T−1. Assuming that the OH− conductivity follows the Arrhenius behavior, the ion transport activation energy Ea of the composite membranes can be obtained according to the Arrhenius equation:![[thin space (1/6-em)]](https://www.rsc.org/images/entities/char_2009.gif) σ (S cm−1) vs. 1000/T−1 (K−1) plots, and R is the gas constant (8.314472 J K−1 mol−1). The results are presented in Fig. 12.
σ (S cm−1) vs. 1000/T−1 (K−1) plots, and R is the gas constant (8.314472 J K−1 mol−1). The results are presented in Fig. 12.


