DOI:
10.1039/C8RA00572A
(Paper)
RSC Adv., 2018,
8, 14401-14413
A combined molecular dynamics simulation and experimental method to study the compatibility between elastomers and resins
Received
19th January 2018
, Accepted 2nd April 2018
First published on 17th April 2018
Abstract
C5 and C9 petroleum resins are widely used in the rubber industry and their softening, tackifying and reinforcing effects highly depend on their compatibility and interaction strength with the rubber matrix. Herein, we chose five commercially used petroleum resins and two industrial solution polymerized styrene-butadiene rubbers (SSBR). By employing atomistic molecular dynamics (MD) simulation, the influence of resin composition on the compatibility was studied. Results show that different compatibility orders obtained from the solubility parameter (δ), binding energy (Ebinding), mean square displacement (MSD), and the related self-diffusion coefficient (Ds) match well with each other, and are consistent with our experimental solubility parameter data. More importantly, by calculating the non-bond energy (Enon-bond) between single resin chain and rubber units (styrene unit, trans-1,4 unit, cis-1,4 unit, and vinyl unit), it was found that the styrene unit has the strongest interaction with resins, while the cis-1,4 unit has the weakest, which fits well with the solubility parameter result that resins have better compatibility with SSBR than cis-polybutadiene rubber (cis-BR). This chain/unit level MD method saves much time compared to the traditional chain/chain level method. In general, by combining MD simulation and experiments, our work provides some guidance to a compatibility investigation between rubbers and resins, and may promote design and development of high-performance resins and other new materials.
1. Introduction
C5 and C9 fractions are by-products of ethylene production. C5 petroleum resin is a thermoplastic resin based on the C5 fraction as raw materials after pretreatment and polymerization. Similarity, C9 petroleum resin is the polymerized product of C9 raw materials. Both are oligomers with molecular weights ranging from 300 to 3000 and they usually exhibit a glassy state at room temperature. These petroleum resins are widely used in adhesives, hot-melt coatings, printing inks, paint, flooring, road marking, polymers, and other applications. Due to a favorable compatibility between petroleum resins and elastomers, they are commonly regarded as tackifying resins and added to elastomers to improve surface bonding strength. Besides, C9 petroleum resin also has a reinforcement effect to vulcanized rubber which derives from the rigid aromatic rings and the thermal activity of double bonds.
Although there has been an increasing application of petroleum resins in rubbers, few studies have been performed to investigate the effect these resins have on rubber composites, such as a reinforcement mechanism, damping properties, and compatibility performance. Some researches point out that the addition of resin retards vulcanization, and reduces the crosslink density and Mooney viscosity of vulcanizates.1 And if the petroleum resin exhibits a better miscibility with rubber matrix, then the motion of rubber chains will be confined and hence the damping peak moves to higher temperature and the effective damping temperature range is broadened too. In addition, this miscibility or compatibility must be influenced by the chain structures of rubber and resin chains.2,3 Therefore, in order to have an insight into structural influence on compatibility, we chose five commonly used petroleum resins and two industrial rubbers to find the most suitable resin for one specific rubber.
When it comes to compatibility judgment, solubility parameter comparison is always considered to be an effective and reliable alternative. However, experimental methods used to test the solubility parameters of rubbers and resins are always time-consuming and the test results are strongly influenced by the chosen solvents. Fortunately, with developments in computer technology, computational molecular dynamics simulation gives an accurate and trustworthy access to study their microscopic properties, including solubility, of a wide range of materials. And these microscopic properties can be used to explain and predict the macroscopic properties of real materials. Molecular dynamics simulation includes three precision levels: a coarse-grained model, united atom model, and atomistic model. Here we chose Materials Studio software with the most accurate atomistic model to calculate the corresponding properties of our rubbers, resins, and their composites.
During the past few years, Materials Studio has been widely used in the polymer materials field and many atomistic molecular dynamics simulations have been carried out to study cross-linked epoxy resin systems and nanoparticle filled rubber composites. There are four aspects that researchers mainly focus on: mechanical properties and thermal properties of a polymer, diffusion behavior of gas in a polymer matrix, and compatibility between blend components. Apart from those studies, previous researchers used one structure parameter, radial distribution function (RDF), to characterize a great many properties and the obtained findings are satisfying.4–6 In addition, Materials Studio can perform some quantum-mechanical simulations, which contributes greatly to the judgment of reactivity between different reactants.
The most commonly used method to simulate the Young's modulus E, bulk modulus B, shear modulus G, and Poisson ratio υ of polymers is to first apply a small strain to the simulation cell, then carry out enough minimization, and finally with the obtained stress and strain tensors, these four mechanical parameters can be calculated. Another approach to investigate the shear properties is to perform a pull-out process and by recording the force distribution, interfacial shear stress, and deformation morphology, the interfacial interaction can also be easily studied. One thing that needs to be clarified is that the simulated mechanical properties have not yet been quantitatively compared with experimental results, which means that these mechanical parameters can only be used to qualitatively decide the most optimum results within simulative systems.6–10
As for thermal properties, glass transition temperature Tg, volume thermal expansion coefficient α, and linear thermal expansion coefficients β, are the three parameters that usually are simulated. The simulation results always show great consistency with experimental ones.6,11 Here, we indicate that nearly all atomistic molecular simulations mentioned above were carried out by Materials Studio on account of the fact that precise atomistic force field parameters are difficult to find and using other software to compute all-atom systems will require much more time and effort. Joshua D. Monk et al. explored a novel approach to generate atomistic models of cross-linked phenolic resin with LAMMPS (large scale atomic molecular massively parallel simulator) software and the resulting glass transition temperature, thermal conductivity, coefficient of thermal expansion, and elastic modulus are in good agreement with experimental values.12 By using multi-scale simulations with LAMMPS software, Gokhan Kacar et al. found similar results.13 According to previous studies, there are two methods to get the glass transition temperatures of polymers: one is to find the turning point of a volume (V)–temperature (T) curve (free volume fraction (FFV)–T curve or density (ρ)–T curve are the same); the other is by fitting the non-bond energy (Enon-bond)–T curve. The Tg results obtained from both means fit well with the experimental data.7,14,15 From the elaboration above, we found that different from mechanical properties, thermal properties calculated from the simulation are well in line with experimental ones.
Diffusion behavior of small molecules in polymer matrixes is always utilized to study the following properties: gas permeability of polymers (gas diffusion), compatibility between polymers and small molecules (antiagers, plasticizers, and the like) and permeation performance of specific elementides (water and proton in proton exchange membrane) in a specific matrix. The diffusion coefficients D of small molecules can be calculated from the mean square distance (MSD)–time curve. Results show that although the FFVs among different polymers vary, permeability for small gases molecules in these polymers is similar while the permeability for large gas molecules diversifies. Therefore, the probe radius Rp used to simulate FFV should be comparable with the molecular size. Besides, it is found that small molecules transfer or move in amorphous regions between spherical crystals with a “hopping diffusion” behavior. And the predicted diffusion coefficients from simulation agree well with the variation trend of experimental data.16–20
There are three essential issues that are concerned with compatibility studies: the solubility of materials in different solvents, the compatibility between polymers, and the compatibility between polymer matrixes and fillers. Those fillers can be plasticizers, reinforcing agents, antiagers, and other functional additives and there is no denying that the compatibility between polymers and those fillers will strongly effect the properties of the composites. One of the most commonly used approaches of compatibility judgment is to calculate the cohesive energy density (CED) and then obtain the solubility parameter (δ) of one component or the Flory–Huggins parameter (χ) between two components. Also, it is widely believed that the smaller the difference between two solubility parameters is and the smaller the Flory–Huggins parameter is, the better the compatibility of the two components will be.21–24 From the perspective of energy, binding energy (Ebinding = E1 + E2 − Etotal), interaction energy (ΔE = −Ebinding), and interfacial interaction energy per unit area (γ = −ΔE/S) are regarded as the parameters of compatibility judgment. And the smaller the absolute values of Ebinding, ΔE, and γ are, the more compatibility there is between the components.25–27 Besides, simulation snapshots, cross-sectional structures, and concentration distribution curves can also help to study the compatibility.26,28 Except for studying compatibility alone, some research areas containing comprehensive studies of both macroscopic properties and microcosmic mechanism combining simulations and experiments with polymer composites, have been thoroughly studied. Xiuying Zhao et al. carried out a series of studies on the damping properties of hindered phenol (AO-60, AO-70, or AO-80)/nitrile-butadiene rubber composites. Both molecular dynamics simulations and experimental methods were applied to investigate the types and quantities of hydrogen bonds and the results found that the system with the largest number of hydrogen bonds exhibited the highest Ebinding and smallest FFV, thus demonstrating the best compatibility between NBR and a hindered phenol and the best damping property of the composites.25,29–31 A similar approach also was used to investigate silica/modified solution-polymerized styrene butadiene rubber (SSBR) composites and graphene/SSBR composites, and the modelling results were in good agreement with experimental dataones.32,33
From the above description, we know that using atomistic molecular dynamics simulation to predict thermal properties of polymers and compatibility between components is reliable; that is, the simulation results can be used to guide real material design. Therefore, in our study, with the aim of finding the most compatible petroleum resin for SSBR, we built models of five commercially used petroleum resins with different chemical compositions and two industrial rubbers and calculated their solubility parameters. To valid the truthfulness of our simulative results, solubility parameter testing experiments for resins and rubbers also were performed, and the final compatibility trends match well. Next, to further clarify which repeating units on rubber chains have stronger interaction with resins, we found the elementary units that make up the two rubber chains and then built a serious of systems that contain a single resin chain and different rubber units. The non-bonded interactions (Enon-bond) of these systems were further analyzed. It should be mentioned that, although using solubility parameters from simulations to judge compatibility is very common, nearly all systems previously studied only focused on one specific composition and the variable was either the filling content of one component or the modified fraction of another. Different from those previous studies, we chose five different resins with different structures and investigated their compatibility with different rubbers. Besides, we divided the simulation into two levels: a chain/unit level and a chain/chain level; and the results from those levels fit well. This may contribute to accelerating the development of new materials. Finally, the Ebinding of a hybrid system and MSD of rubber chain also were simulated and the trends of those two properties were in line with the compatibility results.
2. Experimental and simulative methods
2.1. Material and sample preparation
4526 oil sucked SSBR was purchased from Lanxess Chemical Co., Ltd. SE0212 functionalized SSBR and 2#-poly(α-methyl styrene-co-styrene) resin were provided by Red Avenue New Materials Group. And the remaining four petroleum resins, 1#-coumarone resin-1, 3#-C5/C9 copolymerized petroleum resin, 4#-coumarone resin-2, and 5#-C9 petroleum resin, were commercially available. The composition of the two rubbers, the molecular weights of resins, and the chain structures of resin repeating units are shown in Tables 1, 2, and Fig. 1, respectively.
Table 1 Chain composition of two rubbers
| Rubber |
Chain composition/wt% |
| F-SSBR(SE0212) |
St/cis-1,4/trans-1,4/ethenyl = 25/9/9/57 |
| Oil sucked SSBR(Lanxess 4526) |
St/cis-1,4/trans-1,4/ethenyl = 26/14.5/14.5/45 |
Table 2 Number average molecular weight (Mn) of five resins
| Number |
Resin |
Mn/(g mol−1) |
| 1# |
Coumarone resin-1 |
1452 |
| 2# |
Poly(α-methyl styrene-co-styrene) resin |
2098 |
| 3# |
C5/C9 copolymerized petroleum resin |
1479 |
| 4# |
Coumarone resin-2 |
1800 |
| 5# |
C9 petroleum resin |
1236 |
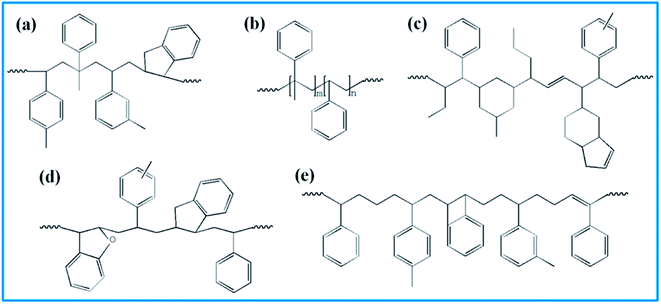 |
| | Fig. 1 Repeating units' structure of five resins. (a) 1# resin, (b) 2# resin, (c) 3# resin, (d) 4# resin, and (e) 5# resin. | |
The rubber compounds were prepared according to the following procedures: (1) the rubber matrix was first plasticized on a Ø152.4 mm two-roll mill at room temperature for 100 s (200 s for NR), and after that, sulfur, accelerant N-tert-butylbenzothiazole-2-sulphenamide (NS) and tetramethylthiuram disulfide (TMTD) were added (the mixing formula is shown in Table 3). These mixtures were then kneaded for a certain time to create homogeneous rubber blends. (2) Next, these rubber mixtures were vulcanized to form cross-linked hybrids at an appropriate temperature (160 °C) under a pressure of 15 MPa and then cooled naturally to room temperature. (3) Afterwards, two vulcanites were cut into small pieces with a mass of around 0.800–1.000 g and a thickness of 2 mm and used as swelling samples. Resins were dissolved into a series of solvents to form testing solutions with concentrations of 0.050 g cm−3.
Table 3 Mixing formula for rubbersa
| Component |
F-SSBR mixing/phr |
Oil sucked SSBR mixing/phr |
| In order to eliminate the effect of other components, the formula only contains the essential constituents used to achieve vulcanization. |
| F-SSBR |
100 |
— |
| Oil sucked SSBR |
— |
100 |
| Sulphur |
2.3 |
2.3 |
| Accelerant NS |
1.8 |
1.8 |
| Accelerant TMTD |
0.3 |
0.3 |
2.2. Solubility parameter testing methods for rubbers and resins
In our study, equilibrium swelling and intrinsic viscosity methods were used to measure the solubility parameter (δ) for rubbers and resins, respectively. Due to different molecular compositions of various solvents, the compatibility between polymer chains and solvents will differ, thus causing different degrees of expansion for cross-linked polymers. Based on this theory, the higher the equilibrium swelling mass ratio (Qm) is, the more closely the solubility parameter of a polymer is to that of the solvent. Therefore, by testing Qm of one specific rubber in a series of well-defined solvents and fitting the Qm–δ curve, the obtained peak value can be regarded as the solubility parameter of this rubber. In the process, rubber samples were immersed into various solvents until they swelled to a constant mass  . If the initial mass of rubber sample is mp, the Qm can be easily calculated as follows:
| |
 | (1) |
Similar to swelling, when dissolved in different solvents, polymer chains will extend more fully in good solvents, leading to a higher intrinsic viscosity ([η]), which can be measured by using an Ubbelohde viscometer. There are two typical equations describing the relationship between intrinsic viscosity and the concentration of solution (c); one is the Huggins equation, the other is the Kraemer equation:
| |
 | (2) |
| |
 | (3) |
where
ηsp,
ηr,
k′, and
β stand for specific viscosity, relative viscosity, Huggins parameter, and Kraemer parameter, respectively. For one specific polymer, at a certain temperature and a determined concentration, both
k′ and
β are constants. Therefore, the

curve and

will achieve the same intercept, which exactly indicates the [
η]. The one-point equation can also be deduced as follows:
| |
 | (4) |
In our experiments, by comparing the solubility parameters of 5#-resin tested with both the graphical extrapolated method and the one-point method, we found that there is only 0.25% relative error between these two results. Hence, the one-point method was chosen.
2.3. Simulation force field
Molecular dynamics simulations were performed using the Materials Studio 8.0 (Accelrys, San Diego, CA). All the calculations were performed using the COMPASS (Condensed-Phase Optimized Molecular Potentials for Atomistic Simulation Studies) force field throughout the molecular dynamics simulation process. COMPASS is the first ab initio calculation force field which contains most of the elements in the periodic table as well as the different valence states of those elements.34,35
In COMPASS, the total energy (ET) of the simulation system is represented by the summation of bonding and non-bonding interactions:
| | |
ET = Eb + Eθ + EØ + Eχ + Ecross + Evdw + Eele
| (5) |
where the first five items represent the bonding interactions, which correspond to the energies associated with the bond energy
Eb, bond angle bending energy
Eθ, torsion angle rotation energy
EØ, out-of-plane energy
Eχ, and cross-term interaction energy
Ecross. The last two items are the non-bond interactions, including the van der Waals force energy
Evdw and electrostatic force energy
Eele.
2.4. Construction process of simulation cells
Fig. 2 shows the construction process of the F-SSBR/2# resin hybrid cell. The F-SSBR polymer chains and 2#-resin molecules were first built in a 3D cubic cell with periodic boundary conditions. Then, the cell was annealed from 200 to 400 K for 500 ps with a pressure of 1 × 10⁻⁴ GPa to eliminate internal stress by using the Forcite module. The cell was then geometrically optimized using the smart method (including steepest descent, conjugate gradient, and the Newton method) at 298 K for more than 1 × 10⁵ steps until a convergent value was reached. Finally, a NPT (constant number of particles, pressure, and temperature) equilibrium of 2000 ps was implemented successively at 298 K.
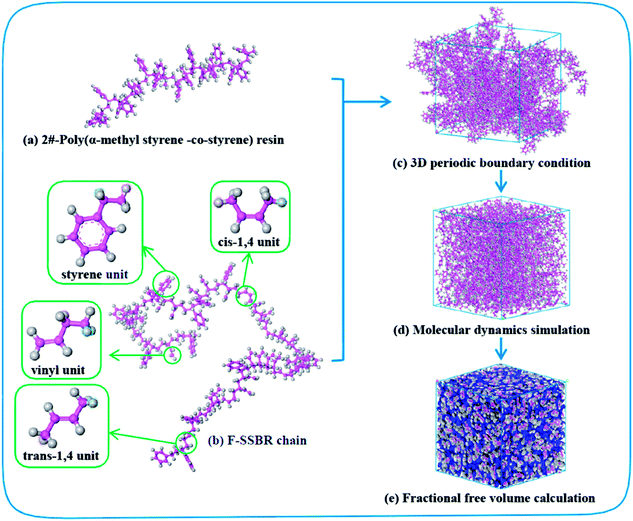 |
| | Fig. 2 Construction process of the F-SSBR/2# resin cell. Pink and gray atoms stand for carbon and hydrogen, respectively. | |
Two criteria are applied to determine the equilibrium of the system: (1) the density of the system changes at approximately the average value for a long time without major fluctuations, and (2) the energy of the system keeps a minute fluctuation at approximately the average value.36 From Fig. 3, we can conclude that our system has reached an equilibrium state.
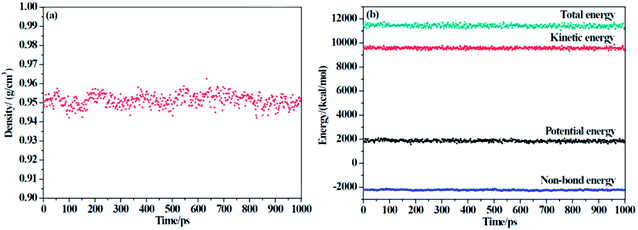 |
| | Fig. 3 The (a) density and (b) energy of F-SSBR/2# resin system versus simulation time (the last 1000 ps in NPT equilibrium). | |
3. Results and discussions
3.1. Experimental solubility parameter testing
The solvents used in solubility parameter testing experiments and the corresponding Hansen three-dimensional solubility parameters are listed in Table 4.
Table 4 Hansen three-dimensional solubility parameters of different solvents using for solubility parameter test
| Solvent |
δ/(J cm−3)1/2 |
δD/(J cm−3)1/2 |
δP/(J cm−3)1/2 |
δH/(J cm−3)1/2 |
| n-Hexane |
14.90 |
14.90 |
0.00 |
0.00 |
| MTBE |
16.20 |
14.80 |
4.30 |
5.00 |
| Cyclohexane |
16.80 |
16.80 |
0.00 |
0.20 |
| Tetrachloromethane |
17.81 |
17.80 |
1.00 |
0.60 |
| Xylene |
17.90 |
17.60 |
1.00 |
3.10 |
| Ethyl acetate |
18.15 |
15.80 |
5.30 |
7.20 |
| Toluene |
18.16 |
18.00 |
1.40 |
2.00 |
| Benzene |
18.51 |
18.40 |
0.00 |
2.00 |
| Chloroform |
18.95 |
17.80 |
3.10 |
5.70 |
| Butanone |
19.05 |
16.00 |
9.00 |
5.10 |
| THF |
19.46 |
16.80 |
5.70 |
8.00 |
| Cyclohexanone |
19.56 |
17.80 |
6.30 |
5.10 |
| Acetone |
19.94 |
15.50 |
10.40 |
7.00 |
| Dichloromethane |
20.20 |
18.20 |
6.30 |
6.10 |
| 1,4-Dioxane |
20.47 |
19.00 |
1.80 |
7.40 |
| N-Methyl-pyrrolidone |
22.96 |
18.00 |
12.30 |
7.20 |
| n-Butanol |
23.20 |
16.00 |
5.70 |
15.80 |
| Glycol |
32.95 |
17.00 |
11.00 |
26.00 |
The resulting equilibrium swelling ratios of two rubber compounds are listed in Table 5. From the table, we can see that there is a relatively higher swelling ratio when it comes to CHCl3 and CH2Cl2 for both rubbers (marked in blue). Therefore, we can easily infer that as CHCl3 and CH2Cl2 are good solvents for a great many of polymers, it is necessary to discard these two points to obtain a more reasonable fitting curve. Another factor that needs to be considered is that because these two rubbers are all nonpolar, it is more reliable to abandon points related to strong polar solvents. Based on these two principles, the final fitting curves for two rubbers were clearly obtained and are shown in Fig. 4.
Table 5 Equilibrium swelling ratio of two rubber compounds
| Solvent |
Equilibrium swelling ratio |
| F-SSBR |
Oil sucked SSBR |
| n-Hexane |
1.94 |
1.81 |
| MTBE |
2.88 |
2.78 |
| Cyclohexane |
3.15 |
3.29 |
| Xylene |
4.54 |
4.44 |
| Ethyl acetate |
2.37 |
2.29 |
| Toluene |
4.27 |
4.51 |
| Benzene |
4.38 |
4.31 |
| Chloroform |
7.99 |
7.40 |
| Butanone |
2.11 |
2.16 |
| THF |
1.01 |
4.78 |
| Cyclohexanone |
4.16 |
4.02 |
| Acetone |
1.34 |
1.28 |
| Dichloromethane |
5.03 |
5.69 |
| 1,4-Dioxane |
3.16 |
3.46 |
| N-Methyl-pyrrolidone |
1.95 |
2.64 |
| n-Butanol |
1.02 |
1.01 |
| Glycol |
1.01 |
1.01 |
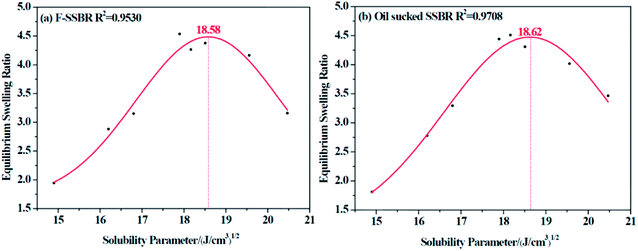 |
| | Fig. 4 The equilibrium swelling ratio fitting curves for (a) F-SSBR and (b) oil sucked SSBR. | |
The resulting intrinsic viscosity of five resins and their relevant fitting curves are illustrated in Table 6 and Fig. 5, respectively.
Table 6 Intrinsic viscosity of five resinsa
| Solvent |
Intrinsic viscosity [η]/(cm3 g−1) |
| 1# |
2# |
3# |
4# |
5# |
| “✗” represents that this resin cannot be dissolved in this solvent, and “—” represents that this solvent had not been used. For resin 1#, only several solvents are chosen to test the lower solubility parameter which is related to the compatibility with rubbers. |
| n-Hexane |
✗ |
✗ |
1.01 |
✗ |
✗ |
| MTBE |
— |
3.57 |
3.91 |
✗ |
✗ |
| Cyclohexane |
✗ |
4.10 |
4.89 |
4.10 |
✗ |
| Tetrachloromethane |
3.37 |
2.62 |
2.88 |
2.91 |
3.37 |
| Xylene |
3.94 |
3.68 |
3.68 |
3.42 |
3.94 |
| Ethyl acetate |
— |
3.08 |
✗ |
3.07 |
✗ |
| Toluene |
3.56 |
3.33 |
3.46 |
3.39 |
3.56 |
| Benzene |
3.30 |
3.23 |
3.24 |
3.16 |
3.30 |
| Chloroform |
3.25 |
2.93 |
3.44 |
3.05 |
3.25 |
| Butanone |
1.24 |
2.68 |
✗ |
2.37 |
✗ |
| THF |
— |
3.26 |
3.36 |
3.36 |
3.51 |
| Cyclohexanone |
— |
4.34 |
4.27 |
4.40 |
4.78 |
| Acetone |
✗ |
3.43 |
✗ |
✗ |
✗ |
| Dichloromethane |
3.37 |
3.21 |
2.93 |
2.90 |
3.37 |
| 1,4-Dioxane |
— |
3.73 |
3.86 |
3.86 |
✗ |
| N-Methyl-pyrrolidone |
— |
3.87 |
✗ |
3.87 |
✗ |
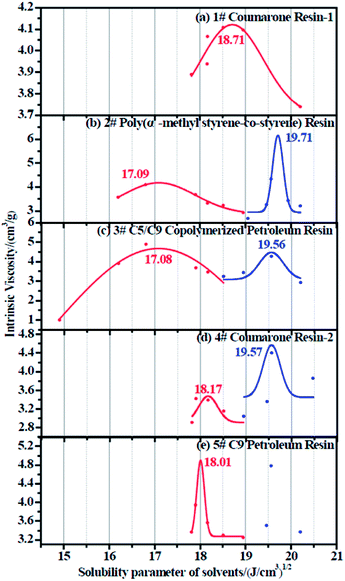 |
| | Fig. 5 Intrinsic viscosity fitting curve for (a) 1# resin, (b) 2# resin, (c) 3# resin, (d) 4# resin, and (e) 5# resin. | |
Since each resin can only dissolve in a certain number of solvents, the obtained intrinsic viscosity points are fewer than those of the rubbers. According to the tables as well as the figures, we observed that in some curves there is only one peak, while in the others, two peaks exist. The first peak, with a lower solubility parameter, derives from the solvents that are nonpolar and therefore represents the nonpolar compatibility of resins, which exactly corresponds to the compatibility with rubbers. Besides, the second peak with a higher solubility parameter originates from the solvents which have a stronger polarity and naturally indicates the polar compatibility of the resin, which makes little sense in our study since the two real rubbers are nonpolar. Table 7 summarizes the experimental solubility parameters for two rubbers and five resins. It is widely believed that the closer the solubility parameters between two materials are, the more compatible these two materials are. Hence, by comparing these results, we find that the compatibility order of resins with F-SSBR is: 1# > 4# > 5# > 2# ≈ 3#, and the compatibility order of resins with oil sucked SSBR is: 1# > 4# > 5# > 2# ≈ 3#.
Table 7 Experimental solubility parameters of rubbers and resins
3.2. Glass transition temperature simulation for resins
In order to verify the correctness of our simulation force field, we implemented a set of simulations to test the glass transition temperature (Tg) of five resins. By implementing a sequence of NPT conditions with well-defined temperature (T), we obtained a series of cell volumes (V) accordingly. Through the V–T curve, the Tg can easily be calculated. Taking the 1#-resin for instance, which curve is shown in Fig. 6, the temperature related to the turning point of volume represents exactly the Tg. Table 8 displays the details of simulation, including the chain molecular weight of both experimental Mn-exp and simulation Mn-simu, chain number Nchain, grass transition temperature obtained from both experiments, Tg-exp and simulation Tg-simu, and the relative error between Tg-simu and Tg-exp. From these values, we find that there is little deviation between Tg-simu and Tg-exp, which successfully proves the correctness of the COMPASS force field we used.
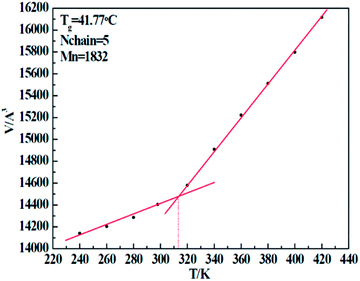 |
| | Fig. 6 Volume change of 1# resin system with an increase of temperature. | |
Table 8 Comparison of simulated Tg with experimented Tg for five resins
| Resin number |
Mn-exp/(g mol−1) |
Mn-simu/(g mol−1) |
Nchain |
Tg-exp/°C |
Tg-simu/°C |
Relative error/% |
| 1# |
1452 |
1414 |
5 |
44.74 |
41.77 |
6.661 |
| 2# |
2098 |
2107 |
5 |
37.13 |
37.16 |
0.808 |
| 3# |
1479 |
1793 |
5 |
40.54 |
38.09 |
6.043 |
| 4# |
1800 |
1997 |
5 |
41.97 |
43.47 |
3.573 |
| 5# |
1236 |
1288 |
5 |
50.86 |
49.37 |
2.929 |
3.3. Determination of optimized chain number and repeating unit number
Different construction systems and different target properties require different cell sizes. For the sake of determining the construction chain number Nchain and chain repeating units Nunit for the solubility parameter testing of rubber systems, two model rubber cells, NR (consisting of 100% cis-1,4-isoprene units) and SBR (styrene/cis-1,4-butadiene/trans-1,4-butadiene = 23.5/38.25/38.25, weight fraction) were built to decide these two critical values. As shown in Fig. 7(a) and (b), where Nchain is set to be constantly 10, with the increase of Nunit, the solubility parameters of two model rubbers decreased gradually to a convergent value. The convergent point all starts from when Nunit reaches 50. Similarly, according to Fig. 8(a) and (b), where Nunit is set to be constantly 50, the solubility parameters of the two model rubbers decline gradually to a convergent value. The convergent point all starts from when Nchain is around 10. Hence, Nunit = 50 and Nchain = 10 were then utilized to construct real rubber systems related to the experiments.
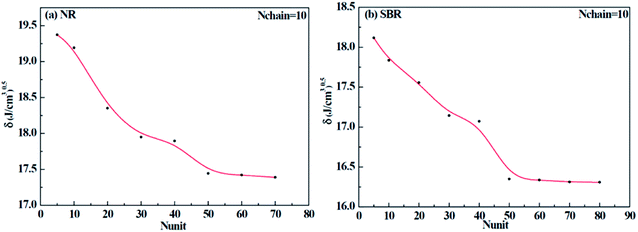 |
| | Fig. 7 Change of solubility parameter with the increase of repeating units for (a) NR and (b) SBR. | |
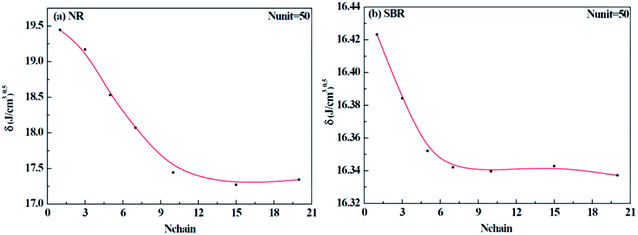 |
| | Fig. 8 Change of solubility parameter with an increase of chain numbers for (a) NR and (b) SBR. | |
For the solubility parameter measurements of resins, we chose the real molecular weights to build the single polymer chain. With the aim to decide the construction chain number, we took the 5#-resin as an example to explore the solubility parameter change with the increase of chain number. As shown in Table 9, the chain number almost has no influence on the resulting solubility parameter, and there is little fluctuation of solubility parameter with the change of chain number. According to these findings, we selected Nchain = 30 for resin cells in the subsequent studies.
Table 9 Simulated solubility parameters of 5# resin with the increase of chain number
| Chain number |
Construction density/(g cm−3) |
Equilibrium density/(g cm−3) |
δ-simu/(J cm−3)0.5 |
| 5 |
1.0 |
1.010 |
18.77 |
| 10 |
1.0 |
1.013 |
19.25 |
| 20 |
1.0 |
1.009 |
19.01 |
| 30 |
1.0 |
1.009 |
18.88 |
| 40 |
1.0 |
1.010 |
18.82 |
3.4. Solubility parameter simulation for rubbers and resins
The final simulative solubility parameters of two rubbers with Nunit = 50 and Nchain = 10 and five resins with real molecular weights and Nchain = 30 are summarized in Table 10. When using molecular dynamic simulation as a method to calculate the properties of already existing materials, there is a common acknowledgement to build the simulation cell with the real density, which is definitely reasonable. But in our study, considering the fact that there is no definitive density and other physical properties in new materials for research and development, we thought of a new equilibrium approach to construct initial cells by employing the NPT equilibrium process, which has been elaborated on in detail before. According to Table 10, we find that the simulated solubility parameter of 3# resin is the lowest because of the low final density. And this is easy to understand: solubility parameter represents the square root value of cohesive energy density (CED); when the distance between molecules becomes farther, the macroscopic density and CED value will drop accordingly.
Table 10 Simulative solubility parameters of two rubbers and five resins
| Name |
Construction density/(g cm−3) |
Equilibrium density/(g cm−3) |
δtotal/(J cm−3)0.5 |
δvdw/(J cm−3)0.5 |
δele/(J cm−3)0.5 |
| F-SSBR |
1.0 |
0.94 |
15.71 |
15.20 |
2.70 |
| Oil sucked SSBR |
1.0 |
0.95 |
15.85 |
15.33 |
2.76 |
| 1# |
1.0 |
1.02 |
15.87 |
15.33 |
2.80 |
| 2# |
1.0 |
1.03 |
15.27 |
14.61 |
3.22 |
| 3# |
1.0 |
0.92 |
13.99 |
13.68 |
1.17 |
| 4# |
1.0 |
1.05 |
15.82 |
15.25 |
2.96 |
| 5# |
1.0 |
1.00 |
16.99 |
16.45 |
2.99 |
Following the feasible method adopted by Luo Yanlong et al.,37 we used the R value to compare the compatibility of five different resins with rubbers. In the theory of mixing thermodynamics, the unit energy change of Gibbs free energy ( ), entropy (
 ), and enthalpy (
 ) during mixing can be calculated as follows:
| |
 | (6) |
| |
 | (7) |
| |
 | (8) |
Hildebrand also put forward an empirical expression which is more convenient in real use:
| |
 | (9) |
Comparing eqn (8) and (9), we can obtain a formula representing the parameter χ which plays a significant role in mixing:
| |
 | (10) |
As mentioned before, in COMPASS force field, the non-bonding interaction includes the van der Waals force energy Evdw and the electrostatic force energy Eele, then the CED can be represented as:
| |
 | (11) |
| |
 | (12) |
| |
 | (13) |
Thus, eqn (13) can be regarded as the expression of the two-component solubility parameter. Therefore, we can define the parameter R to measure the compatibility between resin and rubber:
| |
 | (14) |
The smaller the R value, the more compatible will be the two components. The total solubility parameter δtol, van der Waals component δvdw, and electrostatic component δele of the two rubbers and five resins are listed in Table 10, and the R values between resins and rubbers are also illustrated in Fig. 9. According to these results, we find that the compatibility order of resins with F-SSBR is: 1# ∼ 4# > 2# > 5# > 3#, and the compatibility order of resins with oil sucked SSBR is: 1# > 4# > 2# ∼ 5# > 3#. Comparing the simulative results with experimental ones, we find these two compatibility orders are in good agreement except for the order of the 2# resin and 5# resin. Considering the fact that the experimental test depends highly on the properties of solvents, while the simulative calculation focuses on the nature of the polymers themselves. Therefore, we infer that the compatibility order obtained from molecular dynamics simulation is more reliable. Here we also point out that there exists a relatively large difference between simulative absolute solubility parameters and experimental ones, and this difference mainly derives from the solvents used as media to substitute the solubility parameters of polymers. As mentioned before, with an increase of Nunit, the solubility parameter of rubber gradually decreases to a constant value. That is, using the solubility parameter of a small molecule (such as solvents) to represent that of a polymer will causes a relatively higher solubility parameter value, which is not consistent with our simulation findings.
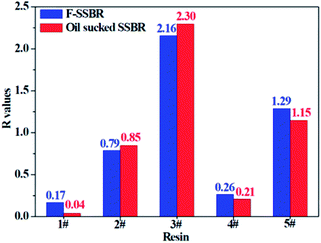 |
| | Fig. 9 The R difference between two rubbers and five resins. | |
3.5. Non-bond interactions between resin chains and rubber units
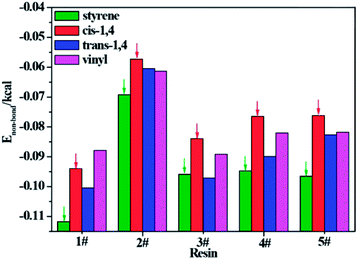
To further understand which repeating unit on a rubber chain has the strongest interaction with resins, we find the elementary units that make up the rubber chain and then build a series of simulation cells to study the interaction between those resin chains and rubber units. The four elementary units of rubber chain are illustrated in Fig. 10. In all simulation cells, a single resin chain and a certain number of rubber units with the same mass as that of resin were put in a 3D cubic cell. Then followed the construction and minimization process mentioned before; i.e., a set of hybrid systems for non-bond interaction calculations were built. And after a sufficient time for equilibrium, the non-bond interaction (Enon-bond) of these hybrid systems were averaged from the trajectory file and the results are summarized in Table 11 and Fig. 11. The Enon-bond can reflect the intermolecular interactions of the whole system and the smaller value of Enon-bond represents a stronger interaction between the relevant two components. Hence, from the graph, we can find that the styrene unit has the strongest interaction with all five resins, while the cis-1,4 unit has the weakest interaction with the resins. According to this finding, we infer that the five resins have better compatibility with F-SSBR compared with cis-polybutadiene (cis-BR) rubber.
 |
| | Fig. 10 Elementary units of rubbers. | |
Table 11 Non-bond energy between per gram resin and per gram rubber unit
| Enon-bond/kcal |
Resin |
| 1# |
2# |
3# |
4# |
5# |
| Rubber unit |
Styrene |
−0.1117 |
−0.0692 |
−0.0959 |
−0.0948 |
−0.0966 |
| cis-1,4 |
−0.0941 |
−0.0573 |
−0.0840 |
−0.0766 |
−0.0762 |
| trans-1,4 |
−0.1005 |
−0.0605 |
−0.0972 |
−0.0899 |
−0.0827 |
| Vinyl |
−0.0879 |
−0.0614 |
−0.0892 |
−0.0822 |
−0.0818 |
 |
| | Fig. 11 Non-bond energy between per gram resin and per gram rubber unit. | |
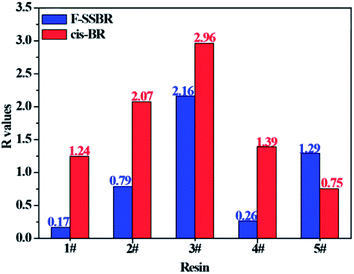
With the aim to verify our judgment, we built a cis-BR simulation cell with Nunit = 50 and Nchain = 10 to calculate its solubility parameter. The final two component solubility parameter of cis-BR and the R values of five resins with F-SSBR and cis-BR are summarized in Table 12 and Fig. 12, respectively. From the diagram, we can see that the R values between resins and F-SSBR are smaller than those between resins and cis-BR except from the 5# resin, which represents that F-SSBR has better compatibility with the resins than cis-BR. This result is inconsistent with our previous conjecture. Most of all, this interaction results from the chain/unit level non-bond energies fitting well with the compatibility result from the chain/chain level solubility parameters. Also, we should point out that when using chain/unit level results to judge the chain/chain level property, the densities of different polymers must be similar or the same, otherwise this “level expanded method” will lead to inaccurate results.
Table 12 Simulated two-component solubility parameters cis-BR
| |
Chain composition/wt% |
δtotal/(J cm−3)0.5 |
δvdw/(J cm−3)0.5 |
δele/(J cm−3)0.5 |
| cis-BR |
cis-1,4/trans-1,4 = 49/1 |
16.83 |
16.44 |
2.24 |
 |
| | Fig. 12 Comparison of R values between five resins and F-SSBR, cis-BR. | |
3.6. Binding energies of F-SSBR/resin composites
The binding energy (Ebinding), which is defined as the negative value of the interaction energy (Einter), is a measure of the compatibility between two components mixed with each other.33 A negative Ebinding represents poor compatibility between two components. On the contrary, a positive Ebinding represents good compatibility, and a larger positive value indicates better compatibility. From the equilibrium system at the end of the NPT simulation, the total energy of the hybrid systems and the individual components can be evaluated. The Ebinding between F-SSBR and resin can be obtained by the following equation:| |
 | (15) |
where EF-SSBR and Eresin are the total energies of F-SSBR and resin, respectively. For comparison, the mass portion of resin in each F-SSBR/resin hybrid system was set to be 10 phr. The construction chain number and total energy for pure rubber systems and pure resin systems, and total energy for five hybrid systems are listed in Table 13. The binding energy of the five F-SSBR/resin systems at 298 K are also shown in Table 13. The normalized Ebinding is related to one F-SSBR with 10 phr resin. According to normalized Ebinding, the compatibility order of resins with F-SSBR is: 4# > 1# > 5# > 2# ≈ 3#, which is inconsistent with the solubility parameter results. Besides, since the F-SSBR/3# resin system has a negative Ebinding, we can predict that microphase separation may appear in this composite.
Table 13 The binding energy between F-SSBR and five resinsa
| Blend system |
NF-SSBR |
EF-SSBR |
Nresinb |
EResin |
Etotal |
Ebinding |
Normalized Ebinding |
| The unit of energy is kcal mol−1. The second number stands for the number of repeating units of resins. In order to confirm the constant weight fraction of resin, using repeating unit to substitute whole resin chain is needed. And this substitution is reasonable as polydispersity remains inevitable in real resin systems. |
| F-SSBR/1# |
17 |
10![[thin space (1/6-em)]](https://www.rsc.org/images/entities/char_2009.gif) 175.21 175.21 |
4 |
931.09 |
11![[thin space (1/6-em)]](https://www.rsc.org/images/entities/char_2009.gif) 036.47 036.47 |
69.83 |
4.11 |
| F-SSBR/2# |
17 |
10![[thin space (1/6-em)]](https://www.rsc.org/images/entities/char_2009.gif) 175.21 175.21 |
2 + 1 |
1208.30 |
11![[thin space (1/6-em)]](https://www.rsc.org/images/entities/char_2009.gif) 306.66 306.66 |
76.85 |
4.52 |
| F-SSBR/3# |
16 |
9576.67 |
3 |
773.70 |
10![[thin space (1/6-em)]](https://www.rsc.org/images/entities/char_2009.gif) 812.68 812.68 |
−462.30 |
−28.89 |
| F-SSBR/4# |
18 |
10![[thin space (1/6-em)]](https://www.rsc.org/images/entities/char_2009.gif) 773.75 773.75 |
3 |
1116.78 |
11![[thin space (1/6-em)]](https://www.rsc.org/images/entities/char_2009.gif) 795.67 795.67 |
94.86 |
5.27 |
| F-SSBR/5# |
17 |
10![[thin space (1/6-em)]](https://www.rsc.org/images/entities/char_2009.gif) 175.21 175.21 |
4 + 1 |
1433.05 |
11![[thin space (1/6-em)]](https://www.rsc.org/images/entities/char_2009.gif) 549.88 549.88 |
58.39 |
3.43 |
3.7. Dynamics properties for F-SSBR chain in F-SSBR/resin composites
The self-diffusion coefficient (Ds), which is related to temperature and pressure, is one of the critical parameters in quantitatively determining the mobility of polymer chains. The Ds of the F-SSBR chains can be calculated by the Einstein equation:38| |
 | (16) |
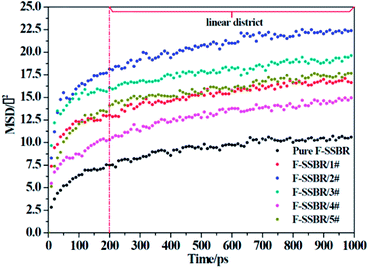
where N is the number of atoms in the F-SSBR chain, ri(0) is the initial position coordinate of atom i, and ri(t) is the position coordinate of atom i at time t.  is the mean square displacement (MSD) of the atoms over time t.39 The brackets denote that the average is taken for all atoms as well as over all time origins. Fig. 13 illustrates the MSD of F-SSBR in F-SSBR/resin composites at 298 K. It can be found that the mobility of F-SSBR chain increases linearly with the increase of time at the last 800 ps and by fitting this linear district, we obtained the corresponding Ds of the F-SSBR chain and the results are summarized in Table 14. According to Ds, the mobility order of F-SSBR chain in the five composites is: 2# > 4# > 1# > 5# > 3# > pure system. This result is in agreement with the solubility parameter result. Furthermore, with the addition of petroleum resin, the chain mobility of F-SSBR was improved and this result fits well with experimental findings in which petroleum resin softens the rubber matrix and acts like small molecule lubricants.
 |
| | Fig. 13 MSD–time curves of F-SSBR chains in five blend systems and pure F-SSBR system. | |
Table 14 Self-diffusion coefficient of F-SSBR chains
| System |
Pure F-SSBR |
F-SSBR/1# |
F-SSBR/2# |
F-SSBR/3# |
F-SSBR/4# |
F-SSBR/5# |
| Slopes/(Å2 ps−1) |
0.00352 |
0.00455 |
0.00535 |
0.00402 |
0.00492 |
0.00425 |
| Ds/(10−7 cm2 s−2) |
0.5867 |
0.7583 |
0.8917 |
0.6700 |
0.8200 |
0.7083 |
4. Conclusions
A series of MD simulation properties, including solubility parameters, R values, non-bond energies, binding energies, mean square displacements, and self-diffusion coefficients were calculated to find the compatibility order between F-SSBR and five commonly used petroleum resins. Results are satisfying that the final Ebinding trend of hybrid systems, the Ds trend of rubber chains, and the solubility parameters trend of rubbers and resins are consistent in general. Experimental solubility parameter data also confirmed our simulated compatibility order. More importantly, the compatibility results from the chain/unit level non-bond energies and the chain/chain level solubility parameters fit well. This novel and efficient method may contribute to promoting the development of new resins.
It should also be pointed out that although simulated and experimental compatibility trends match in general, there still exist some small distinctions. And the more similar the resin/rubber structures are, the more difficult it is for an accurate compatibility prediction. Therefore, in order to obtain reliable results, one must calculate several different properties and compare them thoroughly before drawing a final conclusion. What's more, when using chain/unit level results to judge a chain/chain level property, one must take density into account. Only when the densities of different polymers are similar (or the same) can this “level expanded method” be used and have meaningful results.
Conflicts of interest
There are no conflicts to declare.
Acknowledgements
The financial support from Red Avenue New Materials Group is gratefully acknowledged.
References
- J. Liang, S. Chang and N. Feng, J. Appl. Polym. Sci., 2013, 130, 510–515 CrossRef CAS.
- F. Zhang, G. He, K. Xu, H. Wu, S. Guo and C. Zhang, J. Appl. Polym. Sci., 2014, 131, 40464 Search PubMed.
- Z. Xin, P. Zhang, L. Zhifa and R. Guoying, Anal. Sci., 2007, 23, 877–880 CrossRef.
- L. Lu, S. Liu and K. Huang, J. Appl. Polym. Sci., 2008, 107, 872–880 CrossRef CAS.
- F. Adam, A. B. Siti Hana, M. M. Yusoff and S. N. Tajuddin, J. Chem. Eng. Data, 2014, 59, 183–188 CrossRef CAS.
- F. Jeyranpour, G. Alahyarizadeh and A. Minuchehr, Polymer, 2016, 88, 9–18 CrossRef CAS.
- K. Li, N. Huo, X. Liu, J. Cheng and J. Zhang, RSC Adv., 2016, 6, 769–777 RSC.
- Y. Wang, X. Li, Q. Wei, W. Chai, M. Yang and S. Wei, Asian J. Chem., 2014, 26, 5378–5382 CAS.
- W. Zhang, Y. Qing, W. Zhong, G. Sui and X. Yang, React. Funct. Polym., 2017, 111, 60–67 CrossRef CAS.
- L. Yang, L. Tong, X. He, H. D. Wagner and R. Wang, Comput. Mater. Sci., 2014, 83, 504–512 CrossRef CAS.
- H. B. Fan and M. M. F. Yuen, Polymer, 2007, 48, 2174–2178 CrossRef CAS.
- J. D. Monk, J. B. Haskins, C. W. Bauschlicher Jr and J. W. Lawson, Polymer, 2015, 62, 39–49 CrossRef CAS.
- G. Kacar, E. A. Peters and G. de With, Comput. Mater. Sci., 2015, 102, 68–77 CrossRef CAS.
- M. Zhang and P. Yang, Adv. Mater. Res., 2012, 602–604, 747–750 Search PubMed.
- Q. Yang, X. Li, L. Shi, X. Yang and G. Sui, Polymer, 2013, 54, 6447–6454 CrossRef CAS.
- J. C. He, Y. L. Zhou, C. G. Fan, M. B. Shuai and Y. J. Li, Russ. J. Phys. Chem. B, 2016, 10, 313–320 CrossRef CAS.
- J. Xia, S. Liu, P. K. Pallathadka, M. L. Chng and T.-S. Chung, Ind. Eng. Chem. Res., 2010, 49, 12014–12021 CrossRef CAS.
- L. Chen and W. Q. Tao, Mater. Sci. Forum, 2012, 1266–1272 CAS.
- L. Chen, Y.-L. He and W.-Q. Tao, Numer. Heat Transfer, Part A, 2014, 65, 216–228 CrossRef CAS.
- Y. Li, Y. Wu, L. Zhang, X. Wang, D. Ren and S. Wu, J. Appl. Polym. Sci., 2014, 131, 40347 Search PubMed.
- X. W. Cui and L. Zhang, Appl. Mech. Mater., 2014, 513–517, 295–298 CrossRef CAS.
- Q. Zhuang, Z. Xue, X. Liu, Y. Yuan and Z. Han, Polym. Compos., 2011, 32, 1671–1680 CrossRef CAS.
- H. Abou-Rachid, L.-S. Lussier, S. Ringuette, X. Lafleur-Lambert, M. Jaidann and J. Brisson, Propellants, Explos., Pyrotech., 2008, 33, 301–310 CrossRef CAS.
- A. Ahmadi and J. J. Freire, Mol. Simul., 2008, 34, 1253–1258 CrossRef CAS.
- B. Qiao, X. Zhao, D. Yue, L. Zhang and S. Wu, J. Mater. Chem., 2012, 22, 12339 RSC.
- J. Xie, Q. Xue, H. Chen, A. Keller and M. Dong, Comput. Mater. Sci., 2010, 49, 148–157 CrossRef CAS.
- D. r. Xin and Q. Han, Electron. Mater. Lett., 2014, 10, 535–539 CrossRef CAS.
- F. H. Zhang, X. D. He, L. H. Dong and Y. S. Yin, Adv. Mater. Res., 2009, 1289–1292 CrossRef.
- M. Song, X. Zhao, Y. Li, T. W. Chan, L. Zhang and S. Wu, RSC Adv., 2014, 4, 48472–48479 RSC.
- D. Yang, X. Zhao, T. Chan, L. Zhang and S. Wu, J. Mater. Sci., 2016, 51, 5760–5774 CrossRef CAS.
- X. Zhao, G. Zhang, F. Lu, L. Zhang and S. Wu, RSC Adv., 2016, 6, 85994–86005 RSC.
- Y. Luo, L. Qu, H. Su, T. W. Chan and S. Wu, RSC Adv., 2016, 6, 14643–14650 RSC.
- Y. Luo, R. Wang, S. Zhao, Y. Chen, H. Su, L. Zhang, T. W. Chan and S. Wu, RSC Adv., 2016, 6, 58077–58087 RSC.
- H. Sun, Macromolecules, 1993, 26, 5924–5936 CrossRef CAS.
- M. J. McQuaid, H. Sun and D. Rigby, J. Comput. Chem., 2004, 25, 61–71 CrossRef CAS PubMed.
- X. Ma, W. Zhu, J. Xiao and H. Xiao, J. Hazard. Mater., 2008, 156, 201–207 CrossRef CAS PubMed.
- Y. Luo, R. Wang, W. Wang, L. Zhang and S. Wu, J. Phys. Chem. C, 2017, 121, 10163–10173 CAS.
- S. Charati and S. Stern, Macromolecules, 1998, 31, 5529–5535 CrossRef CAS.
- J.-H. Zhou, R.-X. Zhu, J.-M. Zhou and M.-B. Chen, Polymer, 2006, 47, 5206–5212 CrossRef CAS.
|
| This journal is © The Royal Society of Chemistry 2018 |
Click here to see how this site uses Cookies. View our privacy policy here.  Open Access Article
 *abc,
Yonglai Lu*abc,
Dong Dongd,
Wenfang Wangd and
Liqun Zhang
 abc
abc

 . If the initial mass of rubber sample is mp, the Qm can be easily calculated as follows:


 curve and
  will achieve the same intercept, which exactly indicates the [η]. The one-point equation can also be deduced as follows:


 ), entropy (
 ), and enthalpy (
 ) during mixing can be calculated as follows:


![[thin space (1/6-em)]](https://www.rsc.org/images/entities/char_2009.gif) 175.21
175.21![[thin space (1/6-em)]](https://www.rsc.org/images/entities/char_2009.gif) 036.47
036.47![[thin space (1/6-em)]](https://www.rsc.org/images/entities/char_2009.gif) 175.21
175.21![[thin space (1/6-em)]](https://www.rsc.org/images/entities/char_2009.gif) 306.66
306.66![[thin space (1/6-em)]](https://www.rsc.org/images/entities/char_2009.gif) 812.68
812.68![[thin space (1/6-em)]](https://www.rsc.org/images/entities/char_2009.gif) 773.75
773.75![[thin space (1/6-em)]](https://www.rsc.org/images/entities/char_2009.gif) 795.67
795.67![[thin space (1/6-em)]](https://www.rsc.org/images/entities/char_2009.gif) 175.21
175.21![[thin space (1/6-em)]](https://www.rsc.org/images/entities/char_2009.gif) 549.88
549.88
 is the mean square displacement (MSD) of the atoms over time t.39 The brackets denote that the average is taken for all atoms as well as over all time origins. Fig. 13 illustrates the MSD of F-SSBR in F-SSBR/resin composites at 298 K. It can be found that the mobility of F-SSBR chain increases linearly with the increase of time at the last 800 ps and by fitting this linear district, we obtained the corresponding Ds of the F-SSBR chain and the results are summarized in Table 14. According to Ds, the mobility order of F-SSBR chain in the five composites is: 2# > 4# > 1# > 5# > 3# > pure system. This result is in agreement with the solubility parameter result. Furthermore, with the addition of petroleum resin, the chain mobility of F-SSBR was improved and this result fits well with experimental findings in which petroleum resin softens the rubber matrix and acts like small molecule lubricants.


