 Open Access Article
Single-step and ultrasensitive detection of carcinoembryonic antigen based on an aptamer transduction-mediated exonuclease III-assisted dual-amplification strategy†
Ruojun Lu,
Shengqiang Li,
Meihong Fan,
Jingjing Wei and
Xu Liu *
*
First Teaching Hospital of Tianjin University of Traditional Chinese Medicine, Tianjin 300020, China. E-mail: xuliu263@163.com
First published on 18th April 2018
Abstract
Herein, a single-step, rapid and homogenous fluorescence approach for highly sensitive and specific detection of CEA was successfully constructed for the first time using an aptamer binding-induced exonuclease III (Exo III)-mediated dual-amplification strategy. When present, CEA can specifically combine with the aptamer region in H1, resulting in a conformational change of H1 and the exposure of the occluded DNA fragment in the stem regions. Successively, the exposed DNA fragment partially hybridizes with H2 to initiate Exo III-assisted cycling cleavage to release another DNA fragment, which can in turn activate the cycling cleavage of the DNA fluorescence substrate (FS). Therefore, many fluorophore fragments are liberated to produce a significantly amplified fluorescence signal toward CEA detection. By virtue of the Exo III-assisted dual-amplification strategy, this method allows the detection of CEA at the fg mL−1 level with excellent selectivity. Compared with other reported strategies for CEA detection, the Exo III-assisted dual-amplification homogeneous platform only requires a one-step reaction, offering a very simple and low-cost detection. The practical ability of the developed strategy is demonstrated by the detection of CEA in human serum with satisfactory results. Thus, this method shows great potential in assays of many other biological analytes in clinical diagnosis.
Introduction
Cancer has greatly threatened human health in recent years. Carcinoembryonic antigen (CEA), one of the most widely used tumor markers, plays an important role in the diagnosis and screening of various cancers.1 The CEA level in blood serum is also associated with the stage of the tumor, the outcome of therapy and the prognosis.2 Normally, the concentration of CEA in blood serum is very low and the cut-off value for CEA is 5 ng mL−1.3 Therefore, the sensitive and accurate determination of CEA is necessary for effective early diagnosis and therapy of cancer.To date, many techniques, including enzyme-linked immunosorbent assay,4 capillary electrophoresis-chemiluminescence,5 electrochemistry,6 surface-enhanced Raman scattering,7 and electrochemiluminescence,8,9 have been developed for the trace detection of CEA. In addition to these conventional CEA detection approaches, fluorescence technology exhibits the advantages of simple operation, high sensitivity, fast response, and the ability to provide in situ and real-time information.10,11 In order to improve the detection sensitivity, various types of nanomaterials have been synthesised, including hollow porous gold nanoshells,12 Pt@Au nanowires,13 SiO2 nanoparticles,14 carbon nanotubes,15 and quantum dots etc.16,17 Despite the improved sensitivity, the synthesis of nanomaterials often requires a long time, harsh conditions and expensive raw materials.18 Moreover, the shape and size of these synthetic nanomaterials are difficult to control in different batches. These drawbacks severely limit their clinical application. Additionally, most of these immunosensors use antibodies as the molecular recognition element and suffer from poor stability and difficult experimental conditions.19 Therefore, the development of a simple, reliable, cost-effective and sensitive method for CEA detection is still highly desirable.
Aptamers are single-stranded oligonucleotides (DNA or RNA) evolved from random oligonucleotide libraries using systematic evolution of ligands by exponential enrichment (SELEX).20,21 Aptamers have been developed to be a powerful type of recognition agent for sensing and imaging different targets,22 ranging from small organic metabolites to biomolecules, viruses,23 and cells.24 Due to their properties of good stability, small size, target versatility, and easy modification, aptamers can be used as an alternative to antibodies in many applications.25 For example, an aptamer transduction-responsive amplification strategy was developed for CEA detection based on catalytic hairpin assembly (CHA) and the hybridization chain reaction (HCR).26 Similarly, a target binging-induced cascade amplification method was constructed for CEA detection using an Exo III-assisted DNA walker.27 However, these methods suffer from long assay times and multi-step reactions.
Exo III is a sequence-independent enzyme that can selectively catalyze the stepwise removal of mononucleotides from the 3′ terminus of double-stranded DNA in the case of a substrate with a blunt or recessed 3′-terminus.28 It shows limited activity on single-stranded DNA or duplex DNA with a protruding 3′ end.29 Due to the fact that specific recognition sequences are not required, the Exo III-assisted signal amplification strategy is very suitable for constructing universal biosensing platforms.30 Recently, Exo III has been applied in the detection of various analytes, including nucleic acids,31,32 proteins,33 enzyme activity,30 and mercury ions etc.34
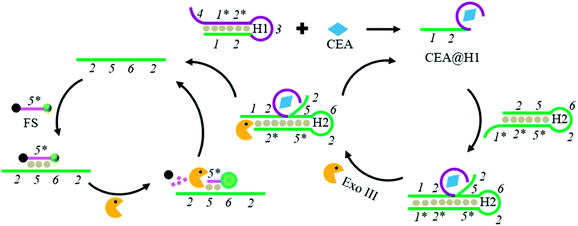
In this work, we developed a single-step, rapid and homogenous approach for the highly sensitive and selective detection of CEA based on an aptamer transduction-mediated Exo III-assisted dual-amplification strategy. In the presence of CEA, the specific recognition of the aptamer target changes the conformation of H1 and exposes a trigger DNA fragment originally caged in H1. Then, the exposed DNA fragment partly hybridizes with H2 to initiate the Exo III-assisted cycling cleavage, leading to the release of another trigger DNA fragment caged in H2, which can in turn initiate the cycling cleavage of the DNA fluorescence substrate (FS). Finally, large amounts of the fluorophore fragments are released, resulting in a significantly amplified fluorescence signal toward CEA detection. To the best of our knowledge, this is the first time that a highly sensitive fluorescence assay of CEA based on an Exo III-assisted dual-amplification strategy has been realized. As a universal sensing method, this strategy has substantial potential in the detection of many other analytes in different application fields.
Experimental
Materials and chemicals
CEA, carcinoma antigen 125 (CA125), carcinoma antigen 199 (CA199), and alpha-fetoprotein (AFP) were obtained from Linc-Bio Science Co. Ltd. (Shanghai, China). DNA oligonucleotides were synthesized and purified by Sangon Inc. (Shanghai, China). Their sequences are listed in Table S1.† Exo III was obtained from New England Biolabs (Beijing, China). All oligonucleotides were dissolved in tris–ethylenediaminetetraacetic acid buffer (pH 8.0, 10 mM Tris–HCl, 1 mM EDTA) and stored at −20 °C, and were diluted in an appropriate buffer prior to use. All other reagents were of analytical grade, and Millipore-Q water (≥18 MΩ) was used in all experiments. The clinical serum samples were acquired from the First Teaching Hospital of Tianjin University of Traditional Chinese Medicine.Preparation of the probes
Hairpins H1 and H2 were denatured at 95 °C for 5 min and then allowed to cool down to room temperature. Then the obtained DNA solutions were stored at 4 °C for further use.Exo III-mediated dual-amplification strategy for CEA detection
In this assay, different concentrations of CEA, 5 μL of H1, 5 μL of H2, 5 μL of FS and 6 μL of Exo III were added into the reaction buffer (10 mM Tris–HCl, 50 mM NaCl, 10 mM MgCl2, 10 mM KCl, pH 7.6) to give a total volume of 100 μL, and the final concentrations of H1, H2, FS, and Exo III were 0.25, 0.25, and 0.5 μM, and 2 U μL−1, respectively. The above solutions were incubated at 37 °C for 45 min before fluorescence measurements. The control experiments were performed under the same conditions without adding CEA. Unless noted otherwise, all experiments were repeated three times.Fluorescence measurements
All fluorescence measurements were performed on a Cary Eclipse Fluorescence spectrophotometer (Agilent, California), using a quartz fluorescence cell with an optical path length of 1.0 cm. The maximum fluorescence emission intensity was obtained at 518 nm. The emission spectra were obtained from 490 to 600 nm with an excitation wavelength of 480 nm at room temperature in steps of 1 nm. Both the excitation and emission slit widths were set at 5 nm. Prior to each experiment, all cuvettes were washed with 70% ethanol and distilled water.Results and discussion
Principle of the CEA assay
Scheme 1 exhibits a schematic representation of this homogenous approach for CEA detection based on an Exo III-mediated dual-amplification strategy. Briefly, this system mainly consists of two hairpin probes (H1 and H2), a fluorescence substrate (FS), and Exo III. When present, CEA can specifically bind to the aptamer region in H1 (3, 2*, 1*, 4), resulting in a conformational change of H1 and the exposure of the occluded DNA fragments (1, 2) in the stem regions. The exposed DNA fragment (1, 2) can hybridize with H2 at its 3′-protruding terminus to form a DNA duplex with a blunt 3′-terminus. The formed duplex DNA is stepwise digested by Exo III in the direction from 3′ to 5′ in H2, leading to the release of the CEA@H1 complex and the trigger DNA (2, 5, 6, 2) originally caged in H2. Then, the released CEA@H1 complex can bind to another H2 and start a new cycling cleavage process (cycle I). Meanwhile, the released trigger DNA (2, 5, 6, 2) can partially hybridize with FS to form a DNA duplex. In the resultant DNA duplex, FS with a recessed 3′-terminus is selectively digested by Exo III, but the trigger DNA (2, 5, 6, 2) with a protruding 3′-terminus remains intact. Consequently, the fluorophore in FS is separated from the quencher to restore its fluorescence signal. Simultaneously, the trigger DNA (2, 5, 6, 2) is released to hybridize with another FS to activate a new cycling cleavage process (cycle II). By virtue of this dual-amplification reaction, large amounts of fluorescence signal are generated. On the contrary, in the absence of CEA, Exo III hardly exhibits any activity towards H1 and H2 with an Exo III-resistant 3′ overhanging terminus, resulting in weak fluorescence background signal. It is worth noting that the reaction can be carried out in a single-step under isothermal conditions, making this method very convenient and simple. Therefore, the developed facile sensing platform is a good candidate for highly sensitive detection of CEA.Feasibility study
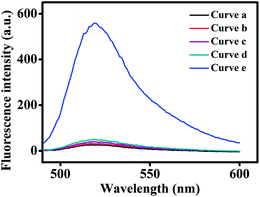
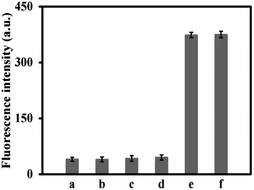
To confirm the feasibility of the Exo III-mediated dual-amplification strategy for CEA detection, the fluorescence signals under different conditions were recorded. As shown in Fig. 1, in FS, the fluorescence of FAM at the 5′ end is quenched by BHQ1 at the 3′ end, so in the presence of FS and H1, or FS, H1, and H2, weak fluorescence signals were observed (curve a and b). When CEA was added into the solution containing FS, H1 and H2, no appreciable increase of the fluorescence signal was observed (curve c). The control experiment, in the presence of all sensing components except CEA, showed only a small background signal (curve d). However, an obvious fluorescence signal appeared in the presence of CEA, H1, H2, FS, and Exo III (curve e), because numerous FSs were digested by Exo III. The results demonstrated the credibility of this developed strategy.Optimization of the experimental conditions
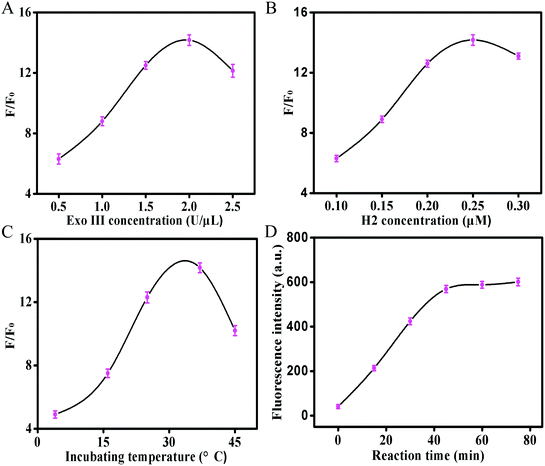
To achieve the best analytical performance of the proposed assay, some experimental parameters, such as the concentrations of Exo III and H2, incubation temperature, and reaction time, were optimized. As shown in Fig. 2A, the fluorescence response increased on increasing the concentration of Exo III from 0.5 to 2.0 U μL−1, whereas a decreased fluorescence response was observed when the concentration of Exo III was further increased. The best fluorescence response was achieved at 2 U μL−1 of Exo III. The decreased fluorescence response at a higher amount of Exo III could be ascribed to the cleavage activity of Exo III toward the hairpins (H1 and H2), leading to a relatively high background noise. As illustrated in Fig. 2B, the concentration of H2 was evaluated from 0.1 to 0.3 μM. The H2 concentration of 0.25 μM gave the best signal-to-background (S/B) ratio. A lower concentration of H2 reduced the fluorescence intensity, because H2 and the other sensing components could not be effectively hybridized. A higher concentration of H2 might cause the dimerization of the hairpins and generate a considerably high background noise, compromising the analytical performance for CEA detection. Because the temperature affects the activity of the enzyme and the stability of the hairpins, the incubation temperature of this strategy was examined from 4 to 60 °C (Fig. 2C). The maximum S/B ratio was achieved at 37 °C. Although a longer enzymatic reaction time resulted in an enhanced signal, the background noise also increased. Therefore, the enzymatic reaction time was explored. As depicted in Fig. 2D, it was found that the fluorescence intensity increased continually with the reaction time from 0 to 75 min, and almost reached a plateau at 45 min. According to the acquired results, these optimum conditions were used in the subsequent experiments.Assay performance for CEA detection
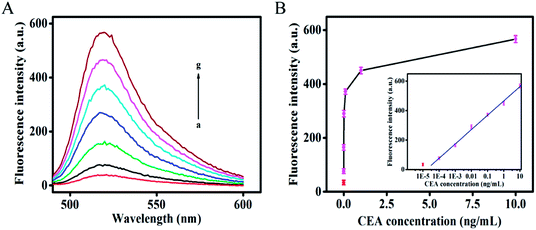
To evaluate the sensitivity of the developed dual-amplification strategy, CEA sample solutions with different concentrations were measured under the optimized experimental concentrations. As shown in Fig. 3A, the fluorescence intensity increased with an increase in CEA concentration, which demonstrated that the generated fluorescence signal was highly dependent on the concentration of CEA. As shown in Fig. 3B, the fluorescence intensity exhibited a good linear relationship with the logarithmic value of CEA concentration in the dynamic range from 100 fg mL−1 to 10 ng mL−1. The correlation equation is F = 465.5 + 97.2 × lg(C), with a correlation coefficient R2 of 0.9982, where C is the concentration of CEA. The limit of detection (LOD) was calculated to be 58 fg mL−1 based on the average signal of the blank plus three times the standard deviation, which is superior or comparable to those of other previously reported methods for CEA. A detailed comparison of the developed dual-amplification strategy with others is displayed in Table S2.† In addition, this single-step detection strategy had a dramatically shorter incubation time in comparison with most of the previously reported amplification strategies.26,27,35–37Specificity and reproducibility of this developed strategy
The detection of CEA may be interfered with by different protein analogues. To evaluate the selectivity, the developed strategy was tested with other common protein interferents, including CA125, CA199, and AFP under the same experimental conditions using a sample without CEA as a blank control. As described in Fig. 4, the presence of 10 ng mL−1 CA125, 10 ng mL−1 CA199, and 10 ng mL−1 AFP, respectively, gave negligible fluorescence signals compared with that of the blank test. However, the presence of 100 pg mL−1 CEA resulted in a significantly enhanced fluorescence signal. Moreover, a 100 pg mL−1 CEA sample in combination with 10 ng mL−1 CA125, 10 ng mL−1 CA199, and 10 ng mL−1 AFP did not exhibit any obvious fluorescence alteration compared with CEA alone, indicating that these cancer biomarkers did not interfere with the CEA detection. These results demonstrated that the developed strategy can effectively discriminate CEA from other protein biomarkers and has great potential for accurate early-diagnosis of cancers. To evaluate the reproducibility of the developed fluorescence strategy, 100 pg mL−1 and 1 ng mL−1 CEA were assayed 5 times. The relative standard deviations (RSDs) for both concentrations were determined to be 3.7% and 4.3%, respectively, showing that this dual-amplification strategy exhibits superior reproducibility.Clinical serum sample analysis
In order to validate the applicability of the proposed dual-amplification strategy for real sample analysis, the standard addition method was used to detect the recoveries of different concentrations of CEA in diluted serum samples. The serum samples consisted of non-cancer human serum. CEA solutions with concentrations of 0.01, 0.1, 1.0, and 10 ng mL−1 were added into the diluted serum samples. Table 1 shows that the RSD ranged from 2.3% to 3.6% and the recovery rate was from 96% to 110%, suggesting the acceptable analysis capability of the developed fluorescence method for clinical samples. These results demonstrated that the developed strategy holds great potential in clinical applications.| Samples | Spiked (ng mL−1) | Measured (ng mL−1) | RSD (%) | Recovery (%) |
|---|---|---|---|---|
| 1 | 0.01 | 0.0096 | 2.3 | 96 |
| 2 | 0.1 | 0.11 | 3.1 | 110 |
| 3 | 1.0 | 1.02 | 3.6 | 102 |
| 4 | 10 | 10.5 | 2.9 | 105 |
Conclusion
In conclusion, we have successfully developed a facile fluorescent approach for the highly sensitive and specific detection of CEA based on an aptamer binding-induced Exo III-mediated dual-amplification strategy. This homogeneous sensing system exhibits good selectivity, high sensitivity, and a low detection limit of 58 fg mL−1 for CEA detection. As it does not require multi-step reactions or the time-consuming synthesis of nanoparticles, this developed strategy can be conveniently accomplished in several tens of minutes with high stability. Moreover, this isothermal dual-amplification strategy can be applied to detect CEA in serum samples with satisfactory results. In addition, by simply changing the target-specific sequence, this single-step dual-amplification strategy can be easily extended for the detection of other disease markers. Therefore, the developed homogeneous strategy holds great potential for simple, rapid, and cost-effective detection of CEA in clinical samples, and other biological analytes for early diagnosis of diseases.Conflicts of interest
The authors declare no conflict of interest.References
- M. Hasanzadeh, N. Shadjou, Y. Lin and M. de la Guardia, TrAC, Trends Anal. Chem., 2017, 86, 185–205 CrossRef CAS.
- J. J. Miao, X. B. Wang, L. D. Lu, P. Y. Zhu, C. Mao, H. L. Zhao, Y. C. Song and J. Shen, Biosens. Bioelectron., 2014, 58, 9–16 CrossRef CAS PubMed.
- Z. B. Huang, X. Zhou, J. Xu, Y. P. Du, W. Zhu, J. Wang, Y. Q. Shu and P. Liu, J. Clin. Oncol., 2014, 5, 170–176 Search PubMed.
- J. Dong, G. Sun and H. Zhu, Tumor Biol., 2016, 37, 3257–3264 CrossRef CAS PubMed.
- Z. M. Zhou, Z. Feng, J. Zhou, B. Y. Fang, X. X. Qi, Z. Y. Ma, B. Liu, Y. D. Zhao and X. B. Hu, Biosens. Bioelectron., 2015, 64, 493–498 CrossRef CAS PubMed.
- Y. S. Gao, X. F. Zhu, J. K. Xu, L. M. Lu, W. M. Wang, T. T. Yang, H. K. Xing and Y. F. Yu, Anal. Biochem., 2016, 500, 80–87 CrossRef CAS PubMed.
- J. Li, Z. Skeete, S. Y. Shan, S. Yan, K. Kurzatkowska, W. Zhao, Q. M. Ngo, P. Holubovska, J. Luo, M. Hepel and C. J. Zhong, Anal. Chem., 2015, 87, 10698–10702 CrossRef CAS PubMed.
- G. Z. Zou, X. Tan, X. Y. Long, Y. P. He and W. J. Miao, Anal. Chem., 2017, 89, 13024–13029 CrossRef CAS PubMed.
- G. F. Shi, J. T. Cao, J. J. Zhang, K. J. Huang, Y. M. Liu, Y. H. Chen and S. W. Ren, Analyst, 2014, 139, 5827–5834 RSC.
- C. W. Liu, C. C. Huang and H. T. Chang, Anal. Chem., 2009, 81, 2383–2387 CrossRef CAS PubMed.
- X. H. Zhao, R. M. Kong, X. B. Zhang, H. M. Meng, W. N. Liu, W. H. Tan, G. L. Shen and R. Q. Yu, Anal. Chem., 2011, 83, 5062–5066 CrossRef CAS PubMed.
- T. Y. Xing, J. Zhao, G. J. Weng, J. Zhu, J. J. Li and J. W. Zhao, ACS Appl. Mater. Interfaces, 2017, 9, 36632–36641 CAS.
- S. Y. Xue, H. Y. Yi, P. Jing and W. J. Xu, RSC Adv., 2015, 5, 77454–77459 RSC.
- D. F. Wang, Y. Y. Li, Z. Y. Lin, B. Qiu and L. H. Guo, Anal. Chem., 2015, 87, 5966–5972 CrossRef CAS PubMed.
- H. R. Xu, Y. Wang, L. Wang, Y. L. Song, J. P. Luo and X. X. Cai, Nanomaterials, 2016, 6, 132 CrossRef PubMed.
- G. M. Nie, Y. Wang, Y. Tang, D. Zhao and Q. F. Guo, Biosens. Bioelectron., 2018, 101, 123–128 CrossRef CAS PubMed.
- L. L. Ren, H. Dong, T. T. Han, Y. Chen and S. N. Ding, Analyst, 2017, 142, 3934–3941 RSC.
- L. R. Zhang, G. Zhu and C. Y. Zhang, Anal. Chem., 2014, 86, 6703–6709 CrossRef CAS PubMed.
- W. Wen, J. Y. Huang, T. Bao, J. Zhou, H. X. Xia, X. H. Zhang, S. F. Wang and Y. D. Zhao, Biosens. Bioelectron., 2016, 83, 142–148 CrossRef CAS PubMed.
- A. D. Ellington and J. W. Szostak, Nature, 1990, 346, 818–822 CrossRef CAS PubMed.
- C. Tuerk and L. Gold, Science, 1990, 249, 505–510 CAS.
- H. L. Kuai, Z. L. Zhao, L. T. Mo, H. Liu, X. X. Hu, T. Fu, X. B. Zhang and W. H. Tan, J. Am. Chem. Soc., 2017, 139, 9128–9131 CrossRef CAS PubMed.
- W. Bai and D. A. Spivak, Angew. Chem., Int. Ed., 2014, 53, 2095–2098 CrossRef CAS PubMed.
- H. Liang, X. B. Zhang, Y. F. Lv, L. Gong, R. W. Wang, X. Y. Zhu, R. H. Yang and W. H. Tan, Acc. Chem. Res., 2014, 47, 1891–1901 CrossRef CAS PubMed.
- A. B. Iliuk, L. H. Hu and W. A. Tao, Anal. Chem., 2011, 83, 4440–4452 CrossRef CAS PubMed.
- L. Ge, W. X. Wang, T. Hou and F. Li, Biosens. Bioelectron., 2016, 77, 220–226 CrossRef CAS PubMed.
- M. Q. He, K. Wang, W. J. Wang, Y. L. Yu and J. H. Wang, Anal. Chem., 2017, 89, 9292–9298 CrossRef CAS PubMed.
- X. L. Zuo, F. Xia, Y. Xiao and K. W. Plaxco, J. Am. Chem. Soc., 2010, 132, 1816–1818 CrossRef CAS PubMed.
- F. Xuan, X. T. Luo and I. M. Hsing, Anal. Chem., 2012, 84, 5216–5220 CrossRef CAS PubMed.
- X. Z. Wang, T. Hou, T. T. Lu and F. Li, Anal. Chem., 2014, 86, 9626–9631 CrossRef CAS PubMed.
- S. F. Liu, C. F. Wang, C. G. Zhang, Y. Wang and B. Tang, Anal. Chem., 2013, 85, 2282–2288 CrossRef CAS PubMed.
- E. H. Xiong, X. X. Yan, X. H. Zhang, Y. Q. Liu, J. W. Zhou and J. H. Chen, Biosens. Bioelectron., 2017, 87, 732–736 CrossRef CAS PubMed.
- D. Wang, Y. L. Yuan, Y. N. Zheng, Y. Q. Chai and R. Yuan, Chem. Commun., 2016, 52, 5943–5945 RSC.
- M. H. Xie, K. Zhang, F. F. Zhu, H. Wu and P. Zou, RSC Adv., 2017, 7, 50420–50424 RSC.
- X. M. Li, W. Cheng, D. D. Li, J. L. Wu, X. J. Ding, Q. Cheng and S. J. Ding, Biosens. Bioelectron., 2016, 80, 98–104 CrossRef CAS PubMed.
- Y. Yin, L. Shi, Z. Y. Chu and W. Q. Jin, RSC Adv., 2017, 7, 45053–45060 RSC.
- F. L. Gao, F. Y. Zhou, S. J. Chen, Y. Yao, J. Wu, D. Y. Yin, D. Q. Geng and P. Wang, Analyst, 2017, 142, 4308–4316 RSC.
Footnote |
| † Electronic supplementary information (ESI) available. See DOI: 10.1039/c8ra00416a |
| This journal is © The Royal Society of Chemistry 2018 |

