 Open Access Article
Formation mechanism of bound rubber in elastomer nanocomposites: a molecular dynamics simulation study
Jun Liuab,
Haixiao Wana,
Huanhuan Zhoua,
Yancong Feng*c,
Liqun Zhang *ab and
Alexey V. Lyulin
 *d
*d
aKey Laboratory of Beijing City on Preparation and Processing of Novel Polymer Materials, People's Republic of China
bState Key Laboratory of Organic–Inorganic Composites, Beijing University of Chemical Technology, 100029 Beijing, People's Republic of China. E-mail: zhanglq@mail.buct.edu.cn
cGuangdong Provincial Key Laboratory of Optical Information Materials and Technology, Institute of Electronic Paper Displays, South China Academy of Advanced Optoelectronics, South China Normal University, Guangzhou 510006, People's Republic of China. E-mail: fengyancong@m.scnu.edu.cn
dGroup Theory of Polymers and Soft Matter, Department of Applied Physics, Technische Universiteit Eindhoven, 5600 MB, Eindhoven, The Netherlands. E-mail: a.v.lyulin@tue.nl
First published on 9th April 2018
Abstract
Bound rubber plays a key role in the mechanical reinforcement of elastomer nanocomposites. In the present work, we reveal the formation mechanism of bound rubber in elastomer nanocomposites, using the coarse-grained molecular dynamics simulations. For the polymer–nanoparticle system, the “chain bridge” connected with neighboring nanoparticles forms, once the gap between two neighboring nanoparticles is less than the polymer size. The polymer–nanoparticle–solvent systems, mimicking the oil-swollen rubber in the experiment, are simulated with three models. From the analysis of the potential energy, the static structure and dynamic diffusing processes, all the models indicate that the increase of the volume fraction of the nanoparticles and the polymer−nanoparticle interaction strength could promote the formation of the bound rubber. The existence of solvent disrupts the bound rubber, and eventually deteriorates the mechanical properties. These simulations could provide some theoretical guidance for a better understanding of the formation mechanism of the bound rubber, which is helpful for designing the elastomer materials with excellent mechanical properties.
1. Introduction
Elastomer nanocomposites, such as rubber filled with carbon black tailored for automobile tires, are well known and typical examples of polymer nanocomposites. The mechanical reinforcing efficiency mainly depends on the dispersion state of the nanoparticles (NPs), and the interfacial interaction between polymer matrix and NPs.1–10 In some mechanical experiments, the content of the “bound rubber (BR)” is always measured to characterize the interfacial interaction strength between carbon black and rubber chains. Note that “bound rubber” is referred to the nonextractable elastomer part after being immersed in a good solvent for a long enough time. Obviously, the more content of bound rubber and the stronger interfacial interactions are, consequently, the better the mechanical reinforcement can be obtained. In theory, nano-sized particles with various shapes, like carbon black, silica, clays, graphene and carbon nanotubes (CNTs), are always introduced into the rubber matrix to improve its mechanical properties. In the filled rubber system, a certain content of bound rubber will be formed. Therefore, the formation and the content of the bound rubber are essentially influenced by the physical and chemical interactions between fillers and polymer matrix, by the volume fraction and the size of the fillers, and by the molecular weight of the polymer-matrix chains.For a filled styrene–butadiene rubber (SBR), the good solvents to measure the content of the bound rubber are, for example, toluene and n-hexane. For instance, Choi et al.11 used a novel method to measure the content of the bound rubber in the solution of silica-filled styrene–butadiene rubber, finding that the bound rubber is composed of three major components of core shell, primary layer including tightly adsorbed layer and occluded rubber, and secondary layer including connecting polymer filaments. Note that the content of the bound rubber is very important for filled rubber compounds because it significantly influences the physical (thermal and electrical conductivity) and mechanical properties of the vulcanizates.
Presently, we can at least infer that the formation of the bound polymer results from the interfacial interactions, exerting some constraints on the mobility of the interfacial polymer chains. For instance, Robertson et al.12 observed that the bound rubber exhibits the glass-transition behavior similar to that of the bulk styrene–butadiene rubber (SBR), even after the polymer–filler linkages were introduced into the SBR reinforced with silica particles. In addition, the other experimental results show that the content of the bound rubber is greatly affected by the filler's concentration, filler's specific surface area and surface chemistry.13 Tiwari et al.14 investigated experimentally the swelling of the multi-wall carbon nanotube (MWCNT) reinforced chlorobutyl elastomer nanocomposites in chloroform, benzene, and trichloroethylene. The degree of the observed swelling is dependent on both the MWCNT concentration and the type of solvent used. Meanwhile, the diffusion coefficient and the penetration rate of the solvent are calculated, and the degree of the swelling increases with the time. Meanwhile, Qu et al.15 found that the content of bound rubber in hydrogenated nitrile butadiene rubber (HNBR) – carbon black composites decreases with the increase of the temperature, and the stiffness of the bound rubber exceeds that of the rubber matrix by approximately one order of magnitude.
Actually, the formation mechanism of the bound rubber in elastomer nanocomposites is a long-standing, unsolved important issue. One assumption is that the bound rubber is formed by the filler network mediated or connected through the polymer chains, which cannot be extracted by the surrounding good solvents. However, it is always difficult to validate this point in experiments. This filler network physically bridged through polymer chains, contributes as well to the non-linear visco-elastic behavior, namely to the decrease of the storage modulus as a function of the strain.16,17 Besides the bound rubber, the mechanical properties of the rubber nanocomposites influenced by introducing solvent molecules are also important to understand. Similar questions arise, for example, in the oil-swollen styrene–butadiene rubber.18
In the present study, we are going to adopt the molecular dynamics (MDs) simulations to elucidate the mechanism at the molecular level. Herein, first of all we examine the effects of the chain length and the inter-particle distance on the formation of the chain bridge. We develop two methods to simulate the formation of the bound rubber. In the first method, we construct two layers in the simulation box, with the upper layer being composed of NPs and polymer chains, and the lower layer being made of pure solvent molecules. After establishing this stable layers structure, the polymer chains will gradually diffuse into the solvent phase (lower) layer because of the attractive polymer–solvent interactions. The second method is similar, except that the solvent molecules are not allowed to move in the direction perpendicular to the layer plane during the inter-diffusion process, that is, only polymer chains are allowed to diffuse. We monitor the inter-diffusion of the polymer chains, as well as of the solvent molecules between the two layers, and simulate the polymer dynamics characterized by the corresponding mean-square displacements (MSD). The change of the total polymer–solvent interaction energy as a function of simulation time is also calculated. We also analyze the micro-structure of the “bound rubber” calculating the number of chain bridges, and by measuring the average distance between fillers in the bound rubber. Furthermore, we monitor the inter-diffusion process of the bound rubber by varying the volume fraction of NPs, the polymer–solvent and the polymer–NP interaction strengths. Lastly, by gradually introducing small molecules of solvent, we study the mechanical properties of rubber system filled with NPs, which is aimed to mimic the practical applications of the rubbers swollen with oil. Our main goal is to provide a molecular understanding of the formation of the bound rubber and the mechanical performance of the rubber–filler–solvent system.
2. Simulation model and methods
In this study we use the classical bead–spring model19 to simulate polymer chains. Each solvent molecule is modeled by a single bead. Since it is not our aim to study any specific polymers or solvent molecules, the mass and diameter of each bead is set to unity, which means that all calculated quantities are dimensionless. Nanoparticles are modeled as LJ spheres of radius Rn = 2σ. The subscript p, s and n stands for polymer, solvent and nanoparticle, respectively. The non-bonded interactions between all the beads are modeled through the truncated and shifted Lennard-Jones (TSLJ) potential:
 | (1) |
| εij | REV | rcutoff | |
|---|---|---|---|
| Polymer–polymer | 1.0 | 0 | 2 × 21/6σ |
| Polymer–nanoparticle | — | 1.5σ | 2 × 21/6σ |
| Polymer–solvent | — | 0 | — |
| Solvent–solvent | 1.0 | 0 | 2 × 21/6σ |
| Solvent–nanoparticle | 1.0 | 1.5σ | 2 × 21/6σ |
| Nanoparticle–nanoparticle | 1.0 | 3.0σ | 2 × 21/6σ |
The interactions between the adjacent bonded beads are modeled by the finite extensible non-linear elastic (FENE) potential:
 | (2) |
 and R0 = 1.5σ, guaranteeing a certain stiffness of the bonds while avoiding the high-frequency modes and chain crossing.
The NPT ensemble is adopted initially in the present simulations, where the temperature is mostly fixed at T* = 1.0, and the pressure is set as P* = 0.1, by using the Nose–Hoover thermostat and barostat.25 After the system reaches the equilibrated state, the NVT ensemble is carried out to make sure that the number density of the system is set to be 0.85 in the melt state. Periodic boundary conditions are employed in all three directions. The velocity-Verlet algorithm is used to integrate the equations of motion, with a timestep δt = 0.001, where the time is reduced by the LJ time τ. To carry out the uniaxial tension, we follow our previous simulation protocol.26,27 The pure and filled systems are deformed by changing the box length to L0![[thin space (1/6-em)]](https://www.rsc.org/images/entities/char_2009.gif) α in Z direction and to L0
α in Z direction and to L0![[thin space (1/6-em)]](https://www.rsc.org/images/entities/char_2009.gif) α−1/2 in the X and Y directions, so the volume remains constant. According to the simulations of Gao et al.,28 it is reasonable to set the strain rate ε˙
α−1/2 in the X and Y directions, so the volume remains constant. According to the simulations of Gao et al.,28 it is reasonable to set the strain rate ε˙![[thin space (1/6-em)]](https://www.rsc.org/images/entities/char_2009.gif)
![[thin space (1/6-em)]](https://www.rsc.org/images/entities/char_2009.gif) =
=![[thin space (1/6-em)]](https://www.rsc.org/images/entities/char_2009.gif)
![[thin space (1/6-em)]](https://www.rsc.org/images/entities/char_2009.gif)
![[thin space (1/6-em)]](https://www.rsc.org/images/entities/char_2009.gif) (L(t)z − Lz)
(L(t)z − Lz)![[thin space (1/6-em)]](https://www.rsc.org/images/entities/char_2009.gif) /Lz equal to 0.0327/τ.21 The average stress σ in the Z direction is obtained from the deviatoric part of the stress tensor τ
/Lz equal to 0.0327/τ.21 The average stress σ in the Z direction is obtained from the deviatoric part of the stress tensor τ ![[thin space (1/6-em)]](https://www.rsc.org/images/entities/char_2009.gif)
![[thin space (1/6-em)]](https://www.rsc.org/images/entities/char_2009.gif) =
= ![[thin space (1/6-em)]](https://www.rsc.org/images/entities/char_2009.gif)
![[thin space (1/6-em)]](https://www.rsc.org/images/entities/char_2009.gif) (1 + μ)(−Pzz + P) ≈ 3(−Pzz + P)/2, where
(1 + μ)(−Pzz + P) ≈ 3(−Pzz + P)/2, where  is the hydrostatic pressure. The parameter μ stands for the Poisson's ratio. Since the simulated temperature is above the glass-transition temperature Tg,26 and because during the deformation process the rubbery materials have almost no volume change and are incompressible,29 their Poisson's ratio equals to μ = 0.5. All the MD runs are carried out using the Large Scale Atomic/Molecular Massively Parallel Simulation (LAMMPS) software developed by Sandia National Laboratories.30
3. Results and discussion
3.1 Formation mechanism of chain bridge
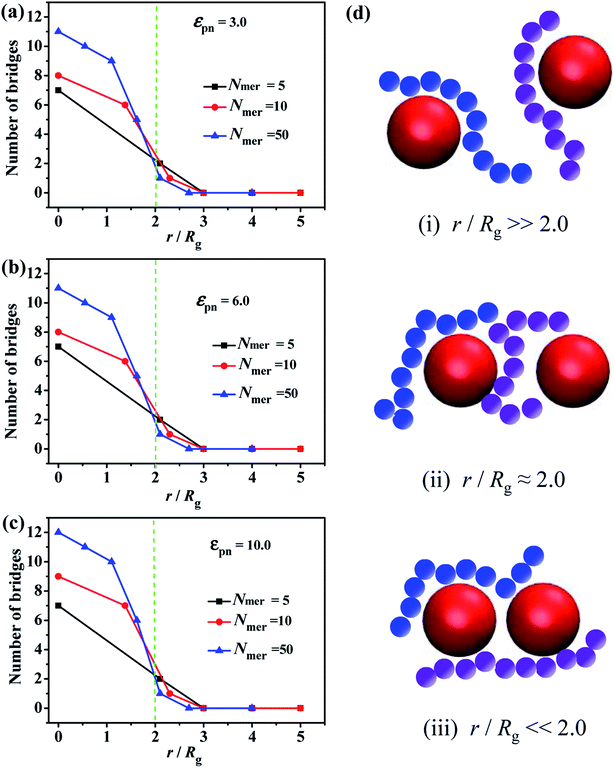
Ozmusul et al.31 used the lattice Monte Carlo simulations to study the role of the mean distance between the nanofillers on the overall conformation of polymer chains, such as the statistics of bridges, dangling ends, loops and trains. They found that the introduced NPs have no significant effect on the chain conformation. Meanwhile, Colby et al.32 observed that the percolation of the NPs network, formed by polymer bridging, can enhance the mechanical properties. Hence, the formation of the chain bridges is critical to both static and dynamic mechanical properties.First of all, we simulated the polymer melts filled with two fixed NPs, in order to characterize the formation of the chain bridges due to the chain adsorption to these two NPs. One adsorption point is considered to be formed when at least one bead is within the attractive distance from the center of the NP. Once two adsorption points are presented between the two NPs, we assume one chain bridge is formed. We set the numbers of beads in a polymer chain are 5, 10, 50, respectively, and the corresponding radii of gyration Rg are 0.95, 1.49, 3.50. In order to simulate a large enough system, the corresponding number of polymer chains is set as 1000, 1000 and 200, respectively. The inter-particle distance r between the surfaces of the two NPs is changed from 0 to 12σ.
Since the chain length is an important parameter which mainly decides whether the bridge forms or not, we calculate the number of chain bridges for the different ratios of the inter-particle distance r to the radius of gyration of polymer chain Rg, as shown in Fig. 1. Once the r/Rg ratio decreases to about 2.0, the number of bridges increases with decreasing r/Rg, independent of the εpn, see Fig. 1a–c. As the schematic in Fig. 1d displayed, (i) the NPs are too far to be connected by polymer chain at r/Rg![[thin space (1/6-em)]](https://www.rsc.org/images/entities/char_2009.gif)
![[thin space (1/6-em)]](https://www.rsc.org/images/entities/char_2009.gif) ≫ 2.0. (ii) The chain bridges begin to form once the surface-to-surface distance between neighboring NPs is close to the average polymer chain size, i.e. r/Rg ≈ 2.0. (iii) More and more chain bridges emerge as the two NPs approach.
≫ 2.0. (ii) The chain bridges begin to form once the surface-to-surface distance between neighboring NPs is close to the average polymer chain size, i.e. r/Rg ≈ 2.0. (iii) More and more chain bridges emerge as the two NPs approach.
3.2 Diffusion kinetics
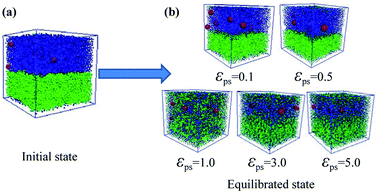
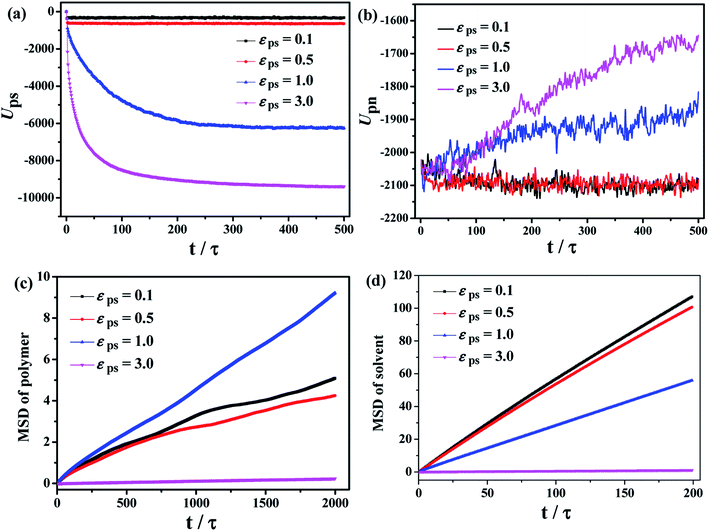
After considering the influence of the static structure on the chain bridges, we then study the diffusion processes. The polymer–nanoparticle–solvent system is built, and two different layers are created in the simulation box. The upper layer of the box consists of 10 NPs and 100 polymer chains with each chain containing 150 beads. The lower layer is composed of 10![[thin space (1/6-em)]](https://www.rsc.org/images/entities/char_2009.gif) 000 molecules of solvent. In this model, the polymer–solvent interactions are purely repulsive originally, to form the stable layer structure by setting the cutoff distance of the corresponding interactions equal to 21/6σ. The snapshot of the initial state is shown in Fig. 2a. Then the polymer–solvent interactions are modified to be attractive, to simulate the inter-diffusion process, by setting the cutoff distance equal to 2 × 21/6σ. The interactions between the NPs and the polymers are set to be attractive with the interaction strength εpn = 3.0. We set the attractive interaction strength εps between polymers and solvent molecules ranging from 0.1 to 5.0, and the corresponding equilibrium states are displayed in Fig. 2b. It can be seen that at low εps values (εps ≤ 0.5), the upper and lower layers are well separated, although some solvent molecules diffuse into the upper layer. However, the phase separation is suppressed with the further increase of εps. To monitor the diffusion process, we calculate the total polymer–solvent and polymer–NP interaction energy as a function of the simulation time, as shown in Fig. 3a and b. With the increase of εps, the total interaction energy Ups between polymers and solvent molecules decreases more significantly, while Upn between polymers and NPs increases more evidently. It indicates that with the further increase of εps, more solvent molecules diffuse into the upper layer composed initially of polymers and NPs only, and, eventually, the polymer–nanoparticle–solvent system becomes homogeneous.
000 molecules of solvent. In this model, the polymer–solvent interactions are purely repulsive originally, to form the stable layer structure by setting the cutoff distance of the corresponding interactions equal to 21/6σ. The snapshot of the initial state is shown in Fig. 2a. Then the polymer–solvent interactions are modified to be attractive, to simulate the inter-diffusion process, by setting the cutoff distance equal to 2 × 21/6σ. The interactions between the NPs and the polymers are set to be attractive with the interaction strength εpn = 3.0. We set the attractive interaction strength εps between polymers and solvent molecules ranging from 0.1 to 5.0, and the corresponding equilibrium states are displayed in Fig. 2b. It can be seen that at low εps values (εps ≤ 0.5), the upper and lower layers are well separated, although some solvent molecules diffuse into the upper layer. However, the phase separation is suppressed with the further increase of εps. To monitor the diffusion process, we calculate the total polymer–solvent and polymer–NP interaction energy as a function of the simulation time, as shown in Fig. 3a and b. With the increase of εps, the total interaction energy Ups between polymers and solvent molecules decreases more significantly, while Upn between polymers and NPs increases more evidently. It indicates that with the further increase of εps, more solvent molecules diffuse into the upper layer composed initially of polymers and NPs only, and, eventually, the polymer–nanoparticle–solvent system becomes homogeneous.
The time dependence of the mean square displacement (MSD) of polymer's center-of-mass and solvent molecules are shown in Fig. 3c and d, which are also used to examine the diffusion of the system during the mixing process. It is found that at smaller εps, the solvent molecules diffuse more quickly during the dynamic mixing process, while the MSD of the polymer chains exhibits a non-monotonic behavior. The polymer chains at εps = 1.0 has the fastest diffusion compared to other values of εps. That is, high polymer–solvent interaction strength restricts the movement of polymer chains.
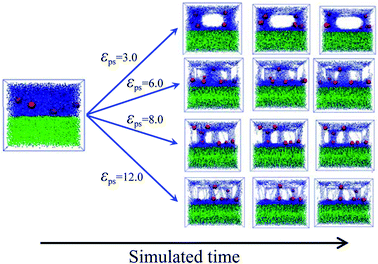
To accurately simulate the process of the bound rubber extracted from a good solvent, another model is built. Firstly, we create two layers in the simulated box, the same as the initial model of Fig. 2a. After that the strength of the polymer–solvent attractive interaction εps is changed, ranging from 3 to 12. Different from the first method of Fig. 2b, now the solvent molecules are not allowed to move in the direction perpendicular to the upper/lower layer interface. The diffusion process in this case as a function of simulation time is shown in Fig. 4. With the increase of εps, more and more polymer chains diffuse into the lower layer, resulting in the formation of some cavities in the upper layer.
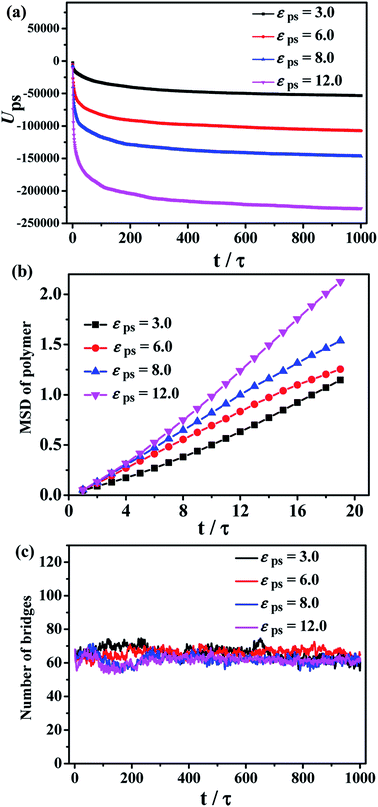
The total polymer–solvent interaction energy and the MSD of polymers are shown in Fig. 5a and b, respectively. The high polymer–solvent interaction strength accelerates the polymer chain diffusion to the solvent layer. In addition, the number of chain bridges is calculated to indirectly reflect the structure of the bound rubber, shown in Fig. 5c. The equilibrium average number of the chain bridges is around 60, independent of the εps, indicating that the structure of the chain bridges is not destroyed during the diffusion process.
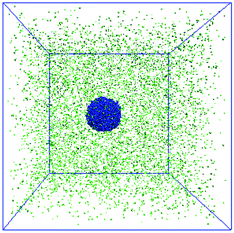
The third model is built to construct the bound rubber composed of nanoparticles, polymers and solvent molecules. The number of polymer beads and solvent molecules are fixed to be 5000 and 10![[thin space (1/6-em)]](https://www.rsc.org/images/entities/char_2009.gif) 000, respectively. The number of NPs ranges from 10 to 50. The mixture of NPs and polymer chains is initially put in the middle of the box and is surrounded by the solvent molecules, as shown in Fig. 6. Then the character of the polymer–solvent interactions was changed from repulsive to attractive, and the strength of the attractive polymer–NP interactions was tuned afterwards.
000, respectively. The number of NPs ranges from 10 to 50. The mixture of NPs and polymer chains is initially put in the middle of the box and is surrounded by the solvent molecules, as shown in Fig. 6. Then the character of the polymer–solvent interactions was changed from repulsive to attractive, and the strength of the attractive polymer–NP interactions was tuned afterwards.
As Fig. 7 shows, when the number of NPs is small (10 or 20), the bound rubber is disrupted, although the interaction strength between NPs and polymers is strong enough. Interestingly, we observe that in this case no matter how strong the interaction of NPs and polymers is, the structure of the bound rubber could still be disrupted ultimately.
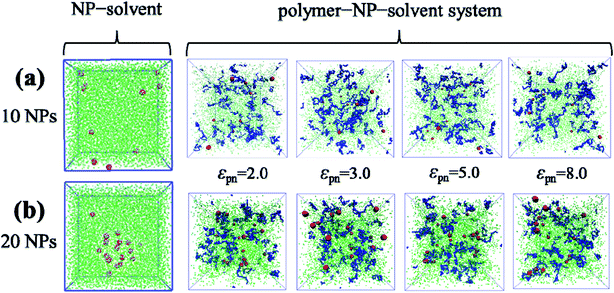 | ||
| Fig. 7 The snapshots of the NP–solvent system, and polymer–NP–solvent system with different polymer–NP interaction strength εpn for the number of NPs equal to (a) 10 and (b) 20. | ||
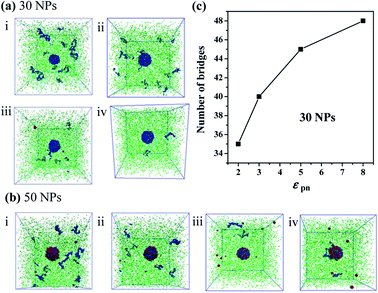
Furthermore, we increase the number of NPs to 30 and to 50, respectively. We find that there are few free polymer chains extracted by solvent, and the network structure of the bound rubber still exists. We deduce that when the content of NPs is large enough, the stable network structure of bound rubber forms. With the further increase of the polymer–NP interaction strength, the content of the bound rubber also increases, while the number of free polymer chains extracted by solvent decreases, as directly seen in Fig. 8a and b.
The number of polymer chain bridges is used to quantitatively describe the equilibrated system when the number of NPs is 30, as shown in Fig. 8c. It can be observed that with the increase of the polymer–NP interaction strength, the number of polymer chain bridges increases in the bound rubber, indicating a higher content of the bound rubber with a stronger polymer–NP interactions.
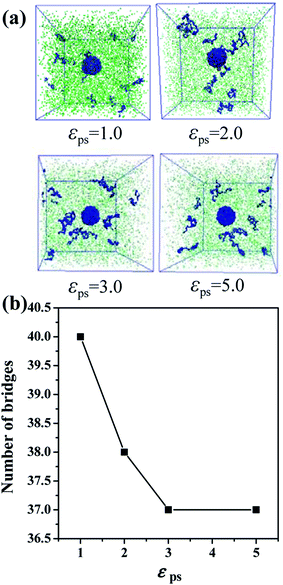
Besides, we also investigate other factors that could affect the formation of bound rubber. We build the system with 30 NPs and set the polymer–NP interaction strength equal to 2.0 and the polymer–solvent interaction strength is varied from 1.0 to 5.0, as shown in Fig. 9a and b. Both the content of bound rubber and the number of bridges decrease with the increase of the polymer–solvent interaction strength. No matter how strong the interaction is, the number of polymer chain bridges does not constantly decrease and the structure of the bound rubber will not be completely disrupted. That is to say, the key factor of forming the bound rubber is the content of NPs.
To sum it up, the primary factor of forming the bound rubber is the volume fraction of NPs. When the volume fraction of the NPs is large enough, the stable bound rubber structure could form. That is, the structure of the bound rubber cannot be destroyed at a higher volume fraction of NPs, as expected in experiments. When the volume fraction of NPs is fixed, the polymer–NP interaction strength, as well as the polymer–solvent interaction strength could be considered as the secondary factors to influence the content of bound rubber.
3.3 Mechanical properties
Finally, we characterize the effect of the introduced solvent molecules on the mechanical properties of the polymer–nanoparticle–solvent system, mimicking the case of the oil-swollen rubber products. The number of NPs and polymer chains are both equal to 100, and each chain contains 150 beads. We gradually increase the number of the solvent molecules from 1000 to 10![[thin space (1/6-em)]](https://www.rsc.org/images/entities/char_2009.gif) 000. During the mixing process, the radial distribution functions (RDFs) are calculated, as shown in Fig. 10.
000. During the mixing process, the radial distribution functions (RDFs) are calculated, as shown in Fig. 10.
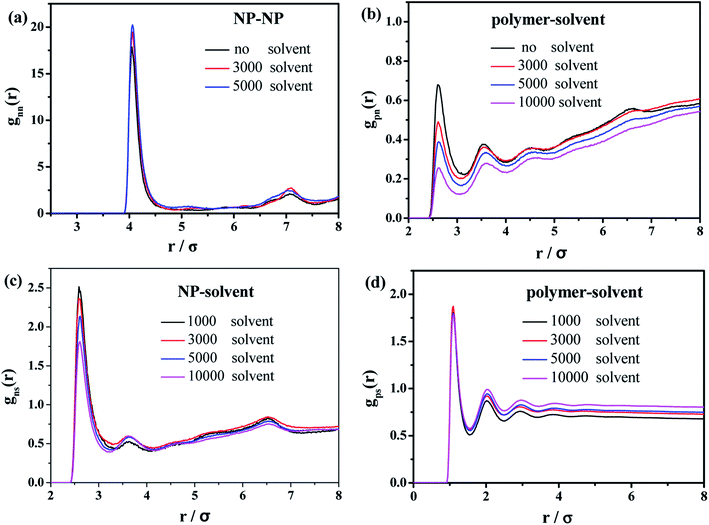 | ||
| Fig. 10 Radial distribution functions of (a) NP–NP, (b) polymer–NP, (c) solvent–NP and (d) polymer–solvent. | ||
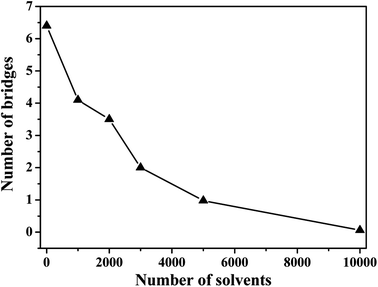
In the case of the small amount of solvent (3000 solvent molecules), the NP–NP radial distribution function does not change much, comparing with the system without solvent, Fig. 10a. In the case of the large number of solvent (5000 solvent molecules), more NPs form direct aggregation, indicated by the peak located at r = 4σ. In Fig. 10b, the value of the first peak at r = 2.5σ gradually decreases with increasing the solvent content, indicating that the polymer beads are away from the NPs. In Fig. 10c, the value of the first peak at decreases as the solvent molecule increases. On the contrary, as shown in Fig. 10d, the value of peaks rises as the solvent molecule increases. It indicates that more solvent molecules are adsorbed onto the surface of the polymer beads with the increase of the solvent content. In other words, the adsorbed NPs are replaced by the solvent molecules. In addition, we calculate the number of chain bridges to reflect the influence of the introduced solvent molecules. As shown in Fig. 11, it can be clearly observed that the introduced solvent molecules disturb the physical network formed between polymers and NPs, leading to the decrease of the number of chain bridges. Note that the maximum number of chain bridges (about 6), is much smaller than that of Fig. 5c. It can be explained that the polymer–NP interaction strength equal to 1.0 is much smaller than that of Fig. 5c (equal to 3.0 in that case).
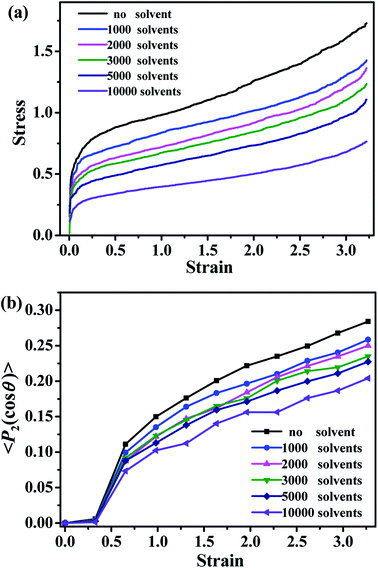
The mechanical properties of the simulated materials are studied by simulating the stress–strain dependencies. As shown in Fig. 12a, the value of the stress decreases with the increase of the number of solvent molecules, which is consistent with the behavior of the typical oil-swollen rubber products. The bond orientation of polymer chains along the deformed direction is shown in Fig. 12b. The bond orientation can be expressed by the second-order Legendre polynomial 〈P2〉,
〈P2〉 = (3〈cos2![[thin space (1/6-em)]](https://www.rsc.org/images/entities/char_2009.gif) θ〉 − 1)/2 θ〉 − 1)/2
| (3) |
4. Conclusions
In the present paper we reveal the formation mechanism of the bound rubber in the elastomer nanocomposites, using the coarse-grained molecular dynamics simulations. Firstly, the polymer–nanoparticle system is built. The key role in the bound rubber was played by the “chain bridge”, i.e. the polymer chain connected with neighboring NPs. The existence of the bridge is mainly determined and influenced by the chain length and the surface-to-surface distance between two neighboring NPs. Once this distance approaches the typical polymer size (say, twice radius of gyration of a polymer chain), the chain bridge forms.We extend the present study to mimic the oil-swollen rubber, by studying the polymer–nanoparticle–solvent system using three different models. Analyses of the potential energy, the static structure and the dynamic diffusing processes, reveal that for all the models the formation of the bound rubber is mainly influenced by the volume fraction of NP, the content of solvent and the polymer–nanoparticle interaction strength, but was barely affected by the polymer–solvent interaction strength. Increasing the volume fraction of NP and the polymer–nanoparticle interaction strength can promote the formation of the bound rubber. The existence of solvent disrupts the bound rubber, and eventually deteriorates the mechanical property of the material. Revealing the formation mechanism of the bound rubber in the nanoscale will provide guidance in designing the elastomer materials with high mechanical properties.
Conflicts of interest
There are no conflicts to declare.Acknowledgements
The authors acknowledge the financial support from the National 973 Basic Research Program of China 2015CB654700(2015CB654704), the Foundation for Innovative Research Groups of the NSF of China (51221002), the National Natural Science Foundation of China (51333004, 51403015 and 51703070), the Major International Cooperation (51320105012) of the National Nature Science Foundation of China. The support from the high-performance computing center of "National Super Computer Center in Guangzhou" and CHEMCLOUDCOMPUTING of Beijing University of Chemical Technology (BUCT) are both greatly appreciated.References
- F. Deng, M. Ito, T. Noguchi, L. F. Wang, H. Ueki, K. Niihara, Y. A. Kim, M. Endo and Q. S. Zheng, ACS Nano, 2011, 5, 3858–3866 CrossRef CAS PubMed.
- H. Kim, A. A. Abdala and C. W. Macosko, Macromolecules, 2010, 43, 6515–6530 CrossRef CAS.
- M. Maiti, M. Bhattacharya and A. K. Bhowmick, Rubber Chem. Technol., 2008, 81, 384–469 CrossRef CAS.
- M. Moniruzzaman and K. I. Winey, Macromolecules, 2006, 39, 5194–5205 CrossRef CAS.
- D. R. Paul and L. M. Robeson, Polymer, 2008, 49, 3187–3204 CrossRef CAS.
- C. A. Rezende, F. C. Braganca, T. R. Doi, L. T. Lee, F. Galembeck and F. Boue, Polymer, 2010, 51, 3644–3652 CrossRef CAS.
- L. S. Schadler, S. K. Kumar, B. C. Benicewicz, S. L. Lewis and S. E. Harton, MRS Bull., 2007, 32, 335–340 CrossRef CAS.
- L. S. Schandler, L. C. Brinson and W. G. Sawyer, JOM, 2007, 59, 53–60 CrossRef.
- X. Hu, H. L. Gao, X. F. Zhou, Y. S. Cui and H. X. Ge, RSC Adv., 2014, 4, 13662–13668 RSC.
- J. Q. Su, Q. Yang, D. H. Tang, Y. J. Huang, Z. G. Zhao and X. Liao, RSC Adv., 2015, 5, 91262–91272 RSC.
- S. S. Choi and E. Ko, Polym. Test., 2014, 40, 170–177 CrossRef CAS.
- C. G. Robertson, C. J. Lin, R. B. Bogoslovov, M. Rackaitis, P. Sadhukhan, J. D. Quinn and C. M. Roland, Rubber Chem. Technol., 2011, 84, 507–519 CrossRef CAS.
- Y. L. Yue, H. Zhang, Z. Zhang and Y. F. Chen, Compos. Sci. Technol., 2013, 86, 1–8 CrossRef CAS.
- S. K. Tiwari, B. P. Sahoo and S. P. Mahapatra, J. Polym. Eng., 2014, 34, 41–52 CAS.
- M. Qu, F. Deng, S. M. Kalkhoran, A. Gouldstone, A. Robisson and K. J. Van Vliet, Soft Matter, 2011, 7, 1066–1077 RSC.
- J. X. Shen, J. Liu, Y. Y. Gao, X. L. Li and L. Q. Zhang, Soft Matter, 2014, 10, 5099–5113 RSC.
- D. Ponnamma, K. K. Sadasivuni, M. Strankowski, P. Moldenaers, S. Thomas and Y. Grohens, RSC Adv., 2013, 3, 16068–16079 RSC.
- A. I. Khaaf, A. A. Ward, A. E. Abd El-Kader and S. H. El-Sabbagh, Polimery, 2015, 60, 43–56 CrossRef.
- K. Kremer and G. S. Grest, J. Chem. Phys., 1990, 92, 5057 CrossRef CAS.
- J. Liu, D. P. Cao and L. Q. Zhang, J. Phys. Chem. C, 2008, 112, 6653–6661 CAS.
- J. Liu, D. P. Cao, L. Q. Zhang and W. C. Wang, Macromolecules, 2009, 42, 2831–2842 CrossRef CAS.
- J. Liu, Y. Wu, J. X. Shen, Y. Y. Gao, L. Q. Zhang and D. P. Cao, Phys. Chem. Chem. Phys., 2011, 13, 13058–13069 RSC.
- K. Kremer and G. S. Grest, J. Chem. Phys., 1990, 92, 5057–5086 CrossRef CAS.
- Y. L. Chen, L. Liu, Q. Y. Yang, S. P. Wen, L. Q. Zhang and C. L. Zhong, Langmuir, 2013, 29, 13932–13942 CrossRef CAS PubMed.
- M. P. Allen and D. J. Tildesley, Computer simulation of liquids, Oxford, 1987 Search PubMed.
- J. Liu, Z. Zheng, F. Li, W. Lei, Y. Gao, Y. Wu, L. Zhang and Z. L. Wang, Nano Energy, 2016, 28, 87–96 CrossRef CAS.
- W. H. Wang, G. Y. Hou, Z. J. Zheng, L. Wang, J. Liu, Y. P. Wu, L. Q. Zhang and A. V. Lyulin, Phys. Chem. Chem. Phys., 2017, 19, 15808–15820 RSC.
- J. Gao and J. H. Weiner, J. Chem. Phys., 1995, 103, 1614–1620 CrossRef CAS.
- J. E. Mark, Polymer Data Handbook, Oxford University Press, 2009 Search PubMed.
- S. Plimpton, J. Comp. Physiol., 1995, 117, 1 CAS.
- M. S. Ozmusul, C. R. Picu, S. S. Sternstein and S. K. Kumar, Macromolecules, 2005, 38, 4495–4500 CrossRef CAS.
- Q. Chen, S. S. Gong, J. Moll, D. Zhao, S. K. Kumar and R. H. Colby, ACS Macro Lett., 2015, 4, 398–402 CrossRef CAS.
| This journal is © The Royal Society of Chemistry 2018 |

