 Open Access Article
Intramolecular hydrogen bond directed stable conformations of benzoyl phenyl oxalamides: unambiguous evidence from extensive NMR studies and DFT-based computations†
P. Dhanishtaab,
P. Sai Siva kumarc,
Sandeep Kumar Mishraab and
N. Suryaprakash *ab
*ab
aNMR Research Centre, Indian Institute of Science, Bangalore 560 012, India. E-mail: nsp@iisc.ac.in; suryaprakash1703@gmail.com; Fax: +91-80-23601550; Tel: +91-80-23607344 Tel: +91-80-22933300 Tel: +91-9845124802
bSolid State and Structural Chemistry Unit, Indian Institute of Science, Bangalore 560 012, India
cDepartment of Chemistry, University of Missouri, Kansas City, USA
First published on 21st March 2018
Abstract
A number of benzoyl phenyl oxalamide derivatives have been synthesized and characterized by the extensive utility of one- and two-dimensional NMR experimental techniques. The manifestation of intramolecular hydrogen bonds in all of the synthesized molecules, convincingly established using NMR studies, governs the stable conformations of the molecules. In the fluorine substituted molecules, the coupling between two NMR active nuclei mediated through hydrogen bonds has been detected. The measured chemical shift difference of an NH proton has been employed to calculate the energy of the HBs. NMR analysis revealed the electrostatic nature of the hydrogen bonds in all of the molecules. The NMR experimental findings have been validated using Density Functional Theory (DFT)-based Non Covalent Interactions (NCIs) and Quantum Theory of Atoms In Molecules (QTAIM) computations.
Introduction
Hydrogen bonds (HBs) are ubiquitous in nature with immense significance in most of the important biological and chemical processes.1–4 Large amounts of information have been available on HBs since the early 1900s.2,3,5 The strength of the HB is situated between that of van der Waals forces and covalent bonds. A HB is directional and strong, although it is not a true chemical bond, and it is effective in directing the assembly of molecules into their delicate architectures via molecular recognition, self-assembly and supramolecular chemistry.4 HBs can be separated into two categories based on the HB donor and acceptor, viz., intermolecular HBs where the acceptor and donor reside in different molecules and intramolecular HBs where the acceptor and donor reside in the same molecule.5 Intramolecular HB formation can lead to five, six or seven membered rings2 and they are weaker than intermolecular HBs with the same donor and acceptor due to geometrical constraints.Molecules containing intramolecular HBs mainly involve O⋯H–N and N⋯H–N types.6–8 Nevertheless ![[double bond, length as m-dash]](https://www.rsc.org/images/entities/char_e001.gif) O⋯H–O type hydrogen bonds, which are stronger than the other two have also been observed in β-dicarbonyl compounds. It is generally noticed that nearly 30% of the drugs available on the market possess at least one fluorine atom and such organic fluorine-containing molecules have applications in molecular imaging,9,10 crystal engineering,11–13 biomaterials and agrochemicals. It is well known that organic fluorine normally doesn’t participate in intramolecular HBs.14,15 It has also been reported that “organic fluorine hardly ever accepts hydrogen bonds”,16–19 because of its low polarizability and tightly contracted lone pairs. With large experimental observations reported by various groups, both in the solution state and solid state, where organic fluorine participates in HBs,20–22 this statement may not be relevant in the present day. The existence of N–H⋯F–C HBs in benzanilides and foldamers has been explored using NMR and X-ray crystallographic studies.23,24 Another special type of HB, i.e. a three-centered HB, also known as a bifurcated HB,25 is important in many biological and chemical systems, such as, RNA,26 DNA,27 proteins28 and carbohydrates29 and chiral molecular recognition.30 A variety of analytical techniques have been used for the in-depth understanding of HBs.31,32 Nevertheless, NMR spectroscopy has evolved as one of the most powerful tools among all of the available techniques to investigate the presence of weak molecular interactions, molecular conformations, and dynamics in the solution state.33,34
O⋯H–O type hydrogen bonds, which are stronger than the other two have also been observed in β-dicarbonyl compounds. It is generally noticed that nearly 30% of the drugs available on the market possess at least one fluorine atom and such organic fluorine-containing molecules have applications in molecular imaging,9,10 crystal engineering,11–13 biomaterials and agrochemicals. It is well known that organic fluorine normally doesn’t participate in intramolecular HBs.14,15 It has also been reported that “organic fluorine hardly ever accepts hydrogen bonds”,16–19 because of its low polarizability and tightly contracted lone pairs. With large experimental observations reported by various groups, both in the solution state and solid state, where organic fluorine participates in HBs,20–22 this statement may not be relevant in the present day. The existence of N–H⋯F–C HBs in benzanilides and foldamers has been explored using NMR and X-ray crystallographic studies.23,24 Another special type of HB, i.e. a three-centered HB, also known as a bifurcated HB,25 is important in many biological and chemical systems, such as, RNA,26 DNA,27 proteins28 and carbohydrates29 and chiral molecular recognition.30 A variety of analytical techniques have been used for the in-depth understanding of HBs.31,32 Nevertheless, NMR spectroscopy has evolved as one of the most powerful tools among all of the available techniques to investigate the presence of weak molecular interactions, molecular conformations, and dynamics in the solution state.33,34
Oxalamide molecules contain acidic protons and lone pairs. As a result these molecules may become involved in both intra- and inter-molecular HBs.35 The intramolecular HB dictates the geometry and conformation of oxalamides, and at the same time the stability can be examined through the intermolecular HB.36–38 The presence of such weak molecular interactions in oxalamide structures leads to a diverse range of applications, viz., artificial receptors in biological recognition,39 crystal design and engineering,40 organogel formation41 and also as HIV-1 inhibitors.42 In addition, they can also be used as ligands in co-ordination chemistry.43
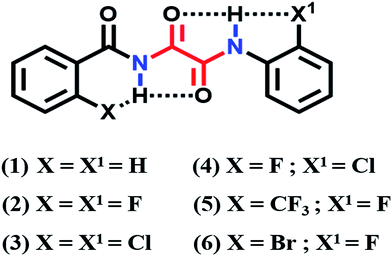
The present work is aimed towards the synthesis of benzoyl phenyl oxalamide derivatives and their characterization. The basic structural framework of all the molecules is shown in Scheme 1. The existence of intramolecular HBs in the synthesized molecules was established by the extensive utility of NMR spectroscopy, by employing various one and two-dimensional experimental techniques and it has also been validated using Density Functional Theory (DFT)-based44,45 Non Covalent Interactions (NCIs)46 and Quantum Theory of Atoms In Molecules (QTAIM)47 calculations.
Results and discussion
Establishing the spatial proximity
The basic requirement to establish a HB interaction between two nuclei is their close spatial proximity. Qualitative information on the spatial proximity between two NMR active nuclei can be obtained using the nuclear Overhauser effect (NOE). Hence, as a first step 2D 19F–1H HOESY (hetero NOE spectroscopy)48–50 experiments were carried out for all of the fluorine substituted molecules. The 2D 19F–1H HOESY spectrum of molecule 2 is shown in Fig. 1, where the detection of a strong correlated peak between a fluorine atom substituted at the ortho position of the phenyl ring and the NH proton, evidently establishes their close spatial proximity. The 2D 19F–1H HOESY spectra of the other fluorine containing molecules are given in the ESI.†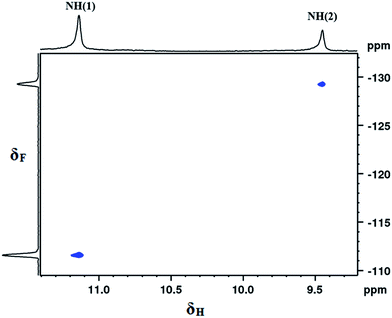 | ||
| Fig. 1 400 MHz 2D 19F–1H HOESY spectrum of molecule 2 in CDCl3 solvent, depicting a strong correlation between F and the NH proton. | ||
Intra- or inter-molecular HB?
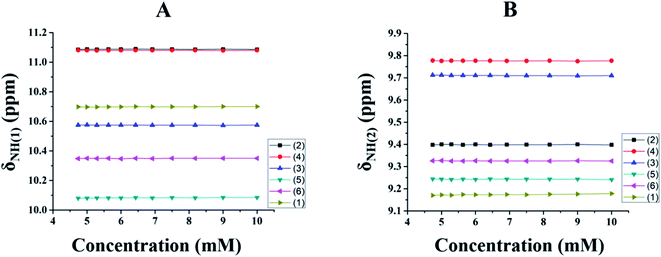
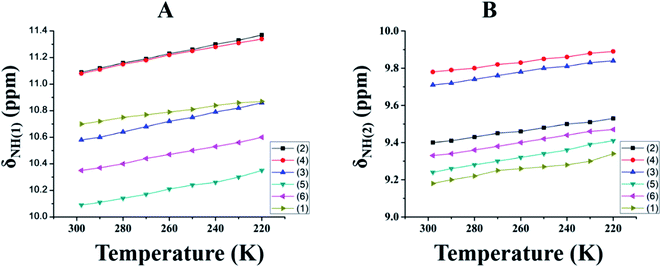
After substantiating the close spatial proximity, various other one- and two-dimensional NMR experiments are required to deduce the existence of intramolecular HBs, if there are any. One of the most appealing NMR parameters that can help to understand HBs is the chemical shift. Solvent dilution experiments were carried out on all of the molecules, 1–6, in order to discriminate between weak inter- or intra-molecular interactions. The variation in δNH as a function of solvent dilution is shown in Fig. 2. It can be inferred from Fig. 2 that, irrespective of the extent of dilution by CDCl3 solvent, the values of δNH(1) and δNH(2) remain practically unchanged, confirming the absence of inter-molecular interactions or molecular aggregation. The chemical shift of residual monomeric water observed at 1.54 ppm in CDCl3 solvent displayed only a marginal drift of approximately 0.02 ppm in all of the investigated molecules during CDCl3 titrations, indicating the absence of any significant effect of monomeric water on the HBs.51HBs become strengthened upon cooling the sample52,53 and as a consequence deshielding occurs in the resonating frequency of the proton involved in the HB. Thus, for all of the molecules the temperature was systematically varied over 300–220 K and the shift in the resonating frequencies was monitored. The observed changes are shown in Fig. 3. It is evident from Fig. 3A and B that upon lowering the temperature the chemical shifts of the NH(1) and NH(2) protons are shifted towards the downfield region in all of the molecules, due to their displacement towards the HB acceptor. This can also be attributed to the shifting of the equilibrium towards the energetically preferred conformation. All of these observations also provide solid evidence for the existence of HBs in molecules 2–6. This type of trend was also observed for the unsubstituted molecule, 1, upon lowering the temperature, which may be attributed to the formation of a HB with the neighbouring CO group. Thus in all of the investigated molecules, the existence of bifurcated HBs is ascertained.
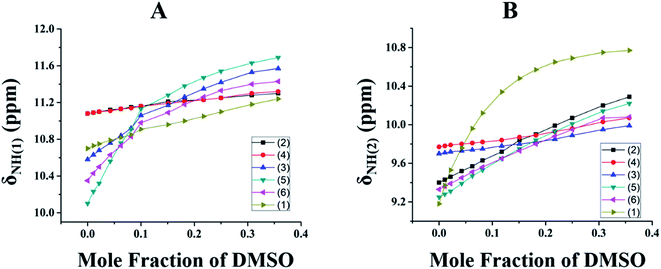
Titration experiments were carried out using a high polar solvent to estimate the relative strengths of the intramolecular HBs. Hence, titration experiments, using DMSO solvent, were carried out on all of the investigated molecules, 1–6. Since DMSO is a very good HB acceptor, it has a higher propensity to cleave a variety of intra- and inter-molecular HBs at the cost of a strong interaction between DMSO and the substrate. The observed downfield shift of δNH(1) and δNH(2) with the incremental addition of DMSO-d6![[thin space (1/6-em)]](https://www.rsc.org/images/entities/char_2009.gif) 54–56 confirms the rupturing of the intramolecular HB at the cost of strong intermolecular HB formation with the DMSO solvent (Fig. 4).
54–56 confirms the rupturing of the intramolecular HB at the cost of strong intermolecular HB formation with the DMSO solvent (Fig. 4).
Couplings between nuclear spins in the absence of a covalent bond
Often the couplings between two NMR active nuclei can be detected even in the absence of a chemical bond between them. In such situations the spin magnetization transfer is relayed through the HB.57–60 For molecules 2 and 4, a doublet was detected for the proton of NH(1) with a frequency separation of 13.4 Hz (Fig. 5a). This doublet pattern converged into a singlet in the 1H{19F} (fluorine decoupled 1H) spectrum (Fig. 5b) providing evidence for the magnetization transfer between F and the NH proton. This large frequency separation of 13.4 Hz as 5JFH, mediated through five covalent bonds, is generally unexpected and strongly supports the existence of a through space interaction mediated through the HB. Furthermore, the frequency separation of this doublet becomes diminished from 13.4 Hz to approximately 4 Hz (partially resolved doublet and hence the precise frequency separation cannot be measured) in the highly polar solvent DMSO-d6 (Fig. 5c) due to the weakening of the HB between the F and NH and at the cost of the simultaneous formation of a HB between DMSO and the NH proton. This also provides strong evidence for the existence of a HB between the NH proton and F. The corresponding spectrum for molecule 4 is reported in the ESI.† | ||
| Fig. 5 400 MHz 1H NMR spectra of molecule 2; (A) in CDCl3 solvent; (B) 19F decoupled in CDCl3 solvent; (C) in DMSO-d6 solvent. | ||
Simultaneous measurement of couplings among three NMR active nuclei
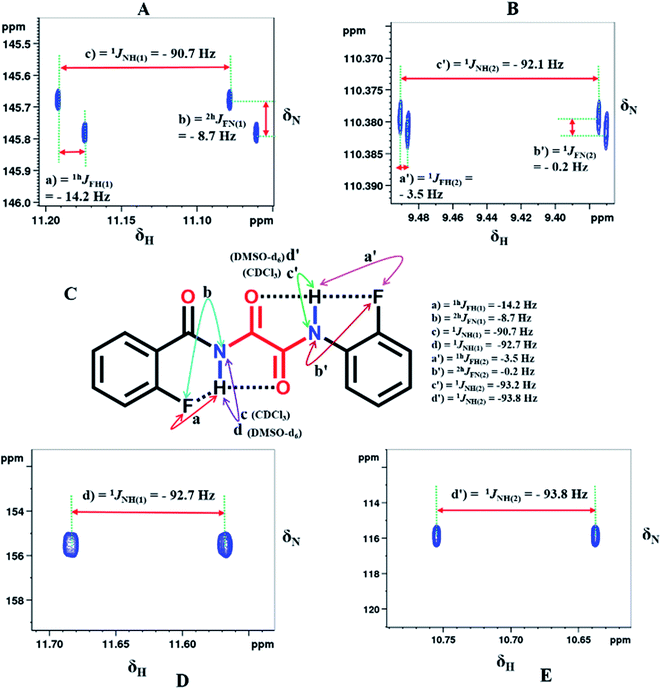
As mentioned earlier, the formation of a HB results in a 6-membered ring with the NH(1) proton and a 5-membered ring with the NH(2) proton. When the five-membered ring is formed the couplings between the NH proton and the NMR active fluorine nuclei are not reflected in the 1D 1H NMR spectrum due to a very small coupling strength which might be hidden in the very broad spectral line caused by quadrupolar 14N (molecules 2, 5 and 6). These couplings are detected in the 2D 15N–1H HSQC6,55 spectra where 15N is present in its natural abundance. Furthermore, when the three NMR active nuclei are coupled, it is conceptually impossible to observe the couplings between two passive NMR active nuclei from the conventional 1D NMR spectrum of any of these nuclei. On the other hand, the single 2D 15N–1H HSQC (NH coupled) spectrum permits the extraction of the couplings among all of the three nuclei. Hence the NH coupled 2D 15N–1H HSQC spectra were recorded in CDCl3 solvent. It may be pointed out that in the HSQC sequence, the magnetization is transferred to the protons, and the magnetization of the protons, which are attached to 15N, is transferred back and detected. All of the molecules yielded sharp peaks, consequent to the indirect detection of 15N. The NH coupled 2D 15N–1H HSQC spectra of molecule 2 in CDCl3 and DMSO-d6 solvents are shown in Fig. 6. The coupled heteronuclear single quantum spectra (15N–1H) for the remaining molecules are reported in the ESI.† From Fig. 6A and B, it is possible to extract all of the three possible couplings involving both the NH(1) and NH(2) protons, viz. 1JNH, 2hJFN and 1hJFH. The magnitudes of the measured couplings from both the 1H and 15N dimensions are shown in Fig. 6C along with the chemical structure of the molecule. In Fig. 6D and E, it can be seen that the 2hJFN and 1hJFH couplings involving both the NH protons disappeared and only 1JNH was retained, unequivocally substantiating that the measured couplings, 2hJFN and 1hJFH, in CDCl3 solvent are mediated through HBs.The strength of 1JNH and the nature of the HB
Scalar coupling 1JNH is a powerful tool that can indicate whether the HB is predominantly covalent or electrostatic. It is well established that in general the NH coupling strength increases for an electrostatic type and decreases for a covalent type of HB when compared to the coupling of a free group.61,62 The increase in 1JNH in an electrostatic type of HB is due to the gradual displacement of the proton towards the nitrogen atom resulting in the weakening of the NH⋯F HB. On the other hand, the decrease in 1JNH in a covalent type of HB is due to the gradual displacement of the NH proton towards the fluorine atom resulting in the strengthening of the NH⋯F HB. Hence, 1JNH for all of the investigated molecules was extracted from the NH coupled 15N–1H HSQC spectra in CDCl3 solvent and the derived values are shown in Table 1. When compared to the unsubstituted molecule, 1, in all of the other molecules an increase in the magnitude of 1JNH was detected, thereby confirming that the type of HB is electrostatic.| Molecule number | ΔδNH(1) (ppm) | ΔδNH(2) (ppm) | 1JNH(1) in CDCl3 solvent (Hz) | 1JNH(2) in CDCl3 solvent (Hz) | ||||
|---|---|---|---|---|---|---|---|---|
| Upon addition of 500 μL CDCl3 | Upon addition of 250 μL DMSO | On varying the temperature from 298 K to 230 K | Upon addition of 500 μL CDCl3 | Upon addition of 250 μL DMSO | On varying the temperature from 298 K to 230 K | |||
| 1 | −0.01 | 0.54 | 0.17 | −0.01 | 1.60 | 0.16 | −89.5 | −91.4 |
| 2 | 0.00 | 0.22 | 0.28 | 0.00 | 0.89 | 0.13 | −90.7 | −92.1 |
| 3 | 0.00 | 0.99 | 0.29 | 0.00 | 0.27 | 0.13 | −91.1 | −92.2 |
| 4 | 0.00 | 0.24 | 0.26 | 0.00 | 0.30 | 0.11 | −90.8 | −92.0 |
| 5 | −0.01 | 1.59 | 0.26 | 0.00 | 0.98 | 0.16 | −90.3 | −91.9 |
| 6 | −0.01 | 1.08 | 0.25 | −0.01 | 0.74 | 0.15 | −89.8 | −92.1 |
Energy of HBs
The energies of the HBs (EHB) for all of the studied molecules were calculated using an empirical relationship EHB =Δδ + (0.4 ± 0.2) (kcal mol−1),63–65 where Δδ is the difference in the chemical shifts of the hydrogen bonded and free proton. Δδ in the present work was derived by subtracting the resonance frequency of the NH proton of molecule 1 from the NH resonance frequencies of the molecules, 2–6, and the EHB values, calculated using the above relationship, are compiled in Table 3. The EHB values varied from 0.8 to 1 kcal mol−1 for the different molecules, indicating the presence of a weak type of HB interaction in all of the molecules. The calculated bond geometries, viz. the distances and angles of all of the examined molecules are shown in Table 2.| Molecule number | HB type (X⋯HN) | Distance dX⋯H | Distance dH–N | Angle XHN |
|---|---|---|---|---|
| 1 | (C![[double bond, length as m-dash]](https://www.rsc.org/images/entities/char_e001.gif) O⋯(1)HN) O⋯(1)HN) |
— | 1.014 | — |
(C![[double bond, length as m-dash]](https://www.rsc.org/images/entities/char_e001.gif) O⋯(2)HN) O⋯(2)HN) |
— | 1.015 | — | |
| 2 | (F⋯(1)HN) | 1.918 | 1.016 | 132.3 |
| (F⋯(2)HN) | 2.255 | 1.015 | 103.0 | |
| 3 | (Cl⋯(1)HN) | 2.765 | 1.015 | 102.6 |
| (Cl⋯(2)HN) | 2.456 | 1.016 | 111.2 | |
| 4 | (F⋯(1)HN) | 1.921 | 1.016 | 132.2 |
| (Cl⋯(2)HN) | 2.458 | 1.016 | 111.1 | |
| 5 | (CF3⋯(1)HN) | 2.454 | 1.016 | 114.0 |
| (F⋯(2)HN) | 2.256 | 1.015 | 103.0 | |
| 6 | (Br⋯(1)HN) | 3.027 | 1.015 | 96.7 |
| (F⋯(2)HN) | 2.256 | 1.015 | 103.0 |
DFT based computations
The NMR spectroscopically established weak molecular interactions were also supported by DFT-based theoretical calculations, using the Gaussian 09 suite of programs66 with the B3LYP/6-311 + g(d,p) basis set and default chloroform as the solvation medium. The minimum energy structures were optimized for all of the investigated molecules using the G09 setup mentioned above. By using these optimized minimum energy structures, the wave function (.wfn) files were generated for QTAIM47 and NCI46 calculations. The 1H NMR spectra were simulated using the GIAO method with identical parameters and minimum energy coordinates for all of the investigated molecules. For the calculation of the shielding constants, GaussView software was employed and the value of σ TMS was used as a reference. For obtaining the 1H chemical shift in ppm, the theoretically obtained σ value should be subtracted from the σ of TMS using the relationship given below.| δ (ppm) = σ TMS − σtheor |
The σ of TMS was calculated using the same parameters and level of calculation as was used for the molecules. This value is already contained in different NMR visualizing software like GaussView, ChemCraft etc. and is used as a reference.
It is clear from Table 3 that the theoretically calculated δNH for all of the molecules is comparable to the NMR findings.
| Molecule number | HB type (X⋯HN) | Electron density (ρ(r)) (a.u.) | Laplacian of electron density (∇2 × ρ(r)) | Energy of HB (EHB) (kcal mol−1) | Theoretically calculated value of δNH (ppm) | Experimental value of δNH (ppm) |
|---|---|---|---|---|---|---|
| 1 | (C![[double bond, length as m-dash]](https://www.rsc.org/images/entities/char_e001.gif) O⋯(1)HN) O⋯(1)HN) |
0.0210 | 0.0918 | — | 10.65 | 10.70 |
(C![[double bond, length as m-dash]](https://www.rsc.org/images/entities/char_e001.gif) O⋯(2)HN) O⋯(2)HN) |
— | — | — | 9.14 | 9.18 | |
| 2 | (F⋯(1)HN) | 0.0245 | 0.1048 | 0.8 | 11.41 | 11.09 |
| (F⋯(2)HN) | — | — | 0.6 | 9.53 | 9.40 | |
| 3 | (Cl⋯(1)HN) | 0.0108 | 0.0417 | 0.3 | 10.15 | 10.56 |
| (Cl⋯(2)HN) | 0.0160 | 0.0648 | 0.9 | 9.81 | 9.71 | |
| 4 | (F⋯(1)HN) | 0.0243 | 0.1041 | 0.8 | 11.43 | 11.08 |
| (Cl⋯(2)HN) | 0.0160 | 0.0647 | 1.0 | 9.76 | 9.76 | |
| 5 | (CF3⋯(1)HN) | 0.0091 | 0.0361 | −0.2 | 10.18 | 10.09 |
| (F⋯(2)HN) | — | — | 0.5 | 9.49 | 9.24 | |
| 6 | (Br⋯(1)HN) | 0.0097 | 0.0337 | 0.1 | 10.16 | 10.35 |
| (F⋯(2)HN) | — | — | 0.6 | 9.51 | 9.33 |
QTAIM calculations
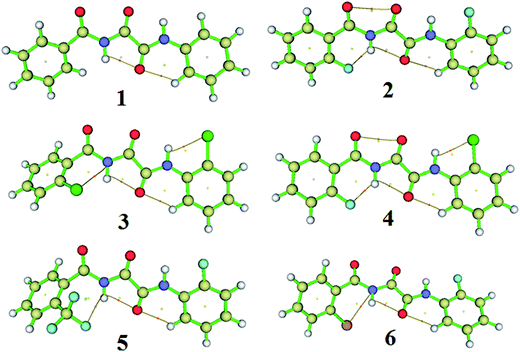
Quantum theory of atoms in molecules (QTAIM)47 studies were used for electron density analysis. At certain points, known as critical points (CPs), the gradient norm of the function value vanishes. The CPs can be classified into four types depending on the negative Eigenvalues of the Hessian matrix of the real space function. Among all the four types of CPs, the electron density at (3, −1) is labelled as the bond critical point (BCP) because it generally appears between a pair of attractive atoms. The molecular model containing the bond paths and the (3, −1) type BCP for all of the investigated molecules is given in Fig. 7. The bond path which joins the 2 atoms through the BCP indicates that both of the atoms are bonded. The electron density (ρ(r)) and the sign of the Laplacian of electron density (∇2 × ρ(r)) values determine the bond strength and bond type, respectively.47 Hence, the magnitudes of the electron density (ρ(r)) and the Laplacian of electron density (∇2 × ρ(r)) of all the investigated molecules at the (3, −1) type of BCP were obtained using QTAIM47 calculations. The electron density (HB) values for all of the molecules fall in the range from 0.0090 to 0.0250 a.u. The positive value of the Laplacian of electron density (∇2 × ρ(r)) at the (3, −1) type BCP provides evidence for the HB type of interactions. The calculated Laplacian of electron density (∇2 × ρ(r)) and electron density (ρ(r)) values are shown in Table 3.NCI calculations
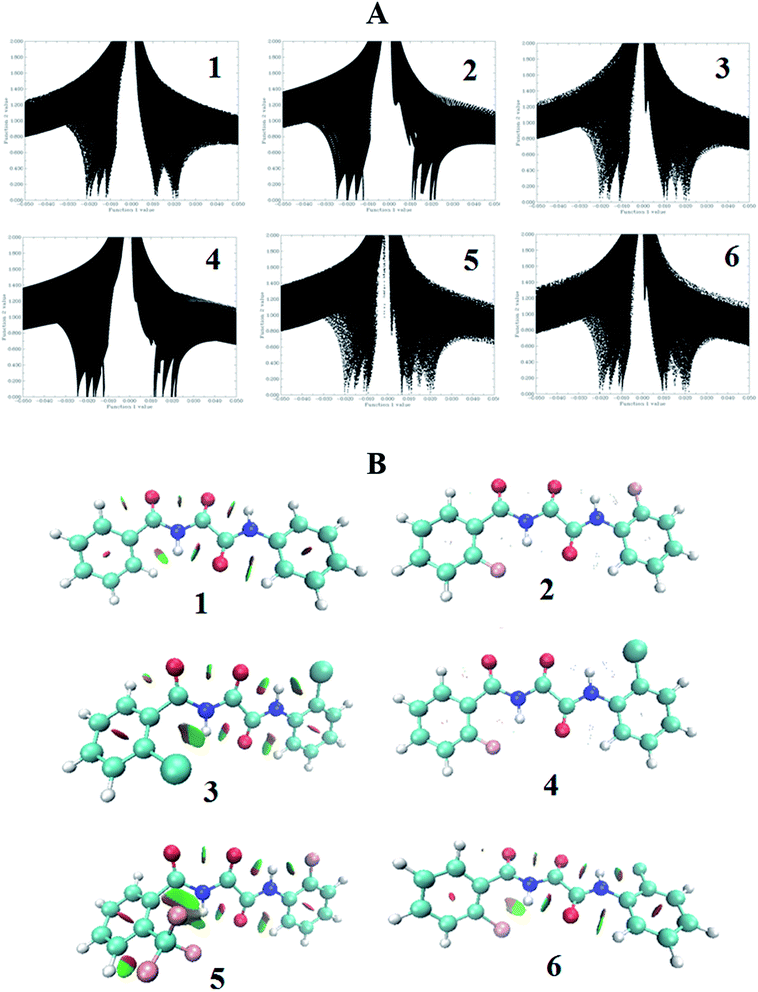
The electron density based non-covalent interaction (NCI) index provides visual information about weak molecular interactions, such as, van der Waals, HBs, steric repulsion, etc.67 The NCI-based grid points were calculated and plotted using the Multiwfn68 program for the functions, such as, sign(λ2(r))ρ(r) as function 1 and the reduced density gradient (RDG) as function 2, as shown in Fig. 8A. Both the functions contain information about the HB. For molecules 1 and 2, it can be seen that on the left hand side there are four spikes in the grid plots, which indicates four types of HB, viz. two of the type C–H⋯O![[double bond, length as m-dash]](https://www.rsc.org/images/entities/char_e001.gif) C and one each of the type N–H(1)⋯O
C and one each of the type N–H(1)⋯O![[double bond, length as m-dash]](https://www.rsc.org/images/entities/char_e001.gif) C and N–H(2)⋯O
C and N–H(2)⋯O![[double bond, length as m-dash]](https://www.rsc.org/images/entities/char_e001.gif) C. Two more expected spikes for N–H(1)⋯F and N–H(2)⋯F in molecule 2 are indistinguishable, which could be because they have overlapped with the other spikes. On the other hand, molecules 3, 4, 5 and 6 exhibit five spikes representing the five HBs, two of the type C–H⋯O
C. Two more expected spikes for N–H(1)⋯F and N–H(2)⋯F in molecule 2 are indistinguishable, which could be because they have overlapped with the other spikes. On the other hand, molecules 3, 4, 5 and 6 exhibit five spikes representing the five HBs, two of the type C–H⋯O![[double bond, length as m-dash]](https://www.rsc.org/images/entities/char_e001.gif) C, and one each of the type N–H(1)⋯O
C, and one each of the type N–H(1)⋯O![[double bond, length as m-dash]](https://www.rsc.org/images/entities/char_e001.gif) C, N–H(2)⋯O
C, N–H(2)⋯O![[double bond, length as m-dash]](https://www.rsc.org/images/entities/char_e001.gif) C and N–H(1)⋯X. For the set of molecules, 3, 4, 5 and 6, another expected spike of the type N–H(2)⋯X is missing which might again be overlapped with any one of the other spikes. For molecule 5, one more spike in the middle of the graph appeared representing the C–H⋯F–C type of van der Waals interaction. Interestingly the C
C and N–H(1)⋯X. For the set of molecules, 3, 4, 5 and 6, another expected spike of the type N–H(2)⋯X is missing which might again be overlapped with any one of the other spikes. For molecule 5, one more spike in the middle of the graph appeared representing the C–H⋯F–C type of van der Waals interaction. Interestingly the C![[double bond, length as m-dash]](https://www.rsc.org/images/entities/char_e001.gif) O⋯O
O⋯O![[double bond, length as m-dash]](https://www.rsc.org/images/entities/char_e001.gif) C steric type of interaction was also detected in all of the investigated molecules. Using the VMD69 program the colour filled isosurface graphs were also plotted for all of the optimized minimum energy structures and they are reported in Fig. 8B. All of the above discussed interactions can be clearly visualized in these colour filled isosurface plots of molecules 1–6.
C steric type of interaction was also detected in all of the investigated molecules. Using the VMD69 program the colour filled isosurface graphs were also plotted for all of the optimized minimum energy structures and they are reported in Fig. 8B. All of the above discussed interactions can be clearly visualized in these colour filled isosurface plots of molecules 1–6.
QTAIM calculations did not reveal the intramolecular BCPs and bond paths for the F⋯H(2)N type of interaction in molecules 2, 5 and 6, disagreeing with the NMR results. On the other hand, the NCI calculations provided information on the weak molecular interaction, which is in good agreement with the NMR findings. Both the experimental and theoretical observations convincingly establish that the proposed conformations are the only energetically favored conformations.
Conclusions
The extensive utility of one-dimensional and two-dimensional NMR experimental methods revealed the existence of intramolecular hydrogen bonds in all of the synthesized benzoyl phenyl oxalamide derivatives. The two dimensional HOESY experiments revealed the spatial proximity, a pre-requisite for establishing a hydrogen bond. From the NMR experiments, it can be unambiguously concluded that the intramolecular hydrogen bonds govern the stable conformations of all the molecules. The couplings between NMR active nuclei involved in a HB, where the magnetization transfer is mediated through the HB were determined in the fluorine containing molecules. The magnitudes and signs of the through space couplings among three NMR active nuclei were determined using single 15N–1H HSQC experiments. The strengths of the NH scalar couplings revealed the electrostatic nature of the hydrogen bond. The chemical shift difference of the NH proton has been employed to calculate the energy of the HB. The NMR experimental findings have been corroborated by Density Functional Theory (DFT)-based Non Covalent Interactions (NCIs) and Quantum Theory of Atoms In Molecules (QTAIM) calculations. The experimental and theoretical studies unequivocally establish that the proposed conformation for each molecule is the only energetically favored conformation.Experimental section
Synthesis of benzoyl phenyl oxalamides
Commercially available reactants of high purity were purchased and used without any further purification. AR grade THF solvent was used in the synthesis. All of the reactants were used in a 1![[thin space (1/6-em)]](https://www.rsc.org/images/entities/char_2009.gif) :
:![[thin space (1/6-em)]](https://www.rsc.org/images/entities/char_2009.gif) 1
1![[thin space (1/6-em)]](https://www.rsc.org/images/entities/char_2009.gif) :
:![[thin space (1/6-em)]](https://www.rsc.org/images/entities/char_2009.gif) 1 ratio. The calculated amount of oxalyl chloride (C) dissolved in tetrahydrofuran (THF) was placed in a round bottom flask. The calculated amounts of benzamide (A) and aniline (B) derivatives were also separately dissolved in THF. Firstly, solution (A) was added to solution (C), followed by solution (B). The RBF was fitted with a CaCl2 guard tube to vent the HCl gas. The reaction was monitored using TLC at regular intervals. The reaction was carried out under dilute conditions in order to minimize the reaction between two amides or anilines. The product was purified using column chromatography with an ethyl acetate/hexane solvent system with a polarity gradient. The details of the synthesis of the six benzoyl phenyl oxalamides are given in the ESI.† To the best of our knowledge this method for the synthesis of benzoyl phenyl oxalamides has not been reported in the literature.
1 ratio. The calculated amount of oxalyl chloride (C) dissolved in tetrahydrofuran (THF) was placed in a round bottom flask. The calculated amounts of benzamide (A) and aniline (B) derivatives were also separately dissolved in THF. Firstly, solution (A) was added to solution (C), followed by solution (B). The RBF was fitted with a CaCl2 guard tube to vent the HCl gas. The reaction was monitored using TLC at regular intervals. The reaction was carried out under dilute conditions in order to minimize the reaction between two amides or anilines. The product was purified using column chromatography with an ethyl acetate/hexane solvent system with a polarity gradient. The details of the synthesis of the six benzoyl phenyl oxalamides are given in the ESI.† To the best of our knowledge this method for the synthesis of benzoyl phenyl oxalamides has not been reported in the literature.
NMR experiments
All of the spectra were obtained using 400, 500 and 800 MHz NMR spectrometers. Tetramethylsilane (TMS) was used as an internal reference for both 1H and 13C NMR spectra. CDCl3 and DMSO-d6 solvents were purchased and used as received. The synthesized molecules were characterized using various NMR experiments and ESI-MS techniques. The two-dimensional NMR experiments, such as HSQC and HOESY, were acquired using the standard pulse programs available in the NMR spectrometer’s library. All of the experiments were carried out at ambient temperature (298 K) unless otherwise mentioned.Conflicts of interest
There are no conflicts to declare.Acknowledgements
PD would like to thank CSIR for the Senior Research Fellowship. SKM thanks IISC for RA. NS gratefully acknowledges the generous financial support given by the Science and Engineering Research Board (SERB), New Delhi (Grant Number: EMR/2015/002263).References
- G. C. Pimentel and A. L. McClellan, Annu. Rev. Phys. Chem., 1971, 22, 347–385 CrossRef CAS.
- G. C. Pimentel and A. L. McClellan, The Hydrogen Bond, W. H. Freeman and Company, San Francisco, California, 1960 Search PubMed.
- G. R. Desiraju and T. Steiner, The Weak Hydrogen Bond, Oxford University Press, New York, 1999 Search PubMed.
- J. Zheng, K. Kwak, X. Chen, J. B. Asbury and M. D. Fayer, J. Am. Chem. Soc., 2006, 128, 2977–2987 CrossRef CAS PubMed.
- G. A. Jeffrey, An Introduction to Hydrogen Bonding, Oxford University Press, New York, 1997 Search PubMed.
- S. K. Mishra and N. Suryaprakash, RSC Adv., 2015, 5, 86013–86022 RSC.
- A. R. Sanford, K. Yamato, X. Yang, L. Yuan, Y. Han and B. Gong, Eur. J. Biochem., 2004, 271, 1416–1425 CrossRef CAS PubMed.
- J. W. Lockman, N. M. Paul and J. R. Parquette, Prog. Polym. Sci., 2005, 30, 423–452 CrossRef CAS.
- I. Muegge, S. L. Heald and D. Brittelli, J. Med. Chem., 2001, 44, 1841–1846 CrossRef CAS PubMed.
- B. E. Smart, J. Fluorine Chem., 2001, 109, 3–11 CrossRef CAS.
- D. Chopra and T. N. G. Row, CrystEngComm, 2011, 13, 2175–2186 RSC.
- G. R. Desiraju, J. Am. Chem. Soc., 2013, 135, 9952–9967 CrossRef CAS PubMed.
- K. Reichenbacher, H. I. Suss and J. Hulliger, Chem. Soc. Rev., 2005, 34, 22–30 RSC.
- R. Banerjee, G. R. Desiraju, R. Mondal and J. A. K. Howard, Chem.–Eur. J., 2004, 10, 3373–3383 CrossRef CAS PubMed.
- C. Li, S.-F. Ren, J.-L. Hou, H.-P. Yi, S.-Z. Zhu, X.-K. Jiang and Z.-T. Li, Angew. Chem., Int. Ed., 2005, 44, 5725–5729 CrossRef CAS PubMed.
- D. Chopra, Cryst. Growth Des., 2011, 12, 541–546 Search PubMed.
- D. Dunitz, ChemBioChem, 2004, 5, 614–621 CrossRef PubMed.
- J. D. Dunitz and R. Taylor, Chem.–Eur. J., 1997, 3, 89–98 CrossRef CAS.
- J. A. K. Howard, V. J. Hoy, D. O’Hagan and G. T. Smith, Tetrahedron, 1996, 52, 12613–12622 CrossRef CAS.
- P. A. Champagne, J. Desroches and J.-F. Paquin, Synthesis, 2015, 47, 306–322 CAS.
- P. Dhanishta, S. K. Mishra and N. Suryaprakash, J. Phys. Chem. A, 2018, 122, 199–208 CrossRef CAS PubMed.
- S. K. Mishra and N. Suryaprakash, Molecules, 2017, 22, 423 CrossRef PubMed.
- E. Kareev, G. S. Quiñones, I. V. Kuvychko, P. A. Khavrel, I. N. Ioffe, I. V. Goldt, S. F. Lebedkin, K. Seppelt, S. H. Strauss and O. V. Boltalina, J. Am. Chem. Soc., 2005, 127, 11497–11504 CrossRef PubMed.
- G. K. S. Prakash, F. Wang, M. Rahm, J. Shen, C. Ni, R. Haiges and G. A. Olah, Angew. Chem., Int. Ed., 2011, 50, 11761–11764 CrossRef CAS PubMed.
- T. Steiner, Angew. Chem., Int. Ed., 2002, 41, 48–76 CrossRef CAS.
- P. Auffinger and E. Westhol, J. Mol. Biol., 1999, 292, 467–483 CrossRef CAS PubMed.
- H. C. M. Nelson, J. T. Finch, B. F. Luisi and A. Klug, Nature, 1987, 330, 221–226 CrossRef CAS PubMed.
- M. Sundaralingam and Y. C. Sekharudu, Science, 1989, 244, 1333–1337 CAS.
- R. Taylor, O. Kennard and W. Versichel, J. Am. Chem. Soc., 1984, 106, 244–248 CrossRef CAS.
- S.-G. Kim, K.-H. Kim, Y. K. Kim, S. K. Shin and K. H. Ahn, J. Am. Chem. Soc., 2003, 125, 13819–13824 CrossRef CAS PubMed.
- E. Kareev, G. S. Quiñones, I. V. Kuvychko, P. A. Khavrel, I. N. Ioffe, I. V. Goldt, S. F. Lebedkin, K. Seppelt, S. H. Strauss and O. V. Boltalina, J. Am. Chem. Soc., 2005, 127, 11497–11504 CrossRef PubMed.
- G. K. Surya Prakash, F. Wang, M. Rahm, J. Shen, C. Ni, R. Haiges and G. A. Olah, Angew. Chem., Int. Ed., 2011, 50, 11761–11764 CrossRef PubMed.
- A. Lakshmipriya and N. Suryaprakash, J. Phys. Chem. A, 2016, 120, 7810–7816 CrossRef CAS PubMed.
- T. S. Mao, A. L. Grossberg and D. Pressman, Mol. Pharmacol., 1969, 5, 100–103 CAS.
- E. F. Montero-Vázquez, F. J. Martínez-Martínez, I. I. Padilla-Martínez, M. A. Carvajal-García and J. Hernández-Díaza, ARKIVOC, 2008, 2008, 276–282 Search PubMed.
- F. J. Martínez-Martínez, I. I. Padilla-Martínez, M. A. Brito, E. D. Geniz, R. C. Rojas, J. B. R. Saavedra, H. Höpfl, M. Tlahuextl and R. Contreras, J. Chem. Soc., Perkin Trans. 2, 1998, 401–406 RSC.
- C. Aleman and J. Casanovas, J. Mol. Struct., 2004, 675, 9 CrossRef CAS.
- H. O. Desseyn, S. P. Perlepes, K. Clou, N. Blaton, B. J. V. D. Veken, R. Dommisse and P. E. Hansen, J. Phys. Chem., 2004, 108, 5175 CrossRef CAS.
- S. Nowick, J. H. Tsai, Q.-C. Bui and S. Maitra, J. Am. Chem. Soc., 1999, 121, 8409–8410 CrossRef.
- Y. Liu, A. H. W. Lam, F. W. Fowler and J. W. Lauher, Mol. Cryst. Liq. Cryst., 2002, 389, 39–46 CrossRef CAS.
- J. Makarevic, M. Jokic, Z. Raza, V. Caplar, Z. S. Katalenic, B. Kojic-Prodic and M. Zinic, Croat. Chem. Acta, 2004, 77, 403–414 CAS.
- C. McFarland, D. A. Vivic and A. V. Debnath, Synthesis, 2006, 5, 807–812 Search PubMed.
- C. M. Costa, J. R. S. Maia, G. M. De Lima and J. D. Ardisson, Main Group Met. Chem., 2004, 27, 247–258 CrossRef.
- W. Kohn and L. J. Sham, Phys. Rev., 1965, 140, A1133–A1138 CrossRef.
- R. G. Parr and W. Yang, Density-Functional Theory of Atoms and Molecules, Oxford University Press, New York, 1989 Search PubMed.
- J. Contreras-Garcia, W. Yang and E. R. Johnson, J. Phys. Chem. A, 2011, 115, 12983–12990 CrossRef CAS PubMed.
- R. F. W. Bader, Atoms in Molecules: A Quantum Theory, Oxford University Press, Oxford, 1990 Search PubMed.
- C. Yu and G. C. Levy, J. Am. Chem. Soc., 1983, 105, 6994–6996 CrossRef CAS.
- C. Yu and G. C. Levy, J. Am. Chem. Soc., 1984, 106, 6533–6537 CrossRef CAS.
- P. L. Rinaldi, J. Am. Chem. Soc., 1983, 105, 5167–5168 CrossRef CAS.
- A. E. Reed, L. A. Curtiss and F. Weinhold, Chem. Rev., 1988, 88, 899–926 CrossRef CAS.
- S. H. Gellman, B. R. Adams and G. P. Dado, J. Am. Chem. Soc., 1990, 112, 460–461 CrossRef CAS.
- S. H. Gellman, G. P. Dado, G. B. Liang and B. R. Adams, J. Am. Chem. Soc., 1991, 113, 1164–1173 CrossRef CAS.
- G. N. M. Reddy, M. V. V. Kumar, T. N. G. Row and N. Suryaprakash, Phys. Chem. Chem. Phys., 2010, 12, 13232–13237 RSC.
- S. K. Mishra and N. Suryaprakash, Phys. Chem. Chem. Phys., 2015, 17, 15226–15235 RSC.
- K. Divya, S. Hebbar and N. Suryaprakash, Chem. Phys. Lett., 2012, 525–526, 129–133 CrossRef.
- M. Nakahara and C. Wakai, Chem. Lett., 1992, 809–812 CrossRef CAS.
- T. Axenrod, P. S. Pregosin, M. J. Wieder, E. D. Becker, R. B.Bradley and G. W. A. Milne, J. Am. Chem. Soc., 1971, 93, 6536–6541 CrossRef CAS.
- A. J. Dingley, J. E. Masse, R. D. Peterson, M. Barfield, J. Feigon and S. Grzesiek, J. Am. Chem. Soc., 1999, 121, 6019–6027 CrossRef CAS.
- A. Dunger, H.-H. Limbach and K. Weisz, J. Am. Chem. Soc., 2000, 122, 10109–10114 CrossRef CAS.
- G. Shenderovich, P. M. Tolstoy, N. S. Golubev, S. N. Smirnov, G. S. Denisov and H.-H. Limbach, J. Am. Chem. Soc., 2003, 125, 11710–11720 CrossRef PubMed.
- S. Golubev, I. G. Shenderovich, S. N. Smirnov, G. S. Denisov and H.-H. Limbach, Chem.–Eur. J., 1999, 5, 492–497 CrossRef.
- T. Schaefer, J. Phys. Chem., 1975, 79, 1888–1890 CrossRef CAS.
- D. Rusinska-Roszak, J. Phys. Chem. A, 2015, 119, 3674–3687 CrossRef CAS PubMed.
- A. V. Afonin, A. V. Vashchenko and M. V. Sigalov, Org. Biomol. Chem., 2016, 14, 11199–11211 CAS.
- J. Frisch, G. W. Trucks, H. B. Schlegel, G. E. Scuseria, M. A. Robb, J. R. Cheeseman, G. Scalmani, V. Barone, B. Mennucci, G. A. Petersson, H. Nakatsuji, M. Caricato, X. Li, H. P. Hratchian, A. F. Izmaylov, J. Bloino, G. Zheng, J. L. Sonnenberg, M. Hada, M. Ehara, K. Toyota, R. Fukuda, J. Hasegawa, M. Ishida, T. Nakajima, Y. Honda, O. Kitao, H. Nakai, T. Vreven, J. A. Montgomery Jr, J. E. Peralta, F. Ogliaro, M. J. Bearpark, J. Heyd, E. N. Brothers, K. N. Kudin, V. N. Staroverov, R. Kobayashi, J. Normand, K. Raghavachari, A. P. Rendell, J. C. Burant, S. S. Iyengar, J. Tomasi, M. Cossi, N. Rega, N. J. Millam, M. Klene, J. E. Knox, J. B. Cross, V. Bakken, C. Adamo, J. Jaramillo, R. Gomperts, R. E. Stratmann, O. Yazyev, A. J. Austin, R. Cammi, C. Pomelli, J. W. Ochterski, R. L. Martin, K. Morokuma, V. G. Zakrzewski, G. A. Voth, P. Salvador, J. J. Dannenberg, S. Dapprich, A. D. Daniels, Ö. Farkas, J. B. Foresman, J. V. Ortiz, J. Cioslowski and D. J. Fox, Gaussian, Inc., Wallingford, CT, USA, 2009.
- E. R. Johnson, S. Keinan, P. Mori-Sánchez, J. Contreras-García, A. J. Cohen and W. Yang, J. Am. Chem. Soc., 2010, 132, 6498–6506 CrossRef CAS PubMed.
- T. Lu and F. Chen, J. Comput. Chem., 2012, 33, 580–592 CrossRef CAS PubMed.
- W. Humphrey, A. Dalke and K. Schulten, J. Mol. Graphics, 1996, 14, 33–38 CrossRef CAS PubMed.
Footnote |
| † Electronic supplementary information (ESI) available. See DOI: 10.1039/c8ra00357b |
| This journal is © The Royal Society of Chemistry 2018 |

