 Open Access Article
Creative Commons Attribution 3.0 Unported Licence
Direct automatic determination of the methanol content in red wines based on the temperature effect of the KMnO4/K2S2O5/fuchsin sodium sulfite reaction system
Yong-Sheng Li *a,
La-Mei Moa and
Xiu-Feng Gaob
aSchool of Chemical Engineering, Sichuan University, Chengdu 6100651, China. E-mail: lysgxf2005@qq.com
bWest China School of Basic Medical Sciences & Forensic Medicine, Sichuan University, Chengdu 610065, China. E-mail: xiufengg@163.com
First published on 23rd February 2018
Abstract
The standard method for methanol assay in wine is based on a methanol/KMnO4/H2C2O4/fuchsin sodium sulfite (FSS) reaction system. However, it is difficult to control the degree of colour and the temperature of the reaction product in this assay, and its repeatability is also poor due to the generation of CO and CO2 in the reaction. Therefore, to solve these problems, potassium metabisulfite was selected to replace H2C2O4, and an automatic analysis method was developed which can realize rapid and accurate determination of methanol and can be used to make an online analyzer. It was discovered that the reactions of methanol/KMnO4 and acetaldehyde/FSS are exothermic, while the reactions of methanol/KMnO4 and formaldehyde/FSS are endothermic. Consequently, based on the temperature effect, not only was the interference of ethanol eliminated in detecting methanol in wines, the purpose of the research was achieved to directly and accurately determine methanol without sample pretreatment. By optimizing the system, the obtained conditions for determining methanol in wines were as follows: 20 g L−1 concentration for KMnO4; 3 g L−1 concentration for FSS; 40 cm length for the first reaction coil (RC1); 100 cm length for RC2; 700 cm (I.D.: 0.8 mm) length for RC3; 50 °C for RC3; about 20 °C for RC1 and RC2; 330 μL for the sample volume. The method showed a linear response in the range 25–1000 mg L−1, with a 0.6% RSD, 8.8 mg L−1 detection limit and 25 samples per h, and was successfully used for testing representative wine samples. It also obtained better accuracy than previous methods. Due to its superiority in automated operation, reproducibility, analysis speed and test cost, this method and system can serve as a supplementary standard for methanol assay, and for the quality control of the winemaking process and the final wine-product, as well as for low-alcohol drinks.
Introduction
Methanol in wines mainly comes from the hydrolysis of pectic substances1 in raw materials and from the deamination of amino acids. The growth of mildew on fermentation materials also produces methanol. In order to improve grape juice yield, pectinase is often added in the fermentation process of wine, but this makes the carboxyl methyl ester in grapes further degrade to methanol.2 Methanol in the human body may cause headaches, nausea, blurred vision and so on.3 In addition, methanol can cause serious metabolic poisoning of the body.4,5 Therefore, the content of methanol during fermented-drink production must be strictly controlled.6 Regulations7 require that the methanol content in red wine is less than 400 mg L−1, where the ethanol content is controlled in the range 9.5–15%. Wine is also recognized as a good drink,8 and its consumption significantly increases with humans in improved living standards. Therefore, in order to ensure our health, the determination of the methanol content in wine is very important.Currently, the methods for determining the methanol content in wine consist of Fourier-transform infrared spectroscopy,9 gas chromatography (GC),10–13 enzyme-electrode methods,14,15 high performance liquid chromatography (HPLC),16 fluorimetry,17 etc.
Garrigues et al.9 researched the simultaneous determination of methanol and ethanol amounts in wine. In their method, methanol and ethanol in wine were firstly volatilized out by heating and then introduced into the infrared spectrometer, but the method was not sensitive enough for the determined target.
A reported enzyme-electrode method14 applied a certain electric current onto a platinum electrode which acted by modifying alcohol oxidase (AOD). Alcohols were electrolyzed to form H2O under the AOD catalysis. The current change on the electrode in the process was used for the indirect quantitation of alcohols. Although this method was high in sensitivity and selectivity, foreign substances affected the electric current signal from the alcohols. Besides this, Kuo et al.17 reported a HPLC method for determining methanol in wine, in which the wine samples needed a complex pre-treatment process which resulted in complication of the analysis process and an increase in analysis time.
The flow-injection analysis (FIA)18,19 has the advantages of requiring a low dosage of reagent and sample (20–200 μL), having a fast analysis speed (30–300 sample/time), having good reproducibility (RSD < 1.5%), and being able to combine with various detectors20–27 or enzyme reactors28,29 to make the manual analysis change into automatic analysis. Therefore, it has been widely applied in various analysis and monitoring fields. Fluorimetry based on FIA for methanol was reported once,30 in which the authors utilized an immobilized enzyme reactor which was made of alcohol oxidase/catalase (AOD/CAT) and a formaldehyde dehydrogenase (FDH). The method principle was that under catalysis of AOD and CAT, methanol is oxidized by dissolved oxygen to formaldehyde and H2O2, following which the formed H2O2 again participated in oxidization of methanol into formaldehyde, and then in catalysis of FDH. The created formaldehyde is further oxidized by NAD+ to formic acid and NADH which has a fluorescence feature, and finally, the methanol content is indirectly quantified by the fluorescence intensity of NADH (λex = 340 nm; λem = 460 nm). However, the method was not used to determine the methanol content in actual red wines or distilled spirits.
Based on the catalytic reaction of AOD and POD, as well as the reaction of H2O2 with 4-amidopyrine/phenol to generate a coloured product (470 nm), Almuzara et al.31 reported a stop-flow reversed-FIA system to determine methanol in Pichia pastoris fermentation that was producing a heterologous protein, but it also was not used for determining methanol in red wines. Besides, as these methods used free liquid enzymes, this would lead to an increase in consumption of expensive enzymes and test cost.
At present, the test methods for methanol in wine are mainly gas chromatography32 and manual colorimetry33 based on fuchsin sodium sulfite (FSS),34 and the latter is the most commonly used. However, it has some disadvantages, namely, a complicated operation, an unstable colour development and poor reproducibility, as well as being time-consuming.
The analytical principle for the FSS reagent is that methanol in acid medium is oxidized by KMnO4 to create formaldehyde. The redundant KMnO4 in the reaction system is reduced by adding oxalic acid, and finally, the formed formaldehyde conducts the colour reaction with FSS to create a coloured product. Some research also attempted to improve the colour reaction. Ethyl acetoacetate,35 chromotropic acid36 and phloroglucin37 were once used as the colour reagent, but the effect still was not ideal. Also, using formaldehyde to catalyze the reaction between crystal violet and potassium bromate to analyze methanol was attempted,38,39 but the anionic interference was large, so it was not successful in determining the methanol content in wine.
If using GC, before introducing them into the analytical instrument, the wine samples must first be distilled,40 which will be time-consuming and cost-increasing in tests. Therefore, it is not suitable for the monitoring of the fermentation process and wine production lines, popularization and application at the grass-roots units. Therefore, this research was conducted to solve the related problems.
Experimental
Reagents and instruments
The main reagents which were used in the research were alkaline fuchsin (C20H19N3, Tianjin Damao), methanol, Na2SO3, concentrated HCl, H2SO4 and H3PO4, KMnO4 (Chengdu, Kelon), and potassium metabisulphite (Tianjin, Zhiyuan). The water used in the experiment was ultra-purified water (conductivity: 0.065 μS cm−1) and all the reagents used were analytically pure.The following wine samples were purchased: Changyu Cabernet, Ruby Cabernet (China Great Wall, production license number: QS370615020101, QS1300315020006), Muscat, Cabernet Sauvignon (Qingdao, Daze, Yinjia wine factory, production license number: 370215021229, 370215021229), and Gorelli (Georgia).
The analytical instruments and equipment used in the research were as follows: a FIA-3110 type flow-injection processor, a UV-1800PC spectrophotometer with a flow-through cell (Shanghai, Mapada), an AUW120D-type electronic balance (Shimadzu, Japan), an ASB-200 type thermostat (Japan, Jasco), an Aike KL-UP-IV-10 type purified-water device (Chengdu, Kangning), an SC-3000B-011ST type GC (Chongqing, Chuanyi) with a hydrogen flame detector, and a CH-1 type high pure hydrogen generator (Wuhan, Kelin Pufeng).
Reagent preparation
Methanol storage solution (1.0 g L−1): 630 μL of pure methanol solution was added to a 500 mL volumetric flask and diluted to the marker with water. The solution was then stored in a brown reagent bottle with a cover.Methanol standard solutions: 20, 40, 60 and 80 mL of the methanol stock solution were separately added to 100 mL volumetric flasks and diluted to the required volume with water. The obtained methanol standards were respectively 0.2, 0.4, 0.6 and 0.8 g L−1.
Methanol oxidation reagent: 10 g of KMnO4 was dissolved in 250 mL of 0.6 mol L−1 H2SO4, into which, 250 mL of H3PO4 (30%, v/v) was also added. The mixed liquid was stored in a brown bottle.
Fading reagent for KMnO4: 40 g of potassium metabisulphite was dissolved in a beaker and diluted to 500 mL with water.
Chromogenic reagent (Schiff reagent): 1.5 g of fuchsin was dissolved in a beaker with 400 mL of water that was at about 80 °C. 15 g of Na2SO3 was added after the fuchsin solution was cooled. Subsequently, the mixture solution was filtered to obtain its filtrate, and 30 mL of 1.0 mol L−1 HCl was again added in the filtrate which was diluted to 500 mL with water. After leaving for 24 h in the dark and adding 0.25–0.5 g of activated carbon, the latter mixed solution was shaken and filtered again. Finally, a colourless reaction reagent (C20H19N3S3O7HCl) was obtained. Before using, the solution, which was preserved in a 4 °C refrigerator, must return to room temperature.
Determination principle for methanol
Methanol in acid medium is first oxidized by KMnO4 into formaldehyde. The formaldehyde then reacts with FSS to form a colourless transitional product that then continues to react with FSS to become a coloured product of blue-violet quinoid (590 nm). Finally, the methanol content in wines is indirectly quantified by detecting the absorbance of the coloured product. The proposed automatic analysis system in Fig. 1 involves the following reaction steps.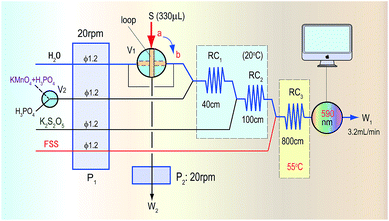 | ||
| Fig. 1 The automatic analysis flow diagram for determination of methanol based on the KMnO4/K2S2O5/FSS reaction system and FIA. | ||
In the presence of phosphoric acid, the sample containing methanol (CH3OH) was injected into the system, where it quickly reacted with KMnO4 to form formaldehyde (CH2O):
| 5CH3OH + 2KMnO4 + 4H3PO4 → 2MnHPO4 + 5CH2O + 2KH2PO4 + 8H2O | (1) |
When the redundant KMnO4 met the K2S2O5 that was continuously introduced into the system, the colour of KMnO4 itself faded. This avoided affecting the subsequent colour-producing reaction:
| 12KMnO4 + 15K2S2O5 + 2H3PO4 → 12MnSO4 + 18K2SO4 + 2K3PO4 + 3H2O | (2) |
The formaldehyde formed in the previous step reacted with FSS (C20H21N3S3O7Cl) to form the final aubergine coloured product (C22H24N3S2O6Cl), but this reaction is slow and needs to be heated up:
| 2HCHO + C20H21N3S3O7Cl → C22H24N3S2O6Cl + HSO3− | (3) |
Finally, the methanol content is indirectly quantified according to the absorbance of the coloured product.
Analysis system and operation processes
When the sampling valve (V1) in Fig. 1 was in the load position (the a-position in Fig. 1), the second pump (P2) started to take up the sample containing methanol into the loop and to conduct quantitative sampling, during which the redundant sample was discarded (W2). At the same time, the mixing reagent of KMnO4/H3PO4 used for oxidizing methanol by a switch valve (V2), K2S2O5 and the FSS solution were pushed by the first pump (P1) into the first reaction coil (RC1), the second reaction coil (RC2) and the third reaction coil (RC3) in the system, respectively, where these reagents were mixed and could react. Finally, the mixture was pushed into a flow-through photometric detector to obtain a stable baseline signal, which was used as the reagent blank.When the sampling valve was switched to the injection position (the b-position in Fig. 1), a sample plug containing methanol within the loop was pushed by the water carrier into RC1, where the mixing reagent of KMnO4/H3PO4 reacted with methanol to generate formaldehyde. Subsequently in RC2 the redundant KMnO4 was faded by K2S2O5 to avoid the colour of KMnO4 affecting the absorbance of the coloured product that was formed in the final reaction. Then, the formaldehyde generated in RC1 flowed through RC2 and merged with FSS in RC3 to form the coloured product, which was detected as it flowed into the detector at 590 nm. Finally, the methanol content in the sample was determined according to the absorbance value of the coloured product. In determining the methanol content of real red wines, to avoid interference from the original colour of the wine, only the H3PO4 solution was introduced by the switch valve (V2) into the system to obtain a blank absorbance related to the reagent and samples. The methanol content in the sample was then determined by using the absorbance difference of the coloured product.
Results and discussion
Examination of reducing agent types
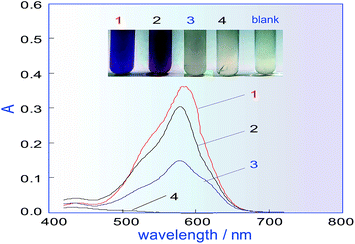
In the manual chromogenic method,33 H2C2O4 must be used to reduce the excess KMnO4 after KMnO4 has oxidized methanol to formaldehyde, during which CO and CO2 gas are inevitably generated. However, if there is gas in the system shown in Fig. 1, this will seriously affect the system repeatability, so a different reductant must be selected to replace H2C2O4. Some frequently used reductants, like ascorbic acid (AsA), Na2SO3, K2S2O5, etc. were investigated for their ability to fade the KMnO4 colour and for factors influencing the methanol determination. A comparison was conducted, for which a 500 mg L−1 methanol standard was used as the test sample. The results in Fig. 2 show that when Na2SO3 or AsA was used as the reductant, absorbance of the coloured product (which relates to the methanol content) was the lowest, and if K2S2O5 was used as the reductant, the absorbance was second only to that of H2C2O4. The biggest advantage of K2S2O5 was that it did not produce CO2 gas in the reaction, which is beneficial for improving the repeatability of the process. Therefore, K2S2O5 was chosen as the reductant for methanol assay.Orthogonal experiment of the main influencing factors
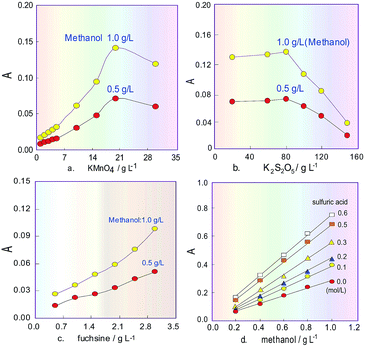
The H3PO4 concentration in the KMnO4 solution was set at 15% according to the literature,24 and the K2S2O5 concentration was set at 80 g L−1 before the orthogonal test. The initial parameters of the analytical system were fixed as follows: the revolution speed for P1 was 20 rpm, the RC2 length was 100 cm (I.D. 0.8 mm) and the sampling volume was 300 μL. Then the orthogonal experiment was conducted. The tested factors (level) were the KMnO4 concentration (5, 10, 15, 20 and 30 g L−1), the RC1 length (60, 100, 150, 200 and 250 cm), the RC3 length (200, 300, 400, 500 and 600 cm) and the FSS concentration (0.5, 1.0, 1.5, 2.0 and 3.0 g L−1). The FIA detection was conducted using a 1.0 g L−1 solution of methanol standard for the test samples at room temperature (25 °C). The obtained results showed that the order of impact on the methanol determination was KMnO4 concentration > FSS concentration > RC3 length > RC1 length. In the preliminary orthogonal experiment, when KMnO4 was 20 g L−1, FSS was 3 g L−1, RC1 length was 60 cm and RC3 length was 600 cm (0.8 mm I.D.), the response value of the colour-producing reaction relating to the methanol determination was good. However, to get the best results, further optimization was needed.Effects of reagent concentrations
Subsequently, on this basis, the sodium sulphite concentration in FSS was investigated in the range 10–50 g L−1. The experiment results showed that if the concentration increased, the product absorbance sharply decreased, and when the concentration was more than 30 g L−1, decreasing of the absorbance slowed down. Therefore, the sodium sulphite concentration in the chromogenic agent was selected as 30 g L−1.
Effect of the system acidity
Commonly, H3PO4 is only used to adjust the acidity of the KMnO4 solution, but due to its disadvantages of high viscosity and a tendency to produce bubbles, its concentration cannot be too high in our flow system. Besides, suitable acidity can improve the oxidizability of the KMnO4 solution. Therefore, H2SO4 was added into 15% H3PO4 solution24 as an oxidizing reagent, and its effect on the sensitivity of the system for methanol content analysis was investigated. The obtained results in Fig. 3d show that the absorbance change for the product increased when the H2SO4 concentration increased, and the slope of the response curves indicates that increasing the H2SO4 concentration can improve the sensitivity of the system for determining methanol content. However, in the experiment process it was also found that the baseline of the FIA system would drift as the H2SO4 concentration increased above 0.5 mol L−1. Therefore, after comprehensive consideration, the H2SO4 concentration was selected as 0.3 mol L−1. The final oxidant solution consists of 20 g L−1 KMnO4 and 0.3 mol L−1 H2SO4 as well as 15% H3PO4.Influence of temperature, flowrate and coil length
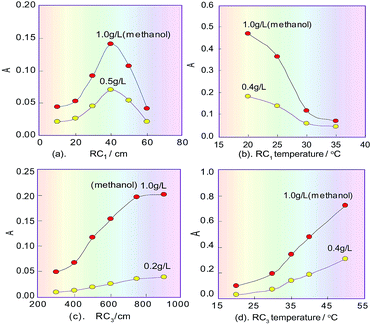
In the spectrophotometric flow-injection analysis system, the sensitivity of methanol content analysis is mainly controlled by the residence time of the methanol sample plug which is injected into the system, and the temperature within RC1 when methanol is oxidised into formaldehyde. Because the residence time is proportional to the length of RC1, the effect of the length on the sensitivity was first examined under the selected conditions mentioned above, and the correlating results are shown in Fig. 4a. It can be seen that when the RC1 length was 40 cm, the product absorbance relating to methanol content had a maximum value, which proved that the process of KMnO4 oxidizing methanol to generate formaldehyde is a fast reaction. In the non-equilibrium flow system, if the RC1 length was too long, methanol in the sample plug would be excessively oxidized and changed into formate, which would lead to the decreasing of the subsequent product and therefore the sensitivity of the system. Of course, if the length was too short, the amount of formaldehyde formed by oxidizing methanol would be too small, which would lead to a reduced amount of the subsequent product and so a decrease in the sensitivity of the system. Therefore, the RC1 length was selected as 40 cm.On the basis of the parameters optimised above, the temperature effect on KMnO4 oxidizing methanol was investigated by changing the RC1 temperature (KMnO4) in the range 20–40 °C. As can be seen in Fig. 4b, the sensitivity of our system to detect methanol decreased as the temperature of the KMnO4 solution increased. This phenomenon suggested that the reaction between KMnO4 and methanol is an exothermic reaction. Finally, the temperature of RC1 was selected to be room temperature (about 20 °C).
When the redundant KMnO4 flows into RC2, a fading reaction would take place with K2S2O5 (which was introduced from another line), so the RC2 length will affect the extent of fading of the KMnO4. If the RC2 length was too short, the redundant KMnO4 could not be completely faded, which would affect the next colour-producing reaction, but if the length was too long, it would increase the dilution of formaldehyde that is generated in the sample plug, and so decrease the analysis speed. Therefore, the effect of the RC2 length on the product absorbance in the reaction system was examined. The experiment results showed that there was a maximum response signal at 100 cm for the RC2 length.
The sensitivity of the system for methanol content analysis secondly depends on the generation time of formaldehyde, and the temperature within RC3 where the colour-producing reaction occurs. Therefore, the effect of the RC3 temperature and length, which is proportional to the residence time of formaldehyde, was evaluated under the designated conditions mentioned above. The results are shown in Fig. 4c, d. As can be seen from Fig. 4c, the absorbance change of the coloured product increased in the range 300–700 cm, and when the length exceeded 700 cm, the absorbance no longer changed. This implies that the colour-producing reaction between formaldehyde and FSS in RC3 is a slow reaction, so the RC3 length should not be too short. Fig. 4d indicates that the absorbance of the coloured product proportionally increased as the chromogenic reaction’s temperature increased in the range 20–50 °C, namely, sensitivity of the flow system increased with RC3’s temperature increase. This phenomenon suggests that the reaction between formaldehyde and FSS is an endothermic reaction. Considering the response range and the baseline noise of the detector, the temperature of RC3 was set at 50 °C with a thermostat.
Effect of sampling volume in the FIA system
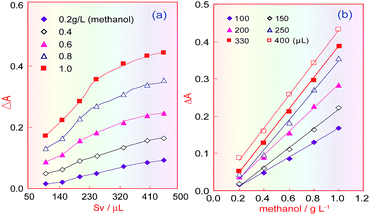
Under the selected conditions mentioned above, the effect of the sample volume (Sv) was investigated in the range 100–450 μL. Fig. 5a shows that when the sampling volume increased, the product absorbance increased under different methanol concentrations, and that this increasing trend became slow when the sample volume increased above 330 μL. Fig. 5b indicates that the absorbance of the coloured product proportionally increased with increasing methanol concentration, but that when the sample volume was larger than 330 μL, only the blank absorbance (intercept) increased, and so the sensitivity (the curve slope) did not increase. Therefore, the sampling volume was selected as 330 μL.Temperature effects for FSS/ethanol and FSS/methanol reactions
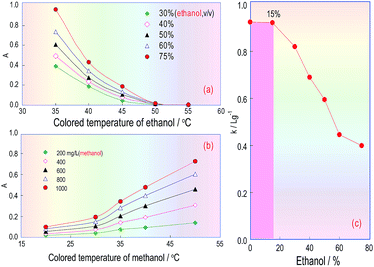
Because ethanol and the absorbance of the coloured product are correlated in the KMnO4/K2S2O5/FSS reaction system, FSS’s temperature effect on the reaction between FSS and acetaldehyde formed by ethanol in RC3 was also investigated. The ethanol standard used for the test samples was injected into the FIA system, and the absorbance curves of the coloured product associated with the FSS/acetaldehyde (ethanol) reaction were obtained under different temperatures. Fig. 6a indicates that when the FSS temperature increased from 35 °C to 50 °C, the absorbance of the coloured product quickly declined, and when the temperature was greater than 50 °C, the absorbance was close to zero. This showed that the coloured product relating to FSS/acetaldehyde (ethanol) is unstable and decomposes easily at high temperature. As a consequence, we can conclude that the reaction between acetaldehyde and FSS is fast and exothermic, and can quickly occur at room temperature.The temperature effect of the formaldehyde/FSS reaction in RC3 was also investigated under the same conditions, using the methanol standard for the test samples. As can be seen in Fig. 6b, the curve’s changing trend is similar to that in Fig. 4d, and so this further confirms that the formaldehyde/FSS reaction is slow and endothermic. Besides, it was seen with the naked eye that the product colour in the formaldehyde/FSS reaction was stable at high temperature and did not fade for a long time. Thus the temperature effect of formaldehyde is opposite to that of acetaldehyde in the same reaction system. This suggested that the ethanol interference in methanol analysis for wine can be eliminated by elevating the RC3 temperature and so the distillation pretreatment of the wine sample assay can be avoided. If so, the analysis time for methanol will be significantly reduced.
Accordingly, after the temperature of RC3 was set at 50 °C and the other FIA pipeline was set at room temperature (about 20 °C), the effect of the temperature on the absorbance of the coloured product from the ethanol/methanol mixing samples was estimated. The obtained results are shown in Fig. 6c, in which the abscissa denotes the ethanol concentration and the ordinate denotes the calibration curve slopes (k: L g−1) for the methanol standard solutions which contained ethanol at different concentrations. This curve reflects the extent of the impact of different ethanol amounts in wines on the methanol quantitation. Fig. 6c indicates that if the ethanol content in the methanol standards was less than 15%, the slope of the methanol calibration did not change, namely, as the ethanol content was less than or equal to 15%, it would not interfere with the methanol determination. If the content was over 15%, the slope of the methanol calibration started to observably decrease, namely, the ethanol content in the methanol standards began to interfere with the methanol quantification. The ethanol content in red wines is generally in the range 8–15%, so when the RC3 temperature in the FIA system is controlled at 50 °C, the interference coming from the ethanol content could be overcome, and the process of distilling the wine sample can be dispensed with.
Effect of interfering substances on methanol measurement
In order to examine the influence on the method of other substances coexisting in wines, some constituents with different concentrations were proportionally added (1 + 1) to a 1000 mg L−1 methanol standard. These mixtures were then used as testing samples to detect using our system, and finally the tolerance value†of these additives was judged according to the calculated recovery. The experiment results showed that K+(20), Na+(15), Mg2+(20), Mn2+(150), Ca2+(15), Br−(150), PO43−(15), SO42−(20), Cl−(20), citric acid (20), acetic acid (20), aldehyde (2), normal propyl alcohol (10), isobutyl alcohol (20), isoamyl alcohol (2), ethyl acetate (20), etc, did not interfere with the methanol determination. However, if the ethanol content was over 15% (v/v), it would have a positive effect, and if the amount of glycerol in the wines was more than twice the permissible value, it would also result in a positive effect. As well as this, some other coexisting micromolecular alcohols in wines (such as n-amyl alcohol, isoamylol, etc), did not interfere with the determination of methanol, because the relative amounts were much smaller than ethanol and methanol in the wines.Determination of methanol content in the samples
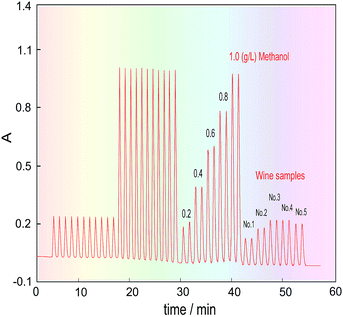
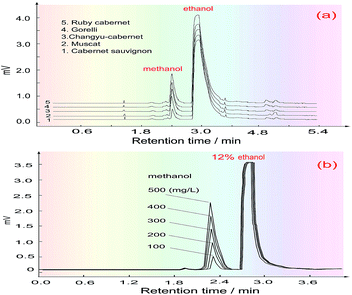
Five kinds of red wine were selected as representative samples, and their methanol content was detected under the above optimized conditions. To eliminate the effects of the chrominance and the reagent blank on the methanol content analysis, as well as the innate formaldehyde in these wines, the H3PO4 solution was first introduced into the FIA system through the three-way valve (V2) under systemic parameters. The other reagents were fixed in place, and the wine samples were injected into the carrier stream in turn to respectively get their blank absorbance (Ab). Then, the 3-way valve was switched to another position to introduce the KMnO4/H3PO4 oxidant, and the same wine samples were again injected into the system to obtain the absorbance of their coloured products (Am). Finally, the methanol content of the wines was quantified by calculating the absorbance difference (ΔA = Am − Ab).The detected and calculated results are shown in Table 1, and the real detection curves are shown in Fig. 7. Due to the alcohol content in the wines, which is normally about 11.5–12.5%, the methanol standard was made using 12% ethanol as the solvent. The purpose of this is to make the background level of the methanol standard solution match with that of the wine samples.
| No. | Samples (diluted 1 fold) | Ab | Am | ΔA | Methanol con.a/mg L−1 |
|---|---|---|---|---|---|
| a (1) ΔA = 1.09c − 0.0084 (r = 0.9997); (2) this comes from the data multiplied by the dilution multiple. | |||||
| 1 | Muscat | 0.057 | 0.148 ± 0.001 | 0.09 | 180 |
| 2 | Cabernet Sauvignon | 0.136 | 0.198 ± 0.001 | 0.062 | 118 |
| 3 | Ruby Cabernet | 0.095 | 0.217 ± 0.002 | 0.121 | 249 |
| 4 | Changyu Cabernet | 0.123 | 0.222 ± 0.002 | 0.098 | 203 |
| 5 | Gorelli | 0.115 | 0.227 ± 0.002 | 0.112 | 228 |
In order to estimate the accuracy of the determination results, a recovery test was carried out by adding a known amount of methanol into the wine samples. In the experiment, samples from different wines were divided into six portions which were separately added into the iso-volumetric methanol standards (0, 200, 400, 600, 400 and 1000 mg L−1). Then the absorbance of the coloured product from these mixtures was detected by the analytical system. The obtained recovery values in Table 2 are in the range 95–105%, which is satisfactory. This experiment suggests that our method is able to conduct accurate and direct determination of the methanol content in wines.
| Samples | Sample conc./mg L−1 | Added conc.a/mg L−1 | Determined conc./mg L−1 | Recovered conc./mg L−1 | Recovery/% |
|---|---|---|---|---|---|
| a The volumes of standard and sample solutions were mixed by one plus one. | |||||
| Changyu Cabernet | 203 ± 4 | 200 | 203.0 ± 5 | 101.5 | 102 |
| 400 | 311.1 ± 6 | 209.6 | 105 | ||
| 600 | 398.2 ± 11 | 296.7 | 98.9 | ||
| 800 | 497.3 ± 10 | 395.8 | 99.0 | ||
| 1000 | 602.4 ± 8 | 500.9 | 100 | ||
| Ruby Cabernet | 249 ± 7 | 200 | 224.00 ± 5 | 99.5 | 100 |
| 400 | 318.1 ± 6 | 193.6 | 96.8 | ||
| 600 | 416.2 ± 3 | 291.7 | 97.2 | ||
| 800 | 509.3 ± 3 | 384.8 | 96.2 | ||
| 1000 | 614.4 ± 15 | 489.9 | 98.0 | ||
| Muscat | 180 ± 5 | 200 | 194.0 ± 3 | 104.0 | 104 |
| 400 | 299.1 ± 3 | 209.1 | 105 | ||
| 600 | 407.2 ± 6 | 317.2 | 106 | ||
| 800 | 488.3 ± 6 | 398.3 | 99.5 | ||
| 1000 | 578.4 ± 6 | 488.4 | 97.7 | ||
| Cabernet Sauvignon | 118 ± 5 | 200 | 159.1 ± 6 | 100.1 | 100 |
| 400 | 248.5 ± 12 | 189.5 | 94.8 | ||
| 600 | 356.9 ± 9 | 297.9 | 99.3 | ||
| 800 | 438.2 ± 8 | 379.2 | 94.8 | ||
| 1000 | 576.4 ± 16 | 517.4 | 103 | ||
| Gorelli | 228 ± 9 | 200 | 218.0 ± 6 | 104.0 | 104 |
| 400 | 323.1 ± 11 | 209.1 | 105 | ||
| 600 | 404.2 ± 1 | 290.2 | 96.7 | ||
| 800 | 512.3 ± 9 | 398.3 | 99.6 | ||
| 1000 | 617.4 ± 15 | 503.4 | 101 | ||
Contrast experiment
The same volume (5 mL) of the methanol standard and the pretreated wine sample was added into two separate 25 mL tubes, and a 2 mL mixture of the KMnO4 and H3PO4 solution was added to each tube. After heating the tubes for 10 min at 30 °C, 2 mL of the H2C2O4/H2SO4 mixture was added again into the two tubes. Once the tubes had cooled to room temperature, 5 mL of FSS was added to the tubes, and they were left to react at 30 °C for 30 min. Finally, the reaction solutions were detected using the spectrophotometer. The determined results are shown in Table 2.
Conclusions
The optimized conditions for our system to determine the methanol content of wines were as follows: the concentration of KMnO4 was 20 g L−1; the concentration of FSS was 3 g L−1; the length of RC1 was 40 cm; the length of RC2 was 100 cm; the length of RC3 was 700 cm (I.D.: 0.8 mm); the temperature of RC3 was 50 °C; the temperature of RC1 and RC2 was about 20 °C; the sample volume was 330 μL. The proposed method and system all possesses noteworthy advantages in the areas of automated operation, repeatability, test cost and sample pretreatment, and realized the direct and rapid determination for methanol in wines. Its determination result was consistent with the reference methods. Consequently, the method and system can serve as a supplementary standard for methanol content determination, and can also be used for online quality control of the winemaking process and the rapid determination of methanol content in the final wine product, as well as in low-alcohol drinks.Conflicts of interest
There are no conflicts to declare.Notes and references
- M. R. Brown and C. S. Ough, Am. J. Enol. Vitic., 1982, 1, 41–43 Search PubMed.
- B. Gnekow and C. S. Ough, Am. J. Enol. Vitic., 1979, 27, 1–6 Search PubMed.
- V. Kumar, K. Abul and J. C. Aster, Robbins Basic Pathology, Elsevier, 9th edn, 2013 Search PubMed.
- J. A. Kruse, Intensive Care Med., 1992, 18, 391–395 CrossRef CAS PubMed.
- Y. S. Li, J. N. Qi and X. F. Gao, Liquor-making Sci. Technol., 2006, 139, 84–89 Search PubMed.
- F. Bindler, E. Voges and P. Laugel, Food Addit. Contam., 1998, 5, 343–351 CrossRef PubMed.
- GB/T15307, Wine, National Standards of the People’s Republic of China, 2006.
- J. Feher, G. Lengyel and A. Lugasi, Cent. Eur. J. Med., 2007, 2, 379–391 Search PubMed.
- J. M. Garrigues, A. Pérez-Ponce, S. Garrigues and M. D. L. Guardia, Vib. Spectrosc., 1997, 15, 219–228 CrossRef CAS.
- M. L. Wang, J. T. Wang and Y. M. Choongy, J. Food Compos. Anal., 2004, 17, 187–196 CrossRef CAS.
- R. Caruso, G. L. Gambino and M. Scordino, Nat. Prod. Commun., 2011, 6, 1939–1943 CAS.
- G. Ai, T. Sun and X. Dong, Rapid Commun. Mass Spectrom., 2014, 28, 1674–1682 CrossRef CAS PubMed.
- Y. C. Zhang, N. B. Lin, X. S. Chai, Z. Li and G. D. Barnes, Food Chem., 2015, 183, 169–172 CrossRef PubMed.
- H. Gülce, A. Gülce, M. Kavanoz, H. Coşkun and A. Yildiz, Biosens. Bioelectron., 2002, 17, 517–521 CrossRef.
- L. Rotariu, C. Bala and V. Magearu, Anal. Chim. Acta, 2004, 513, 119–123 CrossRef CAS.
- S. H. Chen, H. L. Wu, C. H. Yen, S. M. Wu, S. J. Lin and H. S. Kou, J. Chromatogr. A, 1998, 799, 93–99 CrossRef CAS PubMed.
- C. C. Kuo, Y. H. Wen and S. S. Wu, Anal. Lett., 2003, 36, 813–825 CrossRef CAS.
- J. Ruzsicka, Trends Anal. Chem., 2006, 25, 1–2 CrossRef.
- Y. S. Li, and X. F. Gao, Flow injection analysis and application for chemistry analysis, The Jilin People’s Publisher, China, 2002, ISBN 7-206-02728-8/R 37 Search PubMed.
- X. F. Gao, K. Ikebukuro, I. Karube and Y. S. Li, LRA, Wiley & Sons, 1997, vol. 9, pp. 69–79 Search PubMed.
- A. N. Araújo, C. M. C. M. Couto and J. L. F. C. Lima, J. Agric. Food Chem., 1998, 46, 168–172 CrossRef.
- Y. S. Li, Y. Muo and H. M. Xie, Anal. Chim. Acta, 2002, 455, 315–325 CrossRef CAS.
- Y. S. Li, C. X. Xing and L. L. Yang, Anal. Sci., 2005, 21, 273–279 CrossRef CAS PubMed.
- Y. S. Li, B. Zhao and X. H. Sun, Spectrosc. Spectral Anal, 2009, 29, 2560–2564 CAS.
- Y. S. Li, B. Zhao and X. H. Sun, J. Sichuan Univ., Eng. Sci. Ed., 2009, 41, 92–96 CAS.
- S. C. Nanita, J. J. Stry, A. M. Pentz, J. P. McClory and J. H. May, J. Agric. Food Chem., 2011, 59, 7557–7568 CrossRef CAS PubMed.
- Y. S. Li, L. Zhou, H. S. Zhang, Z. Y. Lai and X. F. Gao, Anal. Sci., 2012, 28, 781–787 CrossRef CAS PubMed.
- X. F. Gao, K. Ikebukuro, I. Karube and Y. S. Li, Bunseki Kagaku, 1997, 46, 357–365 CrossRef CAS.
- X. F. Gao, Y. S. Li and I. Karube, Anal. Chim. Acta, 2001, 443, 257–264 CrossRef CAS.
- C. G. D. Maria, T. Manzano, R. Duarte and A. Alonso, Anal. Chim. Acta, 1995, 309, 241–250 CrossRef.
- C. Almuzara, O. Cos, M. Baeza, D. Gabriel and F. Valero, Biotechnol. Lett., 2002, 24, 413–417 CrossRef CAS.
- J. Kelly, S. Chapman, P. Brereton, A. Bertrand, C. Guillou and R. Wittkowski, J. AOAC Int., 1999, 82, 1375–1388 CAS.
- W. Horwitz and G. W. Latimer, Official methods of analysis of AOAC international, 18th edn, 2011 Search PubMed.
- GB/T15038, Analytical methods of wine and fruit wine, The National Standard of the People’s Republic of China, 2006.
- S. G. Liu, Y. Z. Liang and Z. Y. Cao, Chin. J. Anal. Lab., 2005, 24, 29–31 CrossRef CAS.
- B. Yu, X. F. Dai, S. Zhang and Y. G. Chen, J. Shanghai Univ., 2006, 2, 196–199 Search PubMed.
- Z. W. Li, H. B. Ma, H. H. Lu and G. H. Tao, Talanta, 2008, 74, 788–792 CrossRef CAS PubMed.
- Z. Q. Zhang, H. T. Yan and X. F. Yue, Microchim. Acta, 2004, 146, 259–268 CrossRef CAS.
- X. F. Yue and Z. Q. Zhang, J. Anal. Chem., 2007, 62, 992–996 CrossRef CAS.
- J. González-Rodríguez, P. Pérez-Juan and M. L. D. Castro, Anal. Bioanal. Chem., 2002, 374, 120–125 CrossRef PubMed.
Footnote |
| † Note: this was the ratio of the added content and the maximum inherent content of the constituent in the wines |
| This journal is © The Royal Society of Chemistry 2018 |

