DOI:
10.1039/C8RA00065D
(Paper)
RSC Adv., 2018,
8, 8662-8670
Physicochemical conditions for ZnO films deposited by microwave chemical bath deposition
Received
3rd January 2018
, Accepted 16th February 2018
First published on 27th February 2018
Abstract
Physicochemical analysis was carried out to obtain the species distribution diagrams (SDDs) for the deposition of ZnO films as a function of OH− ion concentration ([OH−]) in the reaction solution. The study of SDDs predicts nucleation and ZnO film growth by means of the dominant species at a given pH value. To confirm this, a series of experiments were made varying the [OH−] in the reaction solution and keeping the others parameters constant. Structured zinc oxide (ZnO) films were obtained on glass substrates by microwave chemical bath deposition (MWCBD). Structural, optical and morphological ZnO film properties were investigated as a function of [OH−]. X-Ray diffraction technique (XRD) measurements show multiple diffraction peaks, indicating the polycrystalline nature of ZnO films. Scanning Electron Microscopy (SEM) images of ZnO structures showed morphological changes with the variation of [OH−]. The stoichiometry of the structures changed as the [OH−] was varied in solution. From Raman spectra, it was observed that the [OH−] of the reaction mixture strongly affects the crystal quality of ZnO structures. A reaction pathway for the synthesis of ZnO structures based on our results is proposed. Experimental results are consistent with the physical–chemical analysis.
1. Introduction
Due to technological and electronic advances, the world faces the challenge of creating materials with versatile properties. Those materials must fulfill some requirements such as having inert properties, a wide band gap, high electron mobility as well as a great resistance to field rupture. Zinc oxide (ZnO) is a semiconductor material, which has a band gap of 3.37 eV, an exciton binding energy of 60 meV at room temperature and a melting point of 1975 °C. Those properties are important in a semiconductor for the future needs. Besides, in recent years, ZnO has become one of the most studied materials due to its very interesting properties in optoelectronic devices application such as; room temperature lasers,1 light emitting diodes,2,3 ultraviolet (UV) detectors,4 field-emission displays,5–7 photonic crystals,8 solar cells9,10 and sensing in the nano-size range.11 The control of its properties is primarily in the context of novel applications as highly efficient gas sensing material12,13 and photocatalysis.14,15 For this reason, a better understanding of the synthesis of microstructures with different morphologies is important and necessary to achieve objectives and applications on materials for the modern world. A profitable, simple and easily scalable method to synthesize the material is the microwave chemical bath deposition (MWCBD). This technique allows us the production of multifunctional structures to a larger scale. In addition, it is possible to have control of the material properties by only changing the synthesis conditions.16,17 Moreover, in recent years, the process of microwave assisted heating has been used as an attractive alternative for the synthesis of nanoscale materials, since it is a fast and effective method that allows us to increase the kinetic reaction on one or two magnitude orders.18 On the other hand, to control the physicochemical properties of a final product synthesized by chemical bath deposition process, knowledge of the species generated during reaction is required. Therefore, an analysis on solution conditions needs to be done. This analysis could allow us to construct species distribution diagrams (SDDs) at the chemical equilibrium. SDDs have proven to be a successful tool to find the optimal films deposition conditions by chemical bath.19,20
In this work, a methodology to synthesize structured ZnO films by the MWCBD technique based on a theoretical physicochemical analysis is presented. SDDs were constructed by using different OH− ions concentration ([OH−]) in the analytical model. The [OH−] used in the experiments and the [OH−] used in the SDDs are related with the structural, optical and morphological properties of the deposited ZnO films. The ZnO deposition is carried out by means of a controlled urea precipitation for the formation of the chelate [Zn(urea)]2+, which provides the dissolution reaction of Zn2+ ions in a controlled way.10 It was found that adjusting pH in the initial solution, the grain size, morphology, stoichiometry O/Zn (% at) ratio and structural properties of the ZnO films can be controlled. A possible reaction pathway based on the SDDs and the experimental results is presented.
2. Physical–chemical analysis
2.1 Solubility and species distribution diagrams
Different authors have proposed Zn(OH)2 as a precursor of ZnO,21–23 the Zn(OH)2 solubility product is about 10−16 (mol L−1). Thermodynamically, ZnO can be chemically deposited only if the [Zn2+]/[OH−] ratio overcomes the solubility product in several orders of magnitude, nevertheless is possible to obtain ZnO in the practice without fulfill this thermodynamic condition. Transformation of Zn(OH)2 into ZnO can be understood as a Zn(OH)2 dehydration reaction and formation of ZnO.21 On the other hand, Zn(OH)2 is normally attributed to form ZnO nuclei points in solution24 that promote the ZnO deposition on a surface substrate. SDDs can help us to predict those conditions. In a recent report a physicochemical analysis was used to demonstrate the conditions for ZnS deposited by CBD.25 In this work we used zinc nitrate (Zn(NO3)2) as a Zn2+ ions source and ammonium hydroxide (NH4OH) as complexing agent and by fix the pH in the solution. Thus, according the chemical reagents used, the chemical reactions that can occur during deposition are:25
Ammonium dissociation:
| | |
NH4(aq)+ ↔ NH3(aq) + H(aq)+
| (1) |
Zinc–amino complexes formation:
| | |
Zn(aq)2+ + NH3(aq) ↔ Zn(NH3)(aq)2+
| (2) |
| | |
Zn(aq)2+ + 2NH3(aq) ↔ Zn(NH3)2(aq)2+
| (3) |
| | |
Zn(aq)2+ + 3NH3(aq) ↔ Zn(NH3)3(aq)2+
| (4) |
| | |
Zn(aq)2+ + 4NH3(aq) ↔ Zn(NH3)4(aq)2+
| (5) |
Zinc–hydroxy complexes formation:
| | |
Zn(aq)2+ + OH(aq)− ↔ Zn(OH)(aq)+
| (6) |
| | |
Zn(aq)2+ + 2OH(aq)− ↔ Zn(OH)2(aq)
| (7) |
| | |
Zn(aq)2+ + 3OH(aq)− ↔ Zn(OH)3(aq)−
| (8) |
| | |
Zn(aq)2+ + 4OH(aq)− ↔ Zn(OH)4(aq)2−
| (9) |
Precipitated zinc formation:
| | |
Zn(OH)2(s) ↔ Zn(aq)2+ + 2OH(aq)−
| (10) |
and water dissociation:
| | |
H2O(l) ↔ H(aq)+ + OH(aq)−
| (11) |
In order to obtain a physicochemical function with temperature, the equilibrium constants are required (eqn (1)–(11)). This work, based in a previous research,25 takes advantages from the physicochemical analysis proposed for the CBD technique, in which, the equilibrium constants (eqn (1)–(11)) are well referenced. In this sense, SDDs can be constructed with the chemical condition used in this work. The chelate [Zn(urea)]2+ formation is not included because its principal function is the slow release of Zn2+ ions into the solution in order to obtain a controlled MWCBD reaction. On the other hand, urea thermally decomposed in aqueous media and some works have reported the decomposition.26–28 The urea decomposition reaction consists of a series of steps, where the time plays an important role. The films deposition in MWCBD technique takes a short time period in contrast with the urea decomposition reaction, this ensure that the aqueous solution is not contaminated with the products of the urea decomposition during the films deposition.
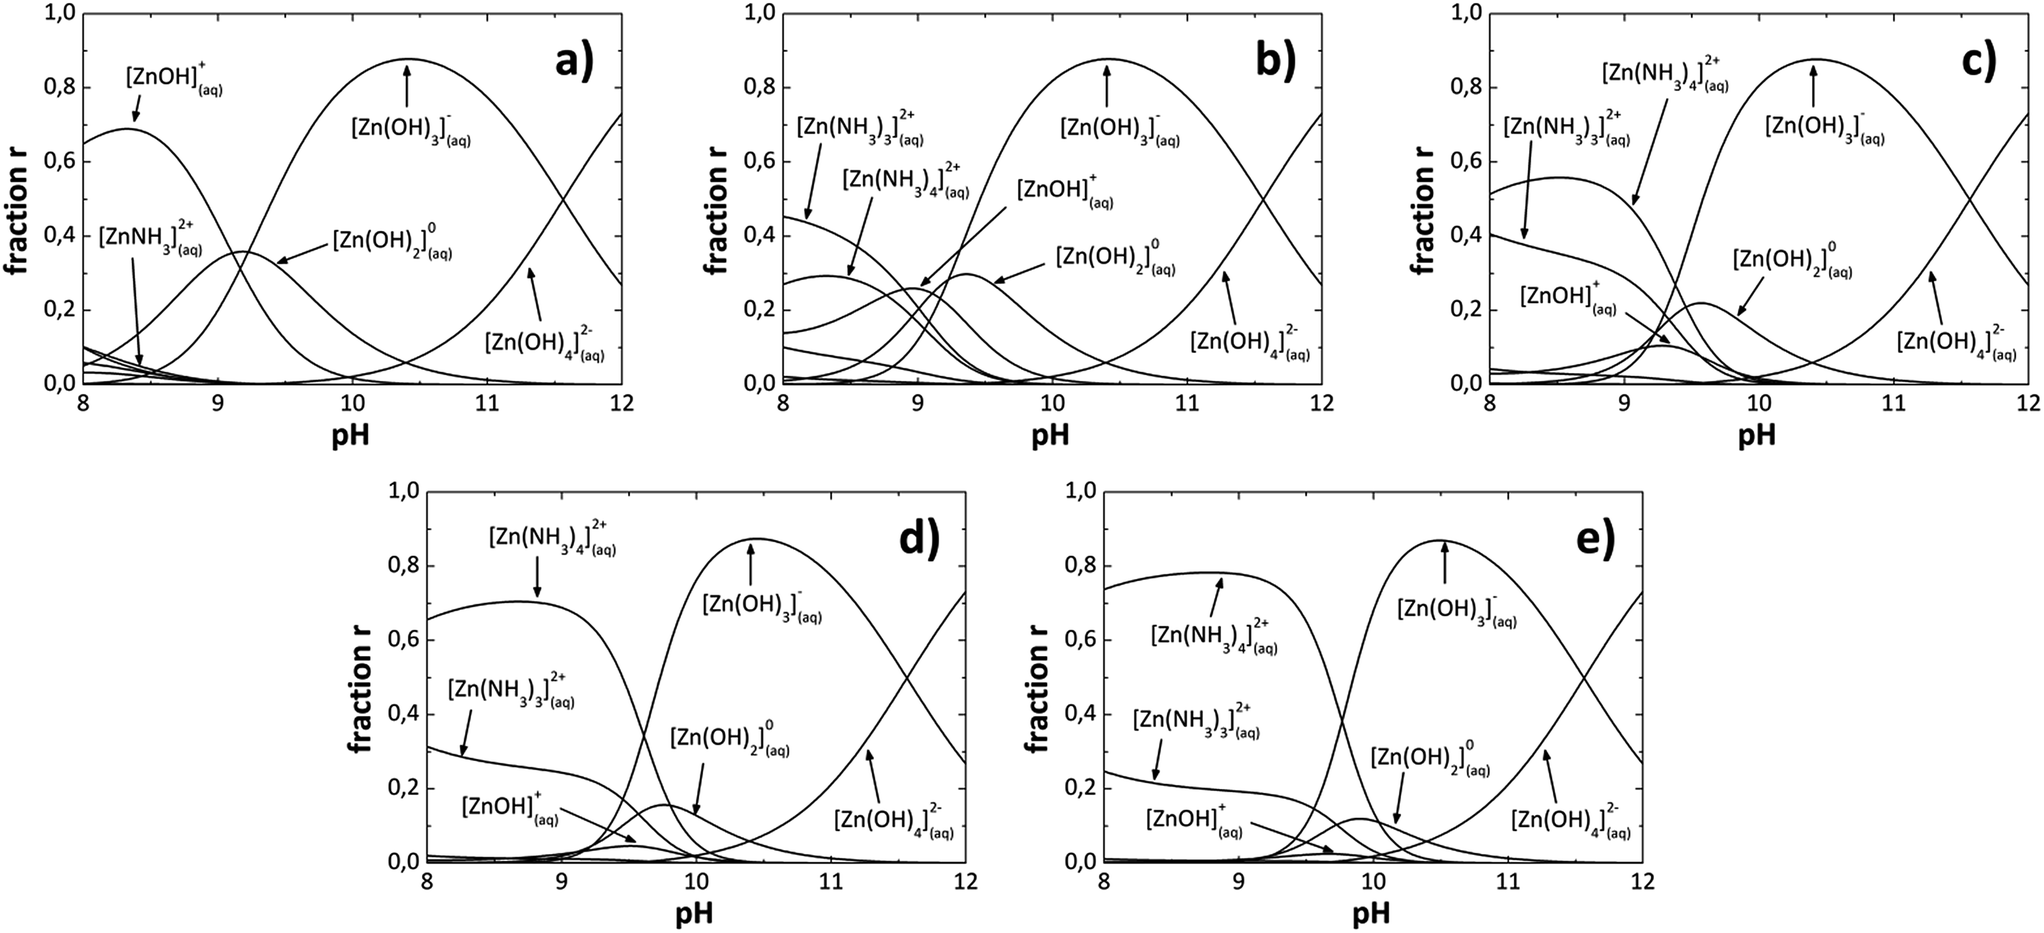
In the analytical model [OH−] was adjusted from 1.77 × 10⁻⁵ to 1.38 × 10⁻³ at 80 °C to construct the SDDs as shown in Fig. 1. When the [OH−] increases in the solution, the [NH4+] increases too due to the ammonium hydroxide (NH4OH) used, then in the analytical model the [NH4OH] is varied and the [OH−] is adjusted. Species or reaction products formed, for each [OH−] in the SDDs are listed in Table 1. We can also observe from Fig. 1 that due to reaction conditions, the number of nucleation centers [Zn(OH)2] and growth units [Zn(OH)3]− and [Zn(OH)4]2− are also all different for each [OH−] in the solution. The [OH−], was calculated for each pH value, which are also listed in Table 1. Fig. 1a shows the SDDs for a [OH−] of 1.77 × 10⁻⁵, where we can see chemical species with different charges which form at a specific [OH−]; species with positive charge are below of 9 pH value, the neutral specie Zn(OH)02 is between 8 to 11 pH values and species with negative charge are above of 9 pH value. It can be appreciated almost the same pattern for greater OH− ions concentrations (Fig. 1b) 7.58 × 10⁻⁵, (Fig. 1c) 2.45 × 10⁻⁴, (Fig. 1d) 8.70 × 10⁻⁴ and (Fig. 1e) 1.38 × 10⁻³). As an example; in (Fig. 1e) species with positive charge are below of 10 pH value, the neutral specie Zn(OH)02 is between 9 to 11 pH values and species with negative charge are above of 9.5 pH value. Increasing [OH−] also increase the [NH4+] (NH3 concentration), resulting in an increment of the relative concentration of the species with positive charge Zn(NH3)32+ and Zn(NH3)42+ with a decrement on Zn(OH)+ and neutral Zn(OH)02 species. From these observations in the SDDs the neutral specie Zn(OH)02 is between 8.5 to 11 pH values and its relative concentration decrease when the [OH−] increase, species with positive charge are below of 10 pH value and species with negative charge are above of 9 pH value, overlapping between them in 9 and 10 pH values, for all [OH−] studied in this work.
 |
| | Fig. 1 Species diagrams at 80 °C for: (a) 1.77 × 10⁻⁵, (b) 7.58 × 10⁻⁵, (c) 2.45 × 10⁻⁴, (d) 8.70 × 10⁻⁴ and (e) 1.38 × 10⁻³, OH− ions concentration. | |
Table 1 Species that predominate at each pH value corresponding to each [OH−]
| OH− ions concentration |
pH value |
Predominate species for each pH value |
| 1.77 × 10⁻⁵ |
9.25 |
[Zn(OH)]+ ≈ [Zn(OH)2]0 ≈ [Zn(OH)3]− |
| 7.58 × 10⁻⁵ |
9.88 |
[Zn(OH)3]− > [Zn(OH)2]0 > [Zn(OH)]+ |
| 2.45 × 10⁻⁴ |
10.39 |
[Zn(OH)3]− > [Zn(OH)2]0 |
| 8.70 × 10⁻⁴ |
10.94 |
[Zn(OH)3]− > [Zn(OH)2]0 ≫ [Zn(OH)4]2− |
| 1.38 × 10⁻³ |
11.14 |
[Zn(OH)3]− > [Zn(OH)4]2− ≫ [Zn(OH)2]0 |
Solubility diagrams (SDs) can be constructed too, as well as SDDs were constructed. Thermodynamically, ZnO can be chemically deposited only if the [Zn2+]/[OH−] ratio in the solution overcomes the Zn(OH)2 solubility product, as it was said before. MWCBD technique increase the kinetic reaction, thus the previous thermodynamic condition could or could not influence the films deposition, in another way, chemical species that become dominant in the solution as a function of the pH value must influence the films deposition. The species with positive charge Zn(NH3)32+, Zn(NH3)42+ rarely would participate in the ZnO growth because they do not contain oxygen, even though, the Zn(OH)+ specie has positive charge and may participate. Besides, Zn(OH)02 (nucleation center), Zn(OH)3− and Zn(OH)42− (growth units) species surely would participate in the ZnO growth because they contain oxygen. Thus, from the SDDs, chemical species that would participate in the ZnO growth are above of 9 pH values, and the species that would not participate are below of 10 pH values. Therefore, [OH−] that produce pH values above 10 could be appropriate for ZnO growth by MWCBD process. When increase the [OH−], the pH increase and the species Zn(OH)3− and Zn(OH)42− (growth units) become dominant, thus ZnO growth is promoted. The main specie and/or species which be formed at a specific [OH−] containing or not oxygen can affect directly the structural, optical and morphological properties of the ZnO films depending of the NH4OH concentration used in the MWCBD technique and explained in the next section.
3. Materials and methods
In order to investigate the physicochemical conditions and predictions described by the SDDs, initial solutions were prepared at room temperature by dissolving zinc nitrate (0.1 M) and urea (0.1 M) into deionized (DI) water (resistivity 18.2 MΩ) under magnetic stirring, keeping the molar ratio in 1![[thin space (1/6-em)]](https://www.rsc.org/images/entities/char_2009.gif) :1. Different amounts of aqueous ammonia (NH4OH) were added to the solutions in order to adjust the initial [OH−] to: (a) 1.77 × 10⁻⁵, (b) 7.58 × 10⁻⁵, (c) 2.45 × 10⁻⁴, (d) 98.70 × 10⁻⁴ and (e) 1.38 × 10⁻³ values obtained from the pH measurement in each solution. Three well-cleaned glass substrates were immersed vertically into the solutions and introduced simultaneously into a commercial microwave oven (Sharp, model R-408J, frequency 2.45 GHz) and were left there by four minutes in continuous microwave irradiation at full power (1200 W) until the reaction solution temperature reached 80 °C (±2 °C), after that, the microwave irradiation process was then continued for another 20 minutes at low microwave power (keeping a constant temperature of 80 °C). Finally, the substrates were taken out of the reaction beaker and rinsed with DI water several times under vigorous stirring and dried at room temperature in air.
:1. Different amounts of aqueous ammonia (NH4OH) were added to the solutions in order to adjust the initial [OH−] to: (a) 1.77 × 10⁻⁵, (b) 7.58 × 10⁻⁵, (c) 2.45 × 10⁻⁴, (d) 98.70 × 10⁻⁴ and (e) 1.38 × 10⁻³ values obtained from the pH measurement in each solution. Three well-cleaned glass substrates were immersed vertically into the solutions and introduced simultaneously into a commercial microwave oven (Sharp, model R-408J, frequency 2.45 GHz) and were left there by four minutes in continuous microwave irradiation at full power (1200 W) until the reaction solution temperature reached 80 °C (±2 °C), after that, the microwave irradiation process was then continued for another 20 minutes at low microwave power (keeping a constant temperature of 80 °C). Finally, the substrates were taken out of the reaction beaker and rinsed with DI water several times under vigorous stirring and dried at room temperature in air.
For the purpose to observe the ZnO films properties, X-ray diffraction (XRD) was used to investigate the structures of the ZnO films. Morphological characterization of the ZnO films was carried out in a JEOL (JSM-5400LV) Scanning Electron Microscope (SEM) equipped with OXFORD analytical Energy Dispersive X-ray Spectroscopy (EDS) system. The Raman measurements were performed at room temperature using a LabRAM HR-Olympus Micro Raman spectrometer, equipped with a He–Ne laser with an excitation of 633 nm. The film thickness was obtained on a profilometer Veeco (Bruker); model DEKTAK 150 with a Stylus of 12 μm.
4. Results and discussions
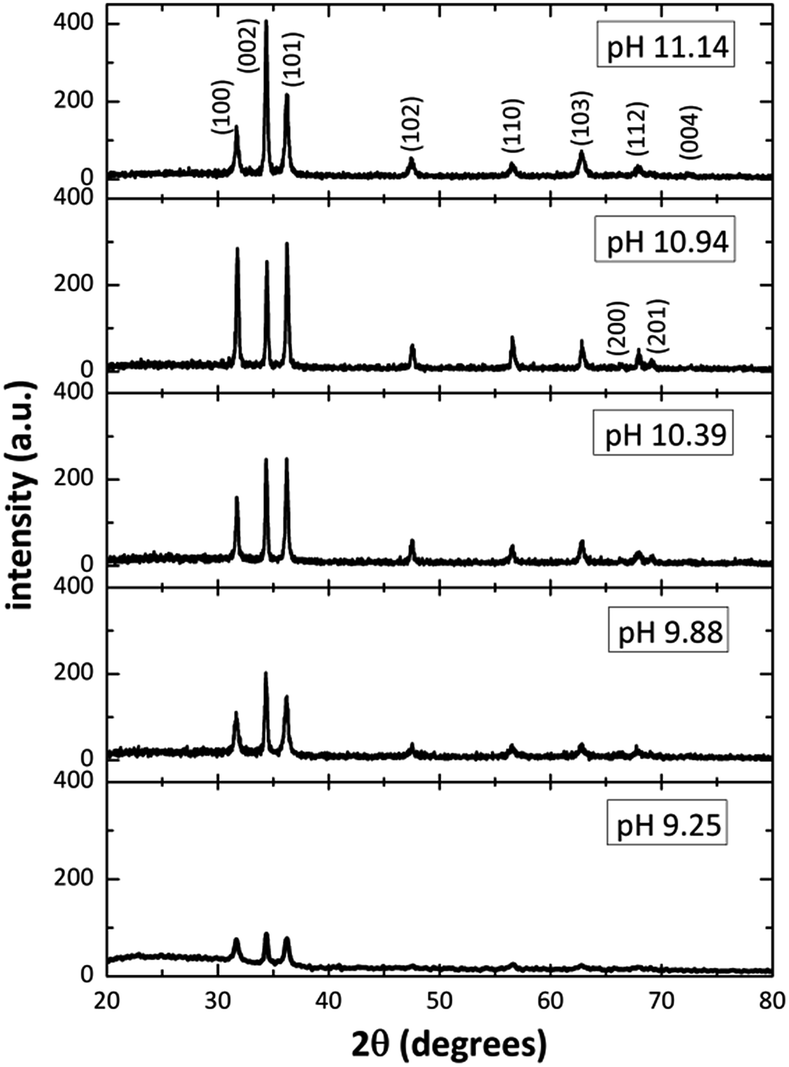
Fig. 2 shows the XRD patterns from ZnO films grown on glass substrates by using different [OH−] in the solution. The diffractograms revealed several well-defined diffraction peaks, all matching with the standard peak positions (JCPDS Card No. 36-1451) of ZnO in hexagonal wurtzite phase. Is interesting to note in Fig. 2, that for pH values of 9–10, the relative intensity of the diffraction peaks is small (in the SDDs there are species with positive and negative charge in those pH values), and as the pH increase (increasing [OH−]), from 9.25 to 11.14, the relative intensity of the diffraction peaks increases too, indicating a better crystal ZnO growth and confirming the predictions mentioned by the SDDs. On the other hand, for the 11.14 pH, the relative intensity of diffraction peaks corresponding to planes (100) and (101) diminish and the (002) increase, this means that the crystal growth is promoted only along plane (002) when increasing [OH−] according to SDDs (Fig. 1e), in which exist the influence of two growth units ([Zn(OH)3]− > [Zn(OH)4]2−) that compete with each other affecting the crystal growth. By using the XRD pattern, it was extracted the data for the main diffraction peaks corresponding to planes (100), (002) and (101) for the different pH, those values are listed in Table 2.
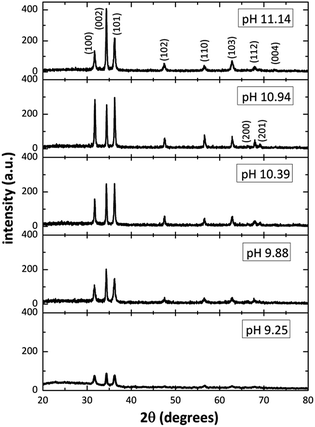 |
| | Fig. 2 XRD patterns of the ZnO structure ranging the initial solutions pH from 9.25 to 11.14. | |
Table 2 XRD data of the MWCBD structured ZnO films for different pH values
| pH |
Peak position 2θ (degree) |
FWHM peak position (degree) |
d (Å) |
| (100) |
(002) |
(101) |
(100) |
(002) |
(101) |
(100) |
(002) |
(101) |
| 9.25 |
31.72 |
34.36 |
36.21 |
0.2255 |
0.2153 |
0.2671 |
2.821 |
2.611 |
2.481 |
| 9.88 |
31.72 |
34.36 |
36.18 |
0.2302 |
0.2228 |
0.2553 |
2.821 |
2.611 |
2.483 |
| 10.39 |
31.64 |
34.32 |
36.15 |
0.2398 |
0.1932 |
0.2548 |
2.828 |
2.613 |
2.485 |
| 10.94 |
31.81 |
34.44 |
36.27 |
0.2816 |
0.2269 |
0.2754 |
2.813 |
2.604 |
2.477 |
| 11.14 |
31.82 |
34.48 |
36.29 |
0.2405 |
0.2181 |
0.2639 |
2.812 |
2.601 |
2.475 |
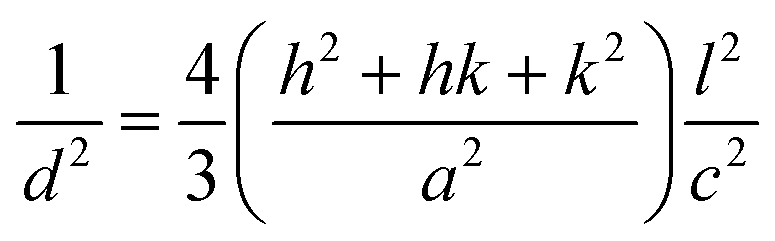
The interplanar distance d was evaluated with the Bragg's law: nλ = 2dsinθ (n = 1, λ = 1.54184 Å) for each crystallographic plane. The data in Table 2 were used to determine the structural parameters for the ZnO films in hexagonal wurtzite phase listed in Table 3. The lattice parameters a and c were calculated using the formula: 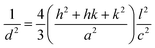 , where h, k, and l are the Miller indices. The Zn–O bond length L was evaluated using the equation:
 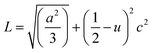 , where a and c are the lattice parameters, u is the positional parameter that is a measure of the amount by which each atom is displaced with respect to the next along the ‘c’ axis and is obtained by the expression:
 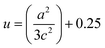 . The grain size D was determined for each crystallographic plane using Scherrer's equation from full width at half maximum peak position:
  , λ = 1.54184 Å and β = FWHM in Table 2. Finally, the strain (ε) in the films was calculated using the relation:
 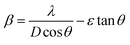 for each crystallographic plane. All equation to determine the structural parameters in this work of the ZnO films in hexagonal wurtzite phase has been reported and are widely referenced.29–31 It can be observed in Table 2, that the interplanar distance d seems stretching and shrinking for all the diffraction planes when the pH increase in the solution. The same behavior can be noted for the lattice parameters a, c and the Zn–O bond length L in Table 3 when the pH increase. This behavior can be due to the total zinc or oxygen atomic in the ZnO lattice of the films, there is more zinc or oxygen when the pH increase, the ZnO unit cell volume stretching until a pH value about 10.39, increasing the pH it shrinks and stabilizes.
Table 3 Structural parameters of the ZnO films for different pH values
| pH |
Lattice parameters |
Zn–O bond length |
Grain size |
Strain |
| a (Å) |
c (Å) |
c/a |
D (nm) |
(ε) × 10−4 |
| (100) |
(002) |
L (Å) |
(100) |
(002) |
(101) |
(100) |
(002) |
(101) |
| 9.25 |
3.257 |
5.219 |
1.602 |
1.983 |
38.28 |
40.37 |
32.71 |
8.84 |
7.76 |
9.11 |
| 9.88 |
3.257 |
5.219 |
1.602 |
1.983 |
37.51 |
39.01 |
34.22 |
9.03 |
8.03 |
8.71 |
| 10.39 |
3.265 |
5.226 |
1.601 |
1.987 |
35.99 |
44.98 |
34.28 |
9.43 |
6.97 |
8.69 |
| 10.94 |
3.248 |
5.208 |
1.603 |
1.977 |
30.66 |
38.32 |
31.73 |
11.01 |
8.16 |
9.37 |
| 11.14 |
3.247 |
5.202 |
1.602 |
1.976 |
35.90 |
39.87 |
33.11 |
9.39 |
7.83 |
8.97 |
On the other hand, in Table 3 can observe that the grain size diminishes for the (100) plane until a pH value about 10.94 and for the (002) plane the grain size increases until a pH value about 10.39. The strain for its part increases for the (100) plane until a pH value about 10.94, increasing the pH it diminishes, for the (002) plane the strain increases and diminishes on every step that the pH increases. The ZnO wurtzite structure is composed of two interpenetrating hexagonal close packet (hcp) sublattices, where in the (100) crystallographic plane have equal proportion of zinc and oxygen atoms surrounded by each other, and in the (002) diffraction plane there is only oxygen or zinc atoms.32 Experimentally was reported that the (002) crystallographic plane is strongly dependent upon the O2 gas in sputtered ZnO films.33,34 The formation and ZnO growth is promoted when increasing the [NH4OH] in the solution allowing more atomic oxygen in the ZnO unit cell until a pH value about 10.94. The XRD results confirms the SDDS predictions, otherwise these results may indicate a change in the morphology of the ZnO films surface.
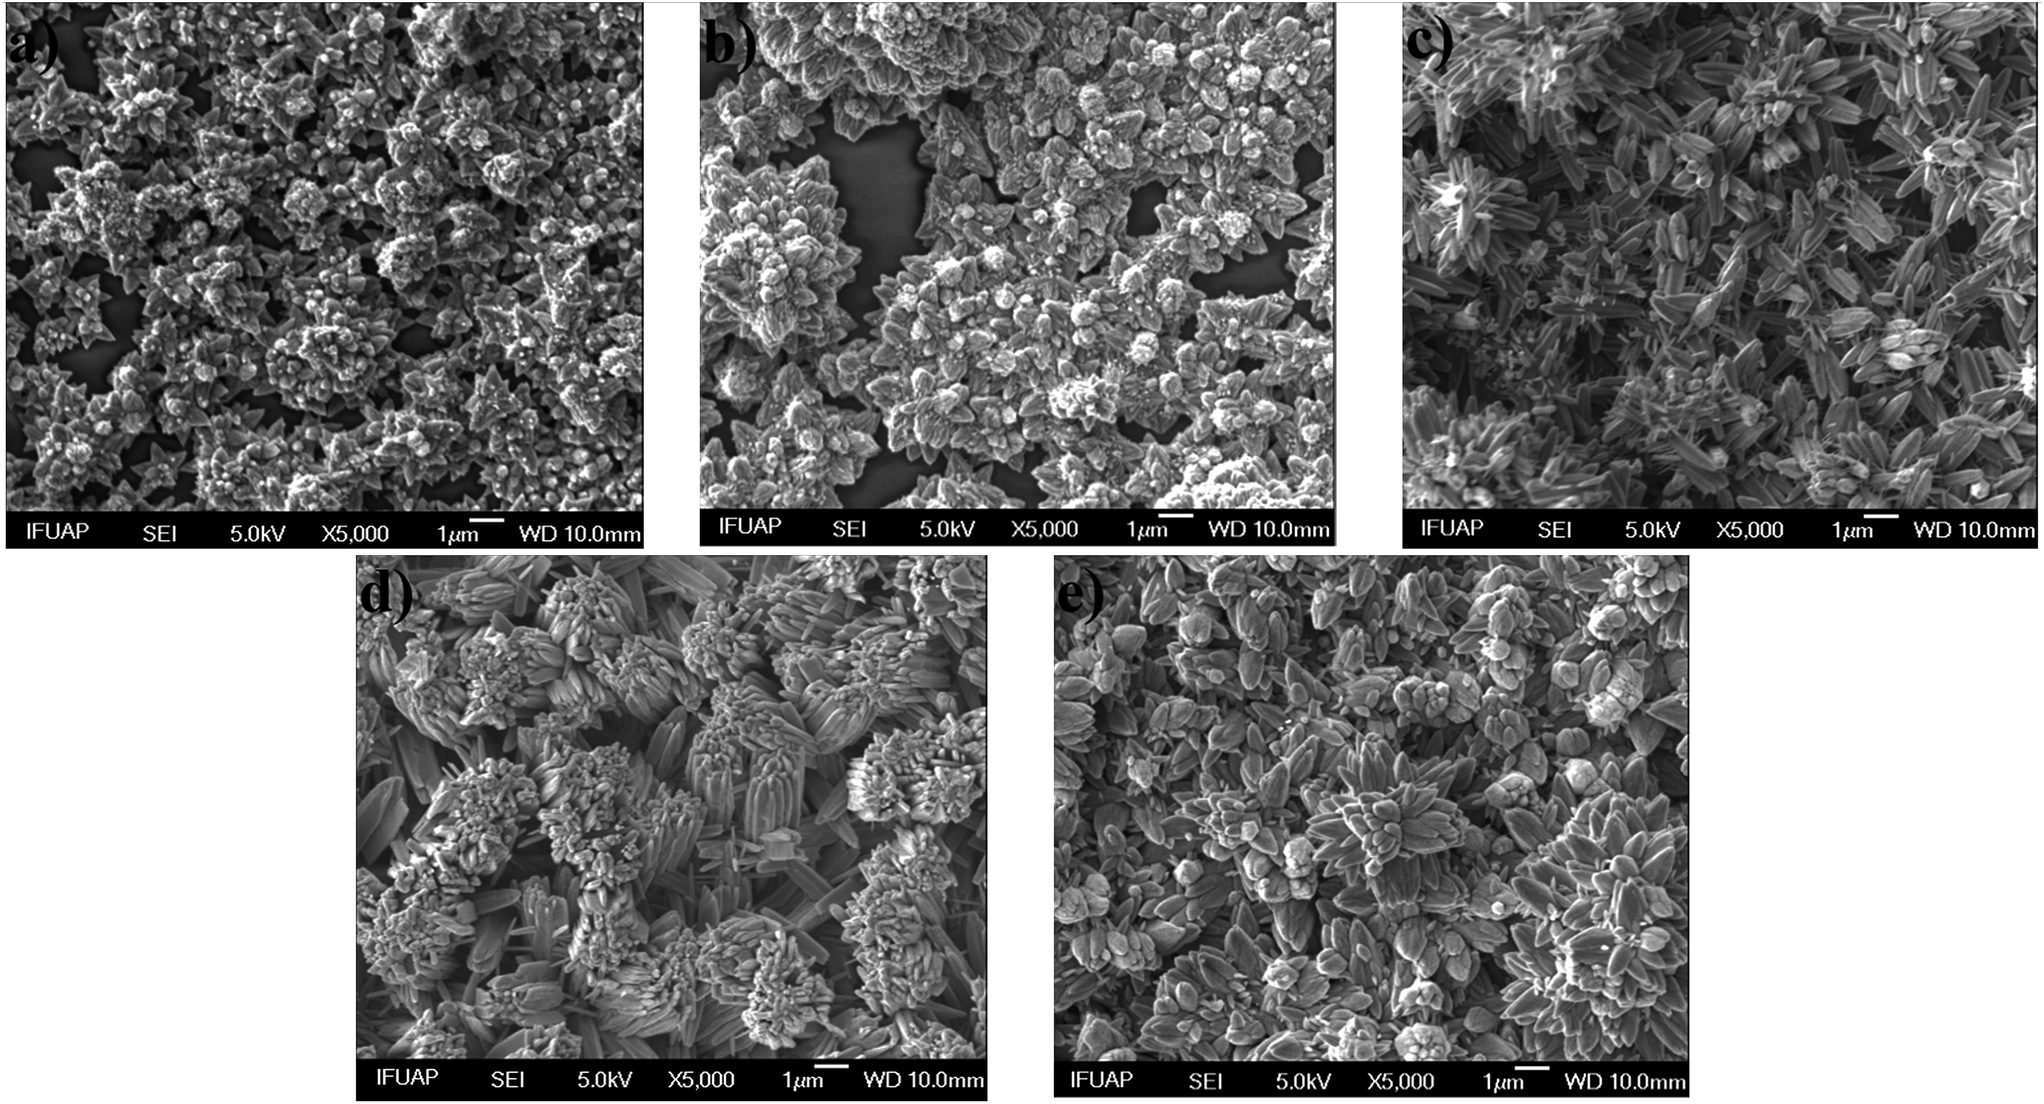
Fig. 3 shows SEM images of ZnO structures grown on glass substrates by MWCBD technique using different [OH−]; 1.77 × 10⁻⁵, 7.58 × 10⁻⁵, 2.45 × 10⁻⁴, 8.70 × 10⁻⁴ and 1.38 × 10⁻³ and the following pH values; 9.25, 9.88, 10.39, 10.94 and 11.14 that were measured respectively. Fig. 3a and b show the morphology of the ZnO films grown at 9.25 and 9.88 pH values. It is evident that in both cases the ZnO structures appear in nucleation stage (some clusters can be appreciated), the samples mainly consist of nanorods assembled into a branched morphology. The nucleation stage is by the presence of ZnOH+ and Zn(OH)2 (nucleation center) in the SDDs. From Fig. 3, it also can be seen that by increasing the pH above 9.88 (Fig. 3c–d) these structures become larger; increasing [OH−] promotes the ZnO film growth and the species Zn(OH)3− and Zn(OH)42− are dominant above 10 pH value according the SDDs, thus these species promote the ZnO film growth and the others with positive charge do not. The increased shape ratio may be due to the Zn(OH)2 clusters in the substrate surface that act partly as nucleation centers, besides the Zn(OH)3− and Zn(OH)42− ions are responsible for the ZnO growth due to their oxygen excess. On the other hand, from Fig. 3e, it can also be observed that when the pH reaches 11.14 some of the ZnO structures become smaller again. This behavior is due to the total formation of zincate ions such as Zn(OH)3− and Zn(OH)42− when NH4OH is added in excess.35–38 Once again, the predictions from the SDDs are confirmed with the morphological results in this work.
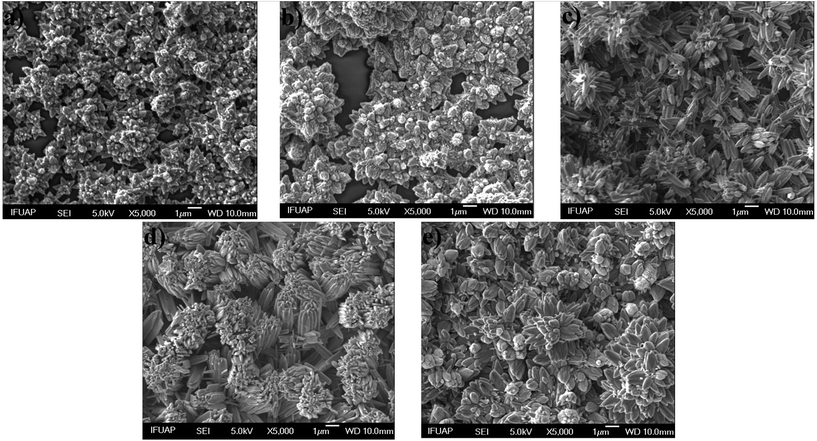 |
| | Fig. 3 SEM images of ZnO structures grown by MWCBD technique using the [OH−]; (a) 1.77 × 10⁻⁵, (b) 7.58 × 10⁻⁵, (c) 2.45 × 10⁻⁴, (d) 8.70 × 10⁻⁴ and (e) 1.38 × 10⁻³. | |
ZnO film thicknesses obtained by profilometry were: 563, 992, 2065, 4619 and 5798 (nm) as [OH−] was adjusted for 1.77 × 10⁻⁵, 7.58 × 10⁻⁵, 2.45 × 10⁻⁴, 8.70 × 10⁻⁴ and 1.38 × 10⁻³ respectively, which correspond to initials pH values of 9.25 to 11.14. Regarding these thicknesses we can say that the substrate does not influence the compositional results obtained by EDS. Increasing [OH−] the ZnO film thickness increases as well, confirming the prediction made in the SDDs.
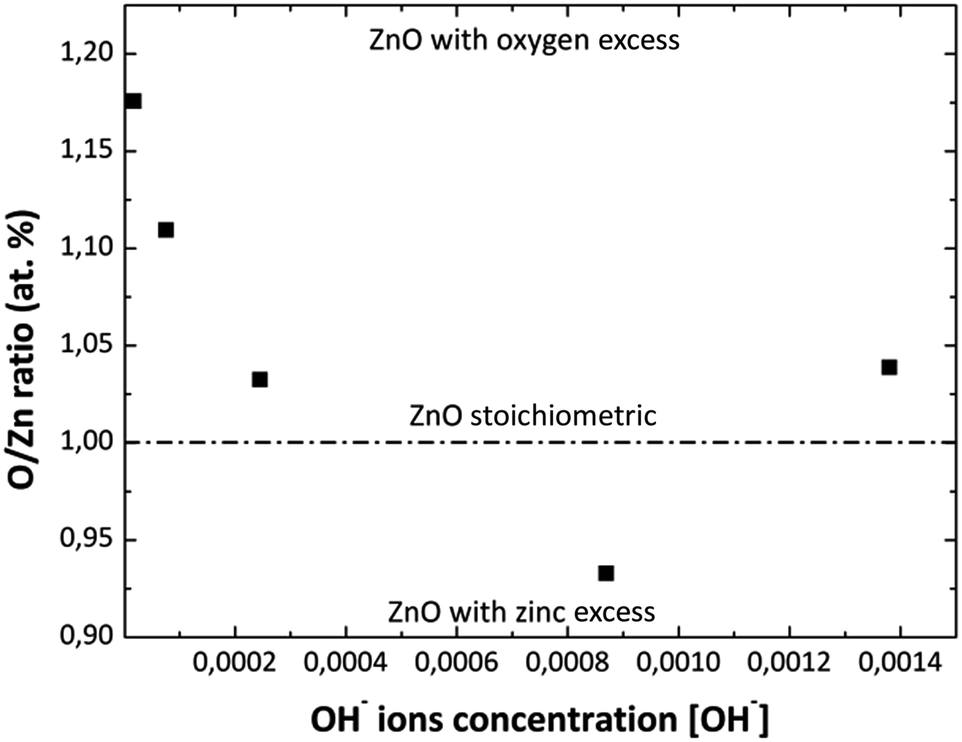
Fig. 4 shows the O/Zn (% at) ratio obtained by EDS analysis as a function of the [NH4OH] used in the MWCBD. As it can be observed from this figure, the zinc stoichiometry rate and oxygen content into the films change as the [OH−] changes as well. At the beginning with the first two [OH−] the zinc atomic percent is low, until the solution reaches a pH value of 10.39 due to the [OH−] used. This is due to greater oxygen content in the solution when NH4OH is added and/or by the species with positive charge that do not participate in the ZnO growth but they contain zinc. Then, when the pH increases above 10.39 the zinc atomic percent almost remains constant; this could mean that the ZnO growth process is stable on this pH value. It was experimentally observed that the solution becomes transparent at pH = 10.42, that should be caused by the ZnO amphoteric character, avoiding homogeneous nucleation; therefore, the thickness of the films increase as the pH increases according to profilometry measurements. This could indicate us that Zn(OH)3− and Zn(OH)42− chemical species may be favorable for the ZnO grow as it was previous discussed. The O/Zn (% at) ratios for the MWCBD ZnO films obtained by EDS analysis are consistent with the XRD results as the [NH4OH] increases in the reaction solutions.
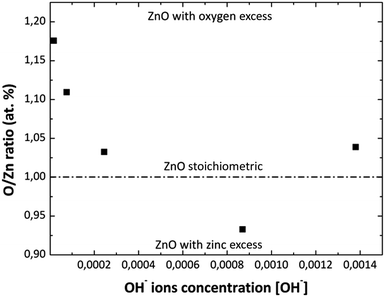 |
| | Fig. 4 Variation of O/Zn (% at) ratio in the ZnO films with the variation of [OH−] used in reaction solution obtained by EDS analysis. | |
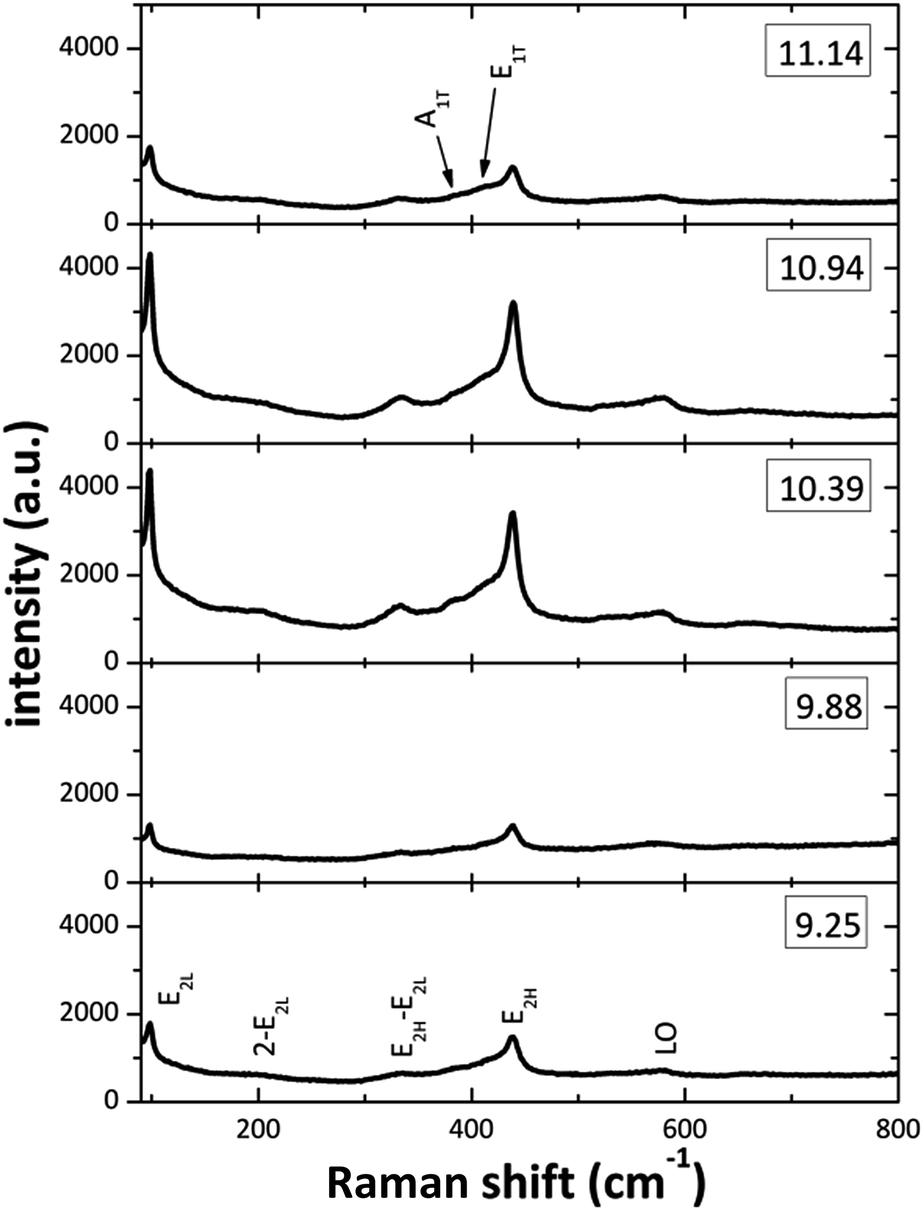
Fig. 5 displays the Raman spectra from the ZnO structures in the 90–800 cm−1 spectral range. On all the spectra at least seven Raman peaks located at about 102, 204, 335, 385, 415, 439, and 583 cm−1 can be observed. The peaks located at 102, 385, 415, 439 and 583 cm−1 correspond to the E2L, A1(TO), E1(TO), E2H and E1(LO) optic vibration modes of wurtzite ZnO, respectively.39 From the plots on the spectra (Fig. 5) it can be observed that the [OH−] modification in the reaction mixture strongly affects the intensity and width of the Raman peaks. The effects are most prominent for the E2L and E2H modes, located at about 102 and 439 cm−1, the decreased intensity and observed broadening is a strong indication that the crystal quality is impoverished for the two lowest [OH−] used. This effect can be attributed to the presence of Zn(OH)+, Zn(NH3)32+ and Zn(NH3)42+ that do not promote the ZnO growth, in the SDDs (pH 9–10) by the two lowest OH− ions concentration. On the other hand, the zincate ions Zn(OH)3− and Zn(OH)42− may affect the ZnO crystal quality inducing oxygen defects on the lattice at a pH about 11. The formations of these zincate ions linked to the (100) plane of the ZnO nanorods, when NH4OH is added in excess, are responsible of the nanostructures crystallinity degradation when the pH value is increased above of 11.0. Finally, the peak that appeared around 583 cm−1 can be ascribed to the E1(LO) mode, associated with defects such as oxygen vacancy and interstitial zinc. Raman spectra clearly demonstrates that all ZnO structured films grown for various pH values have the hexagonal wurtzite structure and those with good crystal quality are for the [NH4OH] that produced an initial pH between 10 to 11.
 |
| | Fig. 5 Raman spectra of the ZnO films prepared at different initial pH values of reaction solution. | |
4.1 ZnO chemical reaction pathway
According the results, the SDDs and the main soluble species containing Zn2+ and OH− ions, we can propose a possible chemical pathway to grow ZnO by MWCBD, which can be:| | |
Zn(OH)2 → ZnO↓ + H2O
| (12) |
| | |
Zn(OH)3− → ZnO↓ + H2O + [OH]−
| (13) |
| | |
Zn(OH)42− → ZnO↓ + H2O + 2[OH]−
| (14) |
Species with zero charge Zn(OH)2 eqn (12) are responsible for ZnO nucleation while the species Zn(OH)3− and Zn(OH)42− with negative charge are the responsible for ZnO growth. (Zn(OH)2) form clusters on the substrate (start of precipitation heterogeneous) eqn (12). Following the pathway growth, the species Zn(OH)3− and Zn(OH)42− have the availability to reconfigure the OH− ions concentration in the solution, increasing the concentration of free ions in solution as eqn (13) and (14) describe. The solution is supersaturated again and the free ions have a tendency to condense on the surface of the formed particles. On the other hand, the substrate surface plays a role in the ZnO films heterogeneous precipitation, the MWCBD technique increases the kinetics of the reaction, so the catalytic activity of the substrate surface diminishes. This process is carried out due to the species responsible for the nucleation and growth coexists for a pH > 10 values in the SDDs.
5. Conclusions
A physicochemical analysis was carried out to investigate the conditions of ZnO deposited by microwave chemical bath deposition. The reaction solution was made with zinc nitrate, urea and different [NH4OH]. SDDs was constructed as pH function in order to study and find the main chemical species in the solution at a specific [OH−] that affect the nucleation and ZnO growth. Structured ZnO films were grown on a glass surface, the effect of [NH4OH] variation on the precursor solution is related on the structural, optical and morphological properties of ZnO films. The intensity of the (002) peak in the XRD diffraction patterns of ZnO films is favored when the [NH4OH] increases up to 11-pH value and another diffraction planes are disfavored, below this pH value, more atomic oxygen enter in the ZnO unit cell. The SEM images of ZnO structures grown on glass substrates show that the shape ratio is affected by Zn(OH)2 clusters and the formation of zincate ions such as Zn(OH)3− and Zn(OH)42− that act as nucleation center and grow units respectively during heterogeneous precipitation. Therefore, it is thought that the crystal quality degradation could be caused by these ions. The intensity and width of Raman peaks were an indicative that a change in the ZnO films occurs with the variation of [NH4OH] in the precursor solution. Raman spectra clearly demonstrated that all ZnO structured films grown for different [NH4OH] have the hexagonal wurtzite structure. Moreover, the samples grown with pH value above 11.0 presents a decrease of crystallinity. A MWCBD ZnO growth reaction pathway is proposed according to the results and the chemical species of the SDDs. According to SDDs and characterization results, ZnO films can grow from pH values of 9 to 11. The best chemical conditions to deposit ZnO films by MWCBD was found in an initial pH range from 10 to 11, for depositing ZnO films with good properties in this investigation.
Conflicts of interest
The authors declare no conflict of interest.
Acknowledgements
The authors are thankful to VIEP-BUAP, Mexico for extending financial supports through the project 00134 and PRODEP postdoctoral studentship office No. DSA/103.5/16/11331. The authors are grateful to IFUAP for their help with the SEM, EDS, profilometer and Raman measurements.
References
- M. H. Huang, M. Samuel, F. Henning, Y. Haoquan, W. Yiying, K. Hannes, W. Eicke, R. Richard and Y. Peidong, Room-temperature ultraviolet nanowire nanolasers, Science, 2001, 292(5523), 1897–1899, DOI:10.1126/science.1060367
 .
. - J. Nause, M. Pan, V. Rengarajan, W. Nemeth, S. Ganesan, A. Payne, N. Li and I. Ferguson, ZnO semiconductors for lighting, in Proc. of SPIE5941, Fifth International Conference on Solid State Lighting, 2005, pp. 59410D1–59410D8, DOI:10.1117/12.624539 .
- Z. P. Wei, Y. M. Lu, D. Z. Shen, Z. Z. Zhang, B. Yao, B. H. Li, J. Y. Zhang, D. X. Zhao, X. W. Fan and Z. K. Tang, Room temperature p–n ZnO blue-violet light-emitting diodes, Appl. Phys. Lett., 2007, 90(4), 042113, DOI:10.1063/1.2435699 .
- C. Y. Lu, S. J. Chang, S. P. Chang, C. T. Lee, C. F. Kuo, H. M. Chang, Y. Z. Chiou, C. L. Hsu and I. C. Chen, Ultraviolet photodetectors with ZnO nanowires prepared on ZnO: Ga/glass templates, Appl. Phys. Lett., 2006, 89(15), 153101, DOI:10.1063/1.2360219 .
- J. B. Cui, C. P. Daghli, U. J. Gibson, R. Püsche, P. Geithner and L. Ley, Low-temperature growth and field emission of ZnO nanowire arrays, J. Appl. Phys., 2005, 97(4), 044315, DOI:10.1063/1.1854206 .
- B. Cao, X. Teng, S. H. Heo, Y. Li, S. O. Cho, G. Li and W. Cai, Different ZnO nanostructures fabricated by a seed-layer assisted electrochemical route and their photoluminescence and field emission properties, J. Phys. Chem. C, 2007, 111(6), 2470–2476, DOI:10.1021/jp066661l .
- W. Wang, G. Zhang, L. Yu, X. Bai, Z. X. Zhang and X. Zhao, Field emission properties of zinc oxide nanowires fabricated by thermal evaporation, Phys. E, 2007, 36, 86–91, DOI:10.1016/j.physe.2006.08.008 .
- J. Cui and U. Gibson, Low-temperature fabrication of single-crystal ZnO nanopillar photonic bandgap structures, Nanotechnology, 2007, 18(15), 155302, DOI:10.1088/0957-4484/18/15/155302 .
- P. Ravirajan, A. M. Peiro, M. K. Nazeeruddin, M. Graetzel, D. D. C. Bradley, J. R. Durrant and J. Nelson, Hybrid polymer/zinc oxide photovoltaic devices with vertically oriented ZnO nanorods and an amphiphilic molecular interface layer, J. Phys. Chem. B, 2006, 110(15), 7635–7639, DOI:10.1021/jp0571372 .
- J. Owen, M. S. Son, K.-H. Yoo, B. D Ahn and S. Y. Lee, Organic photovoltaic devices with Ga-doped ZnO electrode, Appl. Phys. Lett., 2007, 90(3), 033512, DOI:10.1063/1.2432951 .
- J. Q. Xu, Q. Y. Pan, Y. A. Shun and Z. Z. Tian, Grain size control and gas sensing properties of ZnO gas sensor, Sens. Actuators, B, 2000, 66(1–3), 277–279, DOI:10.1016/S0925-4005(00)00381-6 .
- H. Tian, H. Fan, J. Ma, Z. Liu, L. Ma, S. Lei, J. Fang and C. Long, Pt-decorated zinc oxide nanorod arrays with graphitic carbon nitride nanosheets for highly efficient dual-functional gas sensing, J. Hazard. Mater., 2018, 341, 102–111, DOI:10.1016/j.jhazmat.2017.07.056 .
- H. Tian, H. Fan, J. Ma, L. Ma and G. Dong, Noble metal-free modified electrode of exfoliated graphitic carbon nitride/ZnO nanosheets for highly efficient hydrogen peroxide sensing, Electrochim. Acta, 2017, 247, 787–794, DOI:10.1016/j.electacta.2017.07.083 .
- G. M. Reda, H. Fan and H. Tian, Room-temperature solid state
synthesis of Co3O4/ZnO p–n heterostructure and its photocatalytic activity, Adv. Powder Technol., 2017, 28(3), 953–963, DOI:10.1016/j.apt.2016.12.025 .
- J. Fang, H. Fan, Y. Ma, Z. Wang and Q. Chang, Surface defects control for ZnO nanorods synthesized by quenching and their anti-recombination in photocatalysis, Appl. Surf. Sci., 2015, 332, 47–54, DOI:10.1016/j.apsusc.2015.01.139 .
- A. M. Peiro, C. Domingo, J. Peral, X. Doménech, E. Vigil, M. A. Hernández-Fenollosa, M. Mollar, B. Marí and J. A. Ayllón, Nanostructured zinc oxide films grown from microwave activated aqueous solutions, Thin Solid Films, 2005, 483, 79–83, DOI:10.1016/j.tsf.2004.12.030 .
- V. R. Shinde, T. P. Gujar, T. Noda, D. Fujita, A. Vinu, M. Grandcolas and J. Ye, Growth of Shape- and Size-Selective Zinc Oxide Nanorods by a Microwave-Assisted Chemical Bath Deposition Method: Effect on Photocatalysis Properties, Chem.–Eur. J., 2010, 16, 10569–10575, DOI:10.1002/chem.200903370 .
- I. Bilecka and M. Niederberger, Microwave chemistry for inorganic nanomaterials synthesis, Nanoscale, 2010, 2(8), 1358–1374, 10.1039/B9NR00377K .
- I. J. González-Panzo, P. E. Martín-Várguez and A. I. Oliva, Role of Thiourea in the Kinetic of Growth of the Chemical Bath Deposited ZnS Films, J. Electrochem. Soc., 2014, 161(14), D761–D767, DOI:10.1149/2.0351414jes .
- I. J. González-Chan, I. J. González-Panzo and A. I. Oliva, Synthesis of ZnS Thin Films by Chemical Bath: From Room Temperature to 90 °C, J. Electrochem. Soc., 2017, 164(2), D95–D103, DOI:10.1149/2.1371702jes .
- M. Wang, Y. Zhou, Y. Zhang, S. H. Hahn and E. J. Kim, From Zn(OH)2 to ZnO: a study on the mechanism of phase transformation, CrystEngComm, 2011, 13, 6024–6026, 10.1039/C1CE05502J .
- J. Xie, P. Li, Y. Li, Y. Wang and Y. Wei, Morphology control of ZnO particles via aqueous solution route at low temperature, Mater. Chem. Phys., 2009, 114, 943–947, DOI:10.1016/j.matchemphys.2008.11.007 .
- Ruth A. McBride, John M. Kelly and Declan E. McCormack, Growth of well-defined ZnO microparticles by hydroxide ion hydrolysis of zinc salts, J. Mater. Chem., 2003, 2003(13), 1196–1201, 10.1039/B211723C .
- W. Jia, S. Dang, H. Liu, Z. Zhang, C. Yu, X. Liu and B. Xu, Evidence of the formation mechanism of ZnO in aqueous solution, Mater. Lett., 2012, 82, 99–101, DOI:10.1016/j.matlet.2012.05.013 .
- I. J. González-Panzo, P. E. Martín-Várguez and A. I. Oliva, Physicochemical Conditions for ZnS Films Deposited by Chemical Bath, J. Electrochem. Soc., 2014, 161(4), D181–D189, DOI:10.1149/2.067404jes .
- N. Alexandrova and W. L. Jorgensen, Why Urea Eliminates Ammonia Rather than Hydrolyzes in Aqueous Solution, J. Phys. Chem. B, 2007, 111, 720–730, DOI:10.1021/jp066478s .
- S. D. Yim, S. J. Kim, J. H. Baik and In-S. Nam, Decomposition of Urea into NH3 for the SCR Process, Ind. Eng. Chem. Res., 2004, 43, 4856–4863, DOI:10.1021/ie034052j .
- W. H. R. Shaw and J. J. Bordeaux, The Decomposition of Urea in Aqueous Media, J. Am. Chem. Soc., 1955, 77(18), 4729–4733, DOI:10.1021/ja01623a011 .
- A. Khorsand Zak, W. H. A. Majid, M. E. Abrishami and R. Yousefi, X-ray analysis of ZnO nanoparticles by Williamson-Hall and size-strain plot methods, Solid State Sci., 2011, 13, 251–256, DOI:10.1016/j.solidstatesciences.2010.11.024 .
- P. Bindu and S. Thomas, Estimation of lattice strain in ZnO nanoparticles: X-ray peak profile analysis, Journal of Theoretical and Applied Physics, 2014, 8, 123–134, DOI:10.1007/s40094-014-0141-9 .
- T. Pandiyarajan and B. Karthikeyan, Cr doping induced structural, phonon and excitonic properties of ZnO nanoparticles, J. Nanopart. Res., 2012, 14, 647, DOI:10.1007/s11051-011-0647-x .
- H. Morkoç and Ü. Özgür, Zinc Oxide: Fundamentals, Materials and Device Technology, WILEY-VCH Verlag GmbH & Co, KGaA, Weinheim, 2009, ISBN, 978-3-527-40813-9 Search PubMed .
- C. R. Aita, A. J. Purdes, K. L. Lad and P. D. Funkenbusch, The effect of O2 on reactively sputtered zinc oxide, J. Appl. Phys., 1980, 51, 5533–5536, DOI:10.1063/1.327472 .
- J. G. E. Gardeniers, Z. M. Rittersma and G. J. Burger, Preferred orientation and piezoelectricity in sputtered ZnO films, J. Appl. Phys., 1998, 83, 7844, DOI:10.1063/1.367959 .
- N. Tabet and A. Razak Daud, Effect of microwave power on the morphology and optical property of zinc oxidenano-structures prepared via a microwave-assisted aqueous solution method, Mater. Chem. Phys., 2011, 125, 846–852, DOI:10.1016/j.matchemphys.2010.09.038 .
- K. Govender, D. S. Boyle, P. B. Kenway and P. ÓBrien, Understanding the factors that govern the deposition and morphology of thin films of ZnO from aqueous solution, J. Mater. Chem., 2004, 14(16), 2575–2591, 10.1039/B404784B .
- R. B. Peterson, C. L. Fields and B. A. Gregg, Epitaxial chemical deposition of ZnO nanocolumns from NaOH solutions, Langmuir, 2004, 20(12), 5114–5118, DOI:10.1021/la049683c .
- Y. Zhang and J. Mu, Controllable synthesis of flower- and rod-like ZnO nanostructures by simply tuning the ratio of sodium hydroxide to zinc acetate, Nanotechnology, 2007, 18(7), 075606, DOI:10.1088/0957-4484/18/7/075606 .
- C. Roy, S. Byrne, E. McGlynn, J.-P. Mosnier, E. de Posada, D. O'Mahony, J. G. Lunney, M. O. Henry, B. Ryan and A. A. Cafolla, Correlation of Raman and X-ray diffraction measurements of annealed pulsed laser deposited ZnO thin films, Thin Solid Films, 2003, 436(2), 273–276, DOI:10.1016/S0040-6090(03)00617-5 .
|
| This journal is © The Royal Society of Chemistry 2018 |
Click here to see how this site uses Cookies. View our privacy policy here. 
 Open Access Article
 This Open Access Article is licensed under a Creative Commons Attribution-Non Commercial 3.0 Unported Licence
 *a,
I. J. González-Panzo*a,
T. Díaz-Becerrila,
C. Moralesa,
E. Rosendoa,
R. Silvab,
R. Romano-Trujilloa,
A. Coyopola,
F. G. Nieto-Caballeroc and
L. Treviño-Yarcea
*a,
I. J. González-Panzo*a,
T. Díaz-Becerrila,
C. Moralesa,
E. Rosendoa,
R. Silvab,
R. Romano-Trujilloa,
A. Coyopola,
F. G. Nieto-Caballeroc and
L. Treviño-Yarcea
 , where h, k, and l are the Miller indices. The Zn–O bond length L was evaluated using the equation:
 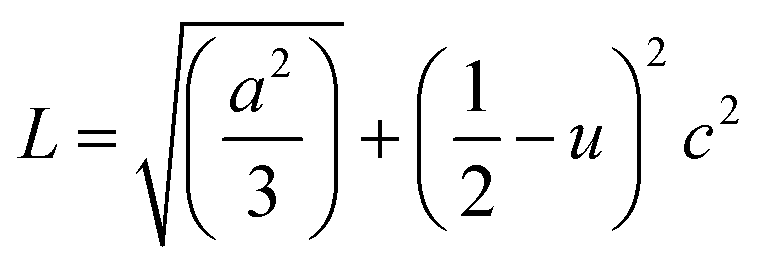 , where a and c are the lattice parameters, u is the positional parameter that is a measure of the amount by which each atom is displaced with respect to the next along the ‘c’ axis and is obtained by the expression:
 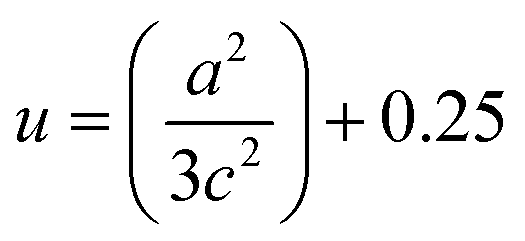 . The grain size D was determined for each crystallographic plane using Scherrer's equation from full width at half maximum peak position:
 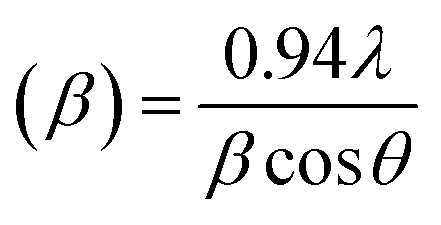 , λ = 1.54184 Å and β = FWHM in Table 2. Finally, the strain (ε) in the films was calculated using the relation:
 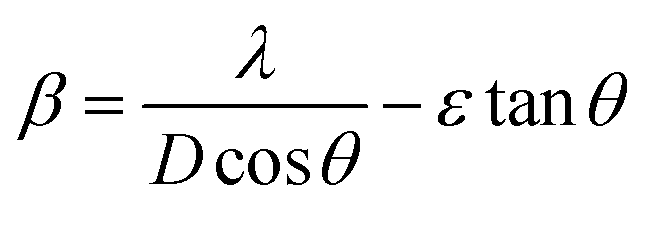 for each crystallographic plane. All equation to determine the structural parameters in this work of the ZnO films in hexagonal wurtzite phase has been reported and are widely referenced.29–31 It can be observed in Table 2, that the interplanar distance d seems stretching and shrinking for all the diffraction planes when the pH increase in the solution. The same behavior can be noted for the lattice parameters a, c and the Zn–O bond length L in Table 3 when the pH increase. This behavior can be due to the total zinc or oxygen atomic in the ZnO lattice of the films, there is more zinc or oxygen when the pH increase, the ZnO unit cell volume stretching until a pH value about 10.39, increasing the pH it shrinks and stabilizes.