
 Open Access Article
 This Open Access Article is licensed under a Creative Commons Attribution-Non Commercial 3.0 Unported Licence
A metabolomic strategy based on integrating headspace gas chromatography-mass spectrometry and liquid chromatography-mass spectrometry to differentiate the five cultivars of Chrysanthemum flower†
Lin-Ning Zhanga,
Long Wanga,
Zi-Qi Shi*bc,
Ping Li a and
Hui-Jun Li*a
a and
Hui-Jun Li*a
aState Key Laboratory of Natural Medicines, China Pharmaceutical University, No. 24 Tongjia Lane, Nanjing, China. E-mail: cpuli@163.com; Fax: +86 25 8327 1379; Tel: +86 25 8327 1379
bAffiliated Hospital of Integrated Traditional Chinese and Western Medicine, Nanjing University of Chinese Medicine, Nanjing, China
cJiangsu Province Academy of Traditional Chinese Medicine, Key Laboratory of New Drug Delivery Systems of Chinese Materia Medica, Nanjing 210028, China. E-mail: shiziqi47@126.com; Fax: +86 25 85608672; Tel: +86 25 85608672
First published on 1st March 2018
Abstract
The extreme complexity of the chemical composition of plant extracts requires an unbiased and comprehensive detection methodology to improve the potential of metabolomic study. The present work, taking five closely related cultivars of Chrysanthemum flowers as a typical case, attempts to develop a metabolomic strategy to find more markers of metabolites for precise differentiation based on headspace gas chromatography-mass spectrometry (HSGC-MS) and ultra-performance liquid chromatography coupled with quadrupole time-of-flight mass spectrometry (UHPLC-QTOF/MS). In detail, 53 batches of Chrysanthemum flower samples were collected and analyzed. The fusion of datasets from HSGC-MS and UHPLC-QTOF/MS was done in two different ways. After comparison, the fusion of the total peak area normalized metabolomic data was performed for multivariate statistical analysis. A total of 21 marker compounds (including 14 volatile and 7 nonvolatile metabolites) were identified, and a heatmap was employed for clarifying the distribution of the identified metabolites among the five cultivars. The results indicated that the integrated platform benefited the metabolomic study of medicinal and edible herbs by providing complementary information through fully monitoring functional constituents.
1. Introduction
Chrysanthemum flower (CF), derived from the dried anthodium of Chrysanthemum morifolium Ramat. (Compositae family), is a traditional Chinese medicine commonly used for its pharmacological properties of dissipating cold, clearing heat, removing toxins from the body, and brightening the eyes. It has also been used as a healthcare tea for thousands of years in China. During the long history of cultivation, the species of cultivated C. morifolium have been categorized into five main cultivars, i.e. Hangbai Ju (HbJ), Gong Ju (GJ), Chu Ju (CJ), Bo Ju (BJ), and Huai Ju (HJ). Although these cultivars are officially documented in Chinese Pharmacopoeia (2015) under the singular item of “Juhua”,1 they are individually labeled in herbal markets according to traditional customs. Due to their similar appearances, colors and aromas, intended adulteration and/or unintentional confusion can happen from time to time.Pharmacological studies have revealed a wide spectrum of biological activity for CF, such as antibacterial, anti-inflammatory, anti-oxidant, anti-tumor, and phlegm-removing effects. Three kinds of chemical including volatile oils, caffeoylquinic acids and flavonoids have been reported in CF, the latter two types of which are considered as the biologically active components responsible for these activities.2,3 Therefore, out of the caffeoylquinic acids and flavonoids, chlorogenic acid, luteoloside and 3,5-O-dicaffeoylquinic acid are quantified as the quality control markers in Chinese Pharmacopoeia (2015).1 On the other hand, the composition of volatile oils is generally recognized as an important factor that represents the delicate natural aroma of CF, especially in floral tea. Due to the diverse germplasm resources of Chrysanthemum morifolium species, these CF cultivars highly differ in chemical composition, which consequently results in different medicinal functions as well as discriminatory application.4,5 During the past few decades, many chemical profiling methods have been developed for the purpose of quality evaluation of CF, such as gas chromatography-mass spectrometry (GC-MS) for characterizing essential oils,6 and liquid chromatography-mass spectrometry (LC-MS) for characterizing flavonoids and/or caffeoylquinic acids.3,7 Additionally, chemical characterization coupled with chemometric analysis has also been employed to discriminate CF cultivars.8,9 However, few study had carried out precise differentiation based on both volatile and non-volatile components.
In recent years, metabolomics has emerged as a valuable tool for the comprehensive profiling of metabolites in herbs.10,11 Nuclear magnetic resonance (NMR) spectroscopy and MS are the main analytical techniques used in plant metabolomic studies.12 Although NMR spectroscopy can offer direct identification and quantification of abundant analytes, the NMR-based metabolomic approach suffers from a relatively low sensitivity compared with MS.13 In contrast, MS-based platforms, including GC-MS and LC-MS, have high sensitivity, high speed and broad application, giving rise to the most widely used metabolomic techniques.14,15
GC and LC are complementary in the analysis of plant metabolites, which are naturally occurring with a broad polarity range, since the primary detection tool of choice for volatile molecules is GC while the preferred analytical technique for non-volatile molecules is LC. Considering the simultaneous occurrence of volatile oils, caffeoylquinic acids and flavonoids in CF, we attempted to integrate GC-MS and LC-MS in our study to find marker metabolites of CF for the purpose of precise differentiation, for a more comprehensive view. The proposed strategy is illustrated in Fig. S1† to deliver the methodology. Firstly, the chemical profiles of CF, including volatile and nonvolatile metabolites, were globally characterized by a headspace GC-MS (HSGC-MS) method and an ultra-performance liquid chromatography coupled with quadrupole time-of-flight mass spectrometry (UHPLC-QTOF/MS) method, respectively. After the variables were extracted from the HSGC-MS and UHPLC-QTOF/MS raw data, fusion of these types of dataset was performed. Then, the combined datasets were subjected to multivariate data analyses including principle component analysis (PCA) and partial least squares-discriminant analysis (PLS-DA) for the discovery of marker metabolites with discriminant significance. The marker metabolites were screened by the variable importance in the projection (VIP) value and using the nonparametric Mann–Whitney U test. Finally, the distribution of the marker metabolites in the five CF cultivars was displayed by a heatmap visualization.
2. Materials and methods
2.1 Chemicals and reagents
Ethyl decanoate (E101444-5, ≥ 99%, Aladdin Chemistry Co. Ltd., China.) was used as the internal standard (IS-1) for HSGC-MS analysis. Galangin (A0427, ≥ 98%, Shanghai YaoYun Biotechnology Co. Ltd., China.) was used as the IS-2 for UHPLC-QTOF/MS analysis. A mixture of n-alkanes (C8–C20, Lot: BCBK5370V) was purchased from Fluka (Buchs, Switzerland) to calculate the Kovats Indices (KI) of all the volatile constituents. Acetonitrile and formic acid of chromatographic grade were purchased from Anaqua Chemicals Supply Inc., Ltd. (Houston, TX, USA). Deionized water was prepared by a Milli-Q water purification system (Millipore, Bedford, MA, USA). All other reagents and chemicals were of analytical grade.2.2 Plant materials
A total of 53 batches of five CF cultivars were purchased from herbal markets and local manufactures from Anhui, Zhejiang, Jiangsu and Henan provinces, China. The origins of the collected samples are recorded in Fig. S2.† The overall quality of all the samples, including macroscopic and microscopic characters, identified using thin layer chromatography (TLC) and HPLC assay, was in line with the criteria documented in Chinese Pharmacopoeia (2015). The voucher specimens were authenticated by the authors and deposited in the State Key Laboratory of Natural Medicines, Nanjing, China. All of the plant materials were finely pulverized and passed through a 60-mesh sieve before extraction.2.3 Gas chromatography-mass spectrometry experiments
The HS operating conditions were as follows: the equilibration time was 20 min; the headspace oven, loop, and transfer line temperatures were 100, 120 and 150 °C, respectively; the shaking time was 2 min at low intensity; the injecting time was 2 min.
GC operating conditions were as follows: the carrier gas (helium) was set at a flow rate of 1.0 mL min−1; the split ratio was 5![[thin space (1/6-em)]](https://www.rsc.org/images/entities/char_2009.gif) :1; the column temperature program of GC was initially set at 50 °C for 1 min, and was gradually increased to 100 °C at 3 °C min−1, then kept for 3 min before being gradually increased to 160 °C at 10 °C min−1, and then being increased to 270 °C at 30 °C min−1; for MS detection, an electron ionization (EI) system was used with the ionization energy at 70 eV; the temperature of the ion source and the quadrupole temperature was 230 °C and 150 °C, respectively; the mass range was 50–550 amu in the full-scan acquisition mode with 3 min of solvent delay.
:1; the column temperature program of GC was initially set at 50 °C for 1 min, and was gradually increased to 100 °C at 3 °C min−1, then kept for 3 min before being gradually increased to 160 °C at 10 °C min−1, and then being increased to 270 °C at 30 °C min−1; for MS detection, an electron ionization (EI) system was used with the ionization energy at 70 eV; the temperature of the ion source and the quadrupole temperature was 230 °C and 150 °C, respectively; the mass range was 50–550 amu in the full-scan acquisition mode with 3 min of solvent delay.
2.4 Ultraperformance liquid chromatography coupled with quadrupole time of flight mass spectrometry experiments
000 rpm for 10 min at 4 °C. Finally, the supernatant was used for UHPLC-QTOF/MS analysis. To evaluate the reproducibility of UHPLC-QTOF/MS during serial analysis, a QC sample was prepared by pooling small aliquots of each sample.MS detection was performed using QTOF/MS in negative ionization mode with a DuoSpray ion source. The QTOF/MS was calibrated in high sensitivity mode and the automated calibration device system (CDS) was set to perform an external calibration every four samples using a calibration solution. The source parameters were optimized: collision voltage (CE), 50 eV; ion spray voltage floating (ISVF), 4500 V; temperature, 500 °C; nebulizing gas (GS1), 60 psi; heater gas (GS2), 60 psi; curtain gas, 35 psi. The MS was operated in full-scan TOF/MS (100–2000 amu) and MS/MS mode (100–2000 amu) through data-independent acquisition (DIA) in a single-run analysis.16
2.5 Multivariate statistical analysis
Different normalization methods were conducted and compared, and the method with a finer resolution and prediction ability was chosen. The datasets of HSGC-MS and UHPLC-QTOF/MS were normalized and then fused. Afterwards, the combined datasets were imported to SIMCA-P 14.1 software for multivariate statistical analysis. PLS-DA and PCA were applied to distinguish five CF cultivars and obtain potential markers (VIP > 1.5), and response permutation testing (RPT) was applied for assessing the goodness of fit.Identification of the volatile components was performed by comparing the mass spectra with those recorded in the National Institute of Standards and Technology (NIST) mass-spectral library, and by comparing their KI with published literature.
Identification of the nonvolatile components was accomplished by using Formula Finder software and Chemspider online searching with built in PeakView 1.2, and later putatively confirmed by searching their accurate masses, empirical molecular formulas and MS/MS fragmentation behaviors against our in-house database and/or online metabolomic databases, including METLIN (http://www.metlin.scripps.edu) and Mass Bank (http://www.massbank.jp).
A nonparametric Mann–Whitney U test was used to investigate the differences among the five cultivars in terms of these marker compounds (p < 0.05). Receiver operating characteristic (ROC) curves (SPSS 22.0) were utilized to analyze data with the purpose of evaluating the predictive power of the identified marker compounds. The discriminatory capability of each marker compound was ranked and visualized using a heatmap.
3. Results and discussion
3.1 Optimization of extraction method and analysis conditions
Steam distillation has been used for the collection of volatile compounds in terms of GC-MS for a long time. However, the tedious procedure is not suitable for high throughput experimentation. HS has proven to be a high-efficient sampling method for volatiles, with the advantages of reducing the complexity of sample pretreatment, shortening the manipulation time and showing general applicability to various samples in different states.17,18 Therefore, HS sampling coupled with the GC-MS method was utilized in this study. The HSGC-MS method was optimized by evaluating the effects of the relevant experimental parameters on the profiling of the volatile constituents. The equilibration time (10, 20 and 30 min) and sampling amount (1.0, 1.5 and 2.0 g) were first investigated in the search for higher extraction efficiencies. It was found that HSGC-MS analysis with an equilibration time of 20 min and a sampling amount of 1.5 g showed a better result. Then, the temperatures of the headspace oven, loop, and transfer line were optimized as 100, 120 and 150 °C, respectively, with the ascending principle.As for UHPLC-QTOF/MS analysis of organic acids and flavonoids in CF, the application of an RP-C18 column would inevitably neglect some hydrophilic compounds. Nonetheless, the present study attempted to detect as many caffeoylquinic acids and flavonoids as possible with optimization of the extraction method and chromatographic conditions. Firstly, ultrasonic extraction was chosen for being time-saving and for having good repeatability and the detailed parameters including extraction time and extraction solvent were optimized. Several reagents including methanol, water, 75% methanol and 50% methanol were tried as the extraction solvent. Eventually, the procedure of water extraction-methanol precipitation was selected because of the dual functions of sample clean-up and enrichment of the target constituents. Since both caffeoylquinic acids and flavonoids possess carboxy groups and/or hydroxy groups, negative ion mode was generally selected for MS detection. However, before selection, we compared the LC/MS data generated from both positive-mode and negative-mode. Both TIC chromatograms showed similar peak shape and number, but the TIC chromatogram of negative ion mode showed a higher responsivity. For the purpose of getting useful fragment information for structural characterization, different CEs were tried (30, 40 and 50 eV). Finally, all the data were collected with a CE of 50 eV to get fragment ion information.
3.2 Repeatability and stability validation of the analyses
To ensure the reliability of the analyses, the QC sample was analyzed before, during and after the sample analysis every day. The overlapping total ion current (TIC) chromatograms (Fig. S3†) of the QC samples demonstrated that acceptable variations occurred during the large-scale sample analyses. In the meantime, for each analytical method (HSGC-MS and UHPLC-QTOF/MS), nine selected extracted ion chromatograms (EICs) in the QC samples were used to assess the system repeatability and stability. Based on the difference in polarity, several EICs from different eluting times were selected to be monitored. Relative standard deviations (RSDs) of the nine peaks from the HSGC-MS were 0.03–0.20% for the tR and 0.97–18.91% for the peak areas. RSDs of the nine peaks from the UHPLC-QTOF/MS were 0.02–0.76% for the tR and 6.71–19.15% for the peak areas (Table S1 and S2†). At the same time, RSDs of the peak areas and the total peak area percentage (area sum%) in the QC samples were used to verify the stability. Taking IS as an example, RSDs of IS-1 from the HSGC-MS were 16.31% for the peak areas and 7.04% for the area sum% (Table S3†). RSDs of IS-2 from the UHPLC-QTOF/MS were 2.35% for the peak areas and 8.45% for the area sum% (Table S4†). The tR, peak areas and area sum% of these selected peaks showed acceptable RSDs for both the HSGC-MS and UHPLC-QTOF/MS methods. Hence, these results supported their promising application to obtain high quality metabolomic data.3.3 Fusion of data and classification of five Chrysanthemum flower cultivars
Representative HSGC-MS and UHPLC-QTOF/MS TIC chromatograms of different CF cultivars are illustrated in Fig. S4 and S5,† respectively. The TIC chromatograms showed the characteristic patterns (fingerprints) of each cultivar. After the serial data processing described in Sections 2.3.3 and 2.4.3, the normalized datasets (HSGC-MS and UHPLC-QTOF/MS) were fed to SIMCA-P 14.1 software independently for multivariate data analysis.As an unbiased statistical approach, PCA was applied first. However, there were no obvious separation trends for the five groups of CF (Fig. S6†). The first three components of the models could only explain 32.0–55.6% of the variables. For this reason, PLS-DA, a supervised method, was applied for pattern recognition analysis. Fortunately, both the HSGC-MS-based model and the UHPLC-QTOF/MS-based model presented satisfying classification and prediction ability among the five CF cultivars (Table 1 and Fig. 1(a–d)). However, the two separation models did not consider the broad metabolite coverage in classification, which limited the ability to obtain a more complete overview of the metabolites in the samples. Due to the complementarity of GC and LC, it is worth considering merging the GC-MS and LC-MS measurements performed on the same samples to generate a comprehensive metabolomic profile. With the purpose of evaluating the performance of the integration of the GC and LC methods, data fusion is the prerequisite step of data analysis. However, fusion of different MS-based metabolomic methods is not straightforward. The megavariate nature of the data (i.e., a very high variable to sample ratio) especially deserves attention. To eliminate this gap between GC-MS and LC-MS variables, fusion of the data can be done in different ways and on different levels. This also has repercussions for the fusion of metabolomics data.19
| Normalization method | Type of dataset | R2X (cum) | R2Y (cum) | Q2 (cum) |
|---|---|---|---|---|
| Normalized by IS | HSGC-MS | 0.756 | 0.885 | 0.767 |
| UHPLC-QTOF/MS | 0.550 | 0.914 | 0.648 | |
| Normalized by total peak area | HSGC-MS | 0.814 | 0.831 | 0.714 |
| UHPLC-QTOF/MS | 0.638 | 0.964 | 0.719 | |
| Normalized by IS | Combined datasets | 0.535 | 0.824 | 0.581 |
| Normalized by total peak area | Combined datasets | 0.667 | 0.967 | 0.792 |
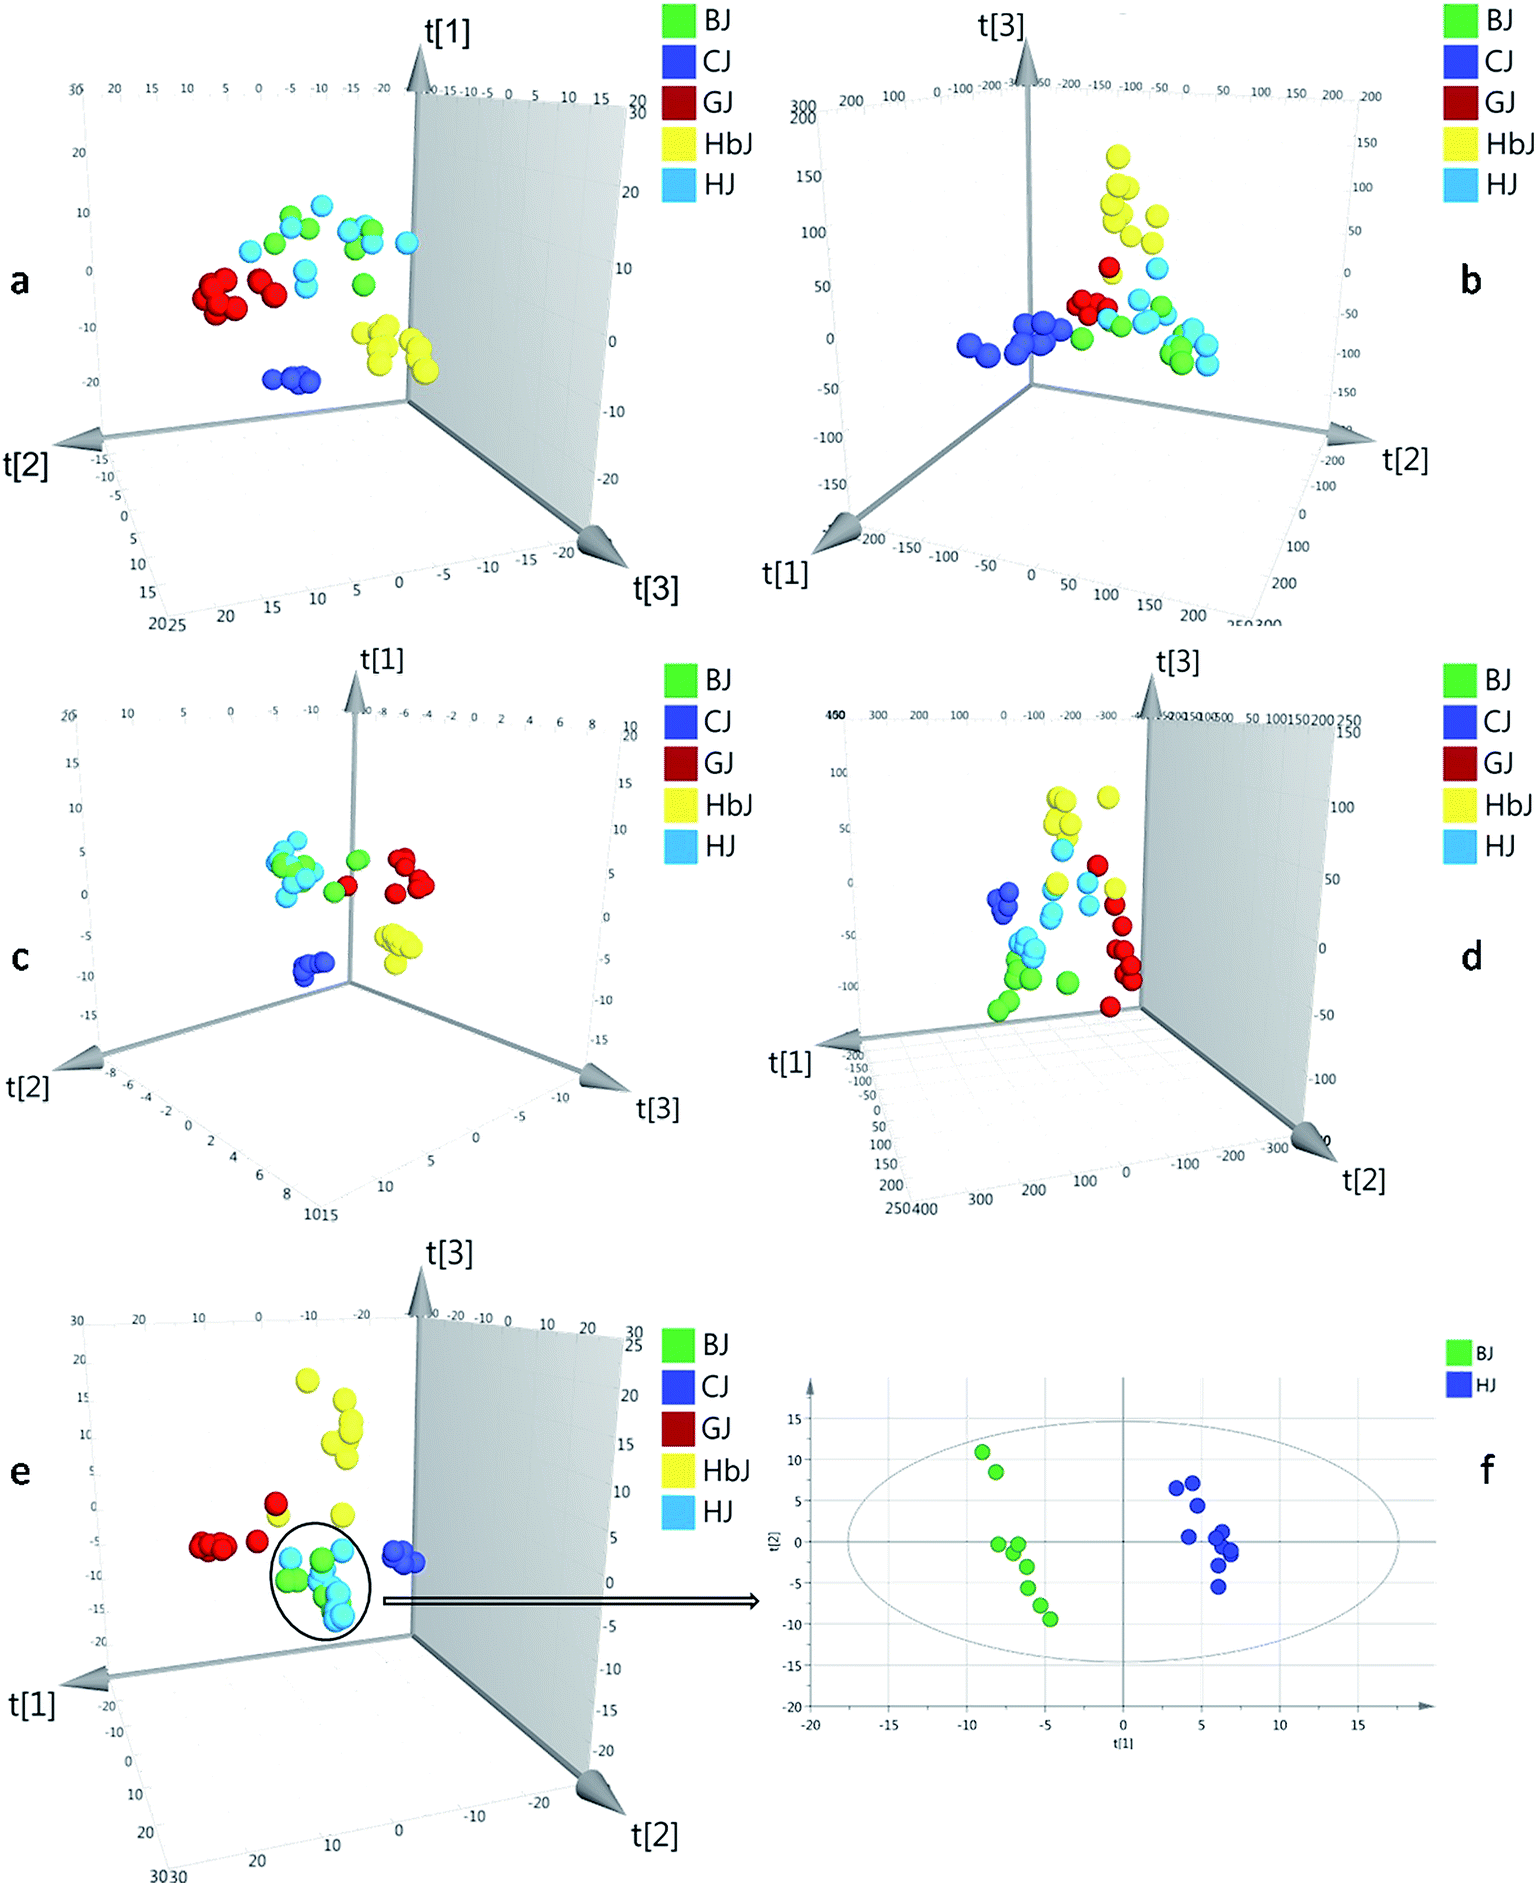 | ||
| Fig. 1 The PLS-DA score plots for datasets of HSGC-MS and UHPLC-QTOF/MS. (a) HSGC-MS datasets normalized by an internal standard, (b) UHPLC-QTOF/MS datasets normalized by an internal standard, (c) HSGC-MS datasets normalized by the total peak area, (d) UHPLC-QTOF/MS datasets normalized by the total peak area, (e) combined datasets normalized by the total peak area, and (f) PLS-DA score plots of BJ and HJ samples exported independently for PLS-DA analysis. | ||
Herein, the HSGC-MS and UHPLC-QTOF/MS datasets were firstly normalized by respective IS and then fused to generate matrix 1. The integrated dataset was imported to SIMCA-P 14.1 for PLS-DA analysis. As a result, the model described 53.5% of the variation in X (R2X (cum) = 53.5%) and 82.4% of the variation in the response Y (R2Y (cum) = 82.4%), which also predicted 58.1% of the variation in the response Y (Q2 (cum) = 58.1%) (Table 1). Compared with all the models from before fusion, the classification and prediction ability was regrettably decreased. Thus, normalization with IS could not eliminate the large gap of variables between the HSGC-MS dataset and the UHPLC-QTOF/MS dataset. Finally, the peak areas of the HSGC-MS and UHPLC-QTOF/MS chromatograms of the CF samples were normalized by the respective total peak area and summed up to generate matrix 2. Matrix 2 was also fed to SIMCA-P 14.1 for PLS-DA analysis. Consequently, this model provided finer resolution and prediction ability to distinguish these closely related CF groups with higher R2Y and Q2 (R2Y (cum) = 0.967, Q2 (cum) = 0.792, Table 1). Based on the fused dataset, the score plot of PLS-DA is shown in Fig. 1e. From the 3D score plot, the five groups of CF samples were basically separated from each other, except for the BJ and HJ groups. We inferred that BJ and HJ had a closer phylogenetic relationship. This conjecture was supported by previous publications, in which the BJ cultivar was demonstrated to be originally introduced from HJ.20,21 Once the variables of the BJ and HJ samples were extracted from matrix 2, and the extracted variables were treated as a new matrix and exported independently for PLS-DA analysis, obvious separation was observed as shown in Fig. 1f. This finding indicated that interregional variation in metabolites could also be precisely distinguished.
RPT was applied for assessing the goodness of fit (Fig. S7†). As a result, the validity of the combined model was proven. In the permutation test, all of the R2 (cum) and Q2 (cum) values calculated from the permuted data were lower than the original ones in the validation plot. The Q2 (cum) intercepted the y-axis at 0.290.
3.4 Marker metabolites discovery and identification
The variables that contributed to the observed separation were selected based on the parameter VIP value. The VIP-value threshold cut off of the metabolites was set to 1.5, and any variables above this threshold were filtered out as potential target biomarkers. Next, a nonparametric Mann–Whitney U test was carried out to compare the differences of potential markers in different cultivars of CF. Variables without significant differences among BJ, CJ, GJ, HbJ and HJ (p > 0.05) were excluded, while the variables with a VIP-value >1.5 and p < 0.05 were screened as marker compounds. In total, 28 variables were screened as marker compounds. Among them, 16 variables were from the volatile components and 12 variables were from the nonvolatile components.The identification of the volatiles was mainly based on the MS comparison with the standards in the NIST library, the KI obtained in this study, and the reported values in the literature with the same or equivalent columns. The reproducibility of the fragment patterns of the HSGC-MS experimental data is credible and fits well with the NIST database.22–28 Therefore, most of the 15 HSGC-MS variables were putatively identified except one. The identified metabolites are summarized in Table 2 with their corresponding tR values, VIP values, m/z values of the ions, matching degree with NIST, experimental KI and reported KI values, identified names, chemical formulas and CAS numbers.
| VIP | tR (min) | m/z | KI | KI* | NIST match | Compound | Formula | CAS number |
|---|---|---|---|---|---|---|---|---|
| a KI: experimental retention index.b KI*: retention index from the literature. | ||||||||
| 1.9093 | 8.630 | 170.0 | 988.21 | 989.00 | — | 2,6-Dimethyl-2-heptanol | C9H20O | 13254-34-7 |
| 1.7387 | 32.050 | 355.0 | 1981.72 | — | — | Unknown | — | — |
| 1.7205 | 6.310 | 93.0 | 919.33 | 921.00 | 879 | Tricyclene | C10H16 | 508-32-7 |
| 1.6931 | 11.591 | 184.0 | 1061.81 | 891 | 2,5,9-Trimethyldecane | C13H28 | 62108-22-9 |
|
| 1.6922 | 7.563 | 106.0 | 956.53 | 952.00 | 630 | Benzaldehyde | C7H6O | 100-52-7 |
| 1.6702 | 15.875 | 152.0 | 1160.66 | 1148.00 | 811 | cis-Verbenol | C10H16O | 1845-30-3 |
| 1.6536 | 22.811 | 109.0 | 1309.26 | 1312.00 | 711 | trans-Carvyl acetate | C12H18O2 | 1134-95-8 |
| 1.6171 | 10.099 | 136.0 | 1025.84 | 1024.00 | 834 | Limonene | C10H16 | 5989-54-8 |
| 1.5573 | 26.163 | 204.0 | 1446.77 | 1449.00 | 785 | cis-β-Farnesene | C15H24 | 28973-97-9 |
| 1.5444 | 29.951 | 222.0 | 1669.01 | 1685.00 | 761 | Eudesm-7(11)-en-4-ol | C15H24 | 473-04-1 |
| 1.5439 | 26.903 | 204.0 | 1486.00 | 1485.00 | 843 | 2-Isopropenyl-4a,8-dimethyl-1,2,3,4,4a,5,6,7-octahydronaphthalene | C15H25 | — |
| 1.5359 | 28.477 | 236.0 | 1566.23 | 1561.00 | 812 | (1R,4S)-1,7,7-Trimethylbicyclo[2.2.1]heptan-2-yl(E)-2-methylbut-2-enoate | C15H24O2 | — |
| 1.5297 | 17.105 | 59.0 | 1188.29 | 1186.00 | 503 | α-Terpineol | C10H18O | 98-55-5 |
| 1.5164 | 27.666 | 204.0 | 1525.23 | 1521.00 | 824 | β-Sesquiphellandrene | C15H24 | 20307-839 |
| 1.5121 | 26.827 | 204.0 | 1481.97 | 1481.00 | — | γ-Curcumene | C15H24 | 644-30-4 |
Unlike GC-MS, a sophisticated LC-MS database for plant metabolites has not yet been constructed because of the extensive compound testing and limited reproducibility.29 Therefore, the identification of the screened LC-MS variables was largely based on previous phytochemical studies. In this study, peakview software was used to identify metabolites through searching the accurate masses, empirical molecular formulas and MS fragmentation behaviors against our in-house database and against online metabolomic databases, including the PubChem compound database (http://www.ncbi.nlm.nih.gov), METLIN (http://www.metlin.scripps.edu/) and MassBank (http://www.massbank.jp/). Here, the processes of identification are briefly illustrated below by taking the ion of m/z 338.0776 as an example. As shown in Fig. 2, 2b shows two signals at m/z 677.1726 and m/z 338.0823, which correspond to the mono- and double-charged molecular ions of a species with the molecular weight of 678.5930 (C34H30O15). Fig. 2c shows a series of fragmentation ions, closely related with the ion at m/z 677.1726, at m/z 515.1172, 353.0902, 191.0563, 179.0350, 173.0458, 161.0258 and 135.0466. Of these, the product ions at m/z 191.0563 (loss of caffeic moiety) and m/z 173.0458 (dehydrated quinic moiety) correspond to the quinic moiety. The ions at m/z 179.0350 (loss of quinic moiety) and m/z 161.0258 (dehydrated caffeic moiety) were indicative of the caffeic moiety. Therefore, m/z 677.1726 was identified as the protonated tri-caffeoylquinic acid (tri-CQA) because of the ions at m/z 515.1172 and m/z 353.0902 (loss of caffeic moiety). According to the published literature, m/z 173.0458 present in the product ion spectrum is indicative of acylation at position C4 of CQA. Employing the information above, m/z 338.0823 could be attributed to 1,3,4-tri-CQA (Fig. 2a).30–32 A similar workflow was applied to identify the 12 discriminant ions selected in the experiments. In this way, 7 discriminant ions were tentatively identified. The other 5 ions still remain unknown due to a lack of relevant reference standards and literature even though huge efforts have been made. The details of the 12 potential markers, including tR, types of ion, ppm errors, characteristic fragment ions, identified names and formulas, are summarized in Table 3.
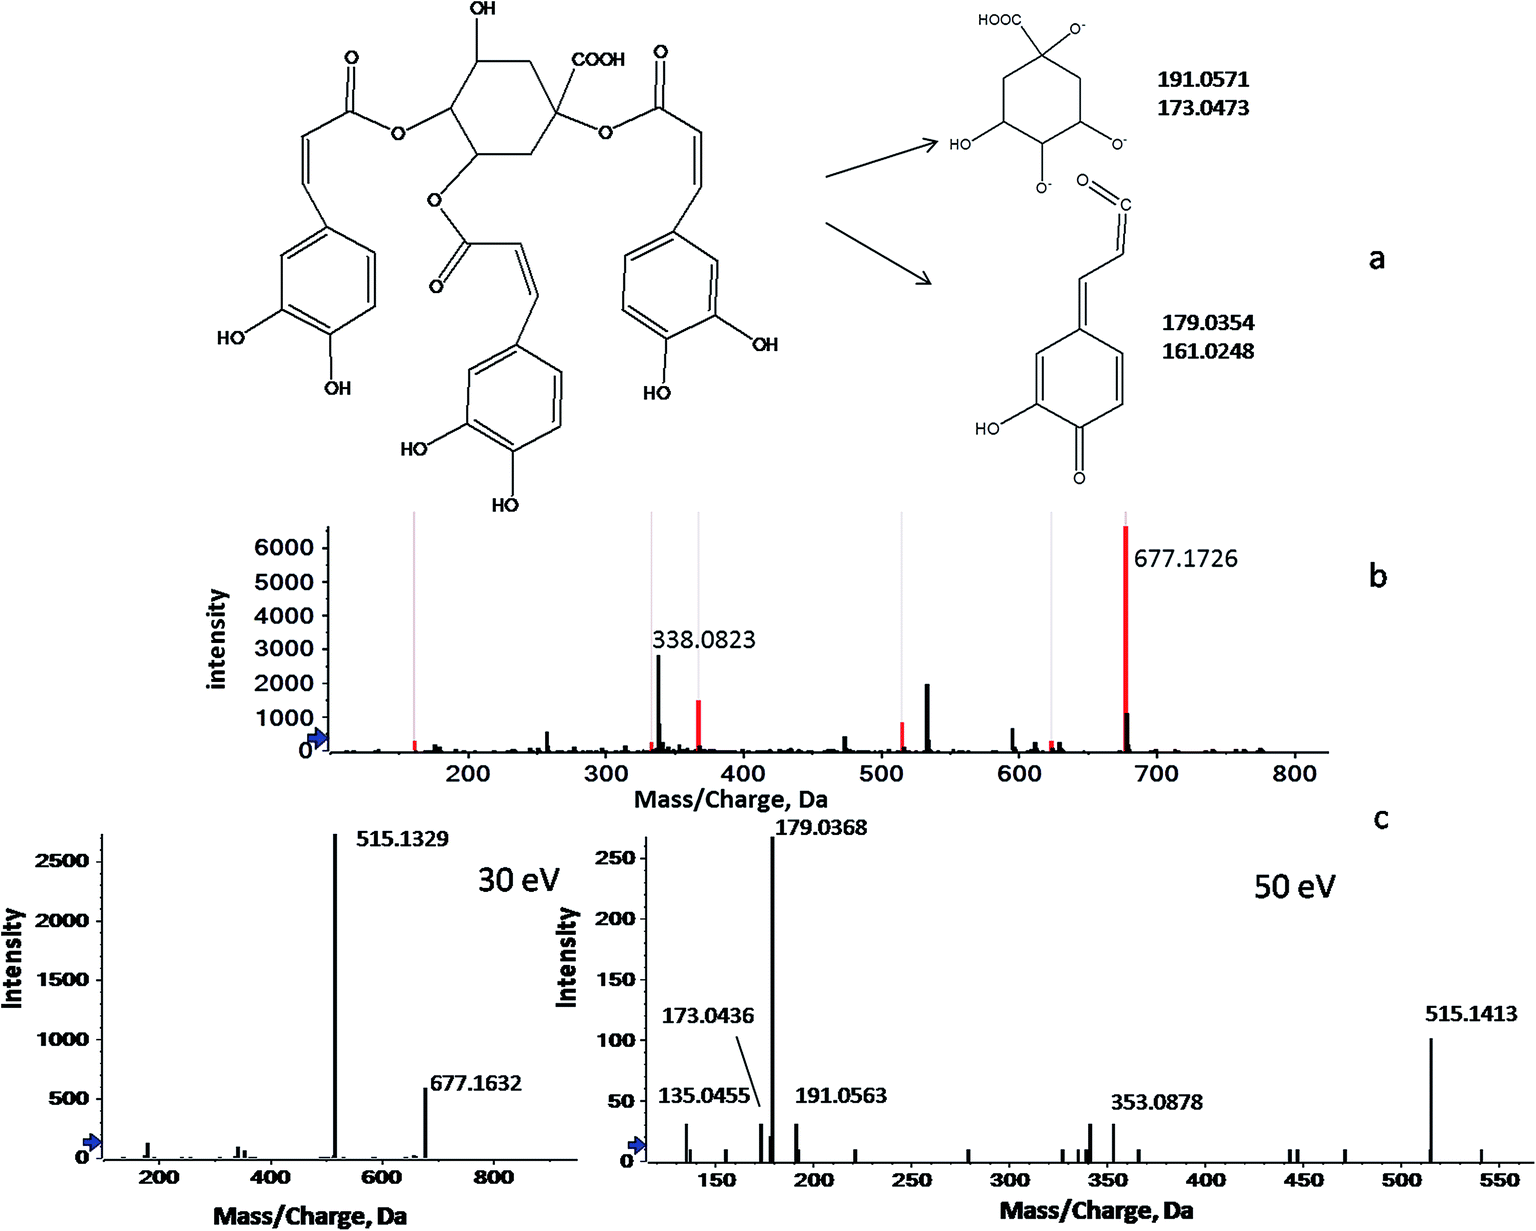 | ||
| Fig. 2 The flow diagram of the identification of a marker compound (taking the ion of m/z 338.0776 as an example). (a) The structure of 1,3,4-tri-CQA, (b) mono- (m/z = 677.1726) and double-charged (m/z = 338.0823) molecular ions in a precursor spectrum, and (c) a series of fragmentation ions closely related with the ion at m/z 677.1726 (30 and 50 eV). | ||
| VIP | tR (min) | Discriminant ion (m/z) | Type of ion | Molecular formula | Diff (ppm) | Characteristic fragment ions (m/z) | Identification |
|---|---|---|---|---|---|---|---|
| a Reported in the plant previously.b Identified tentatively from the UHPLC-QTOF/MS data and the online metabolomics databases.c Identified tentatively from the UHPLC-QTOF/MS data. | |||||||
| 1.7681 | 1.63 | 243.0604 | [M − H]− | C9H12N2O6 | −0.0019 | 200.0589, 179.8924, 152.0371, 111.0288 | Uridineb |
| 1.6135 | 4.39 | 338.0776 | [M − 2H]2− | C34H30O15 | −0.0005 | 515.1406, 353.0817, 191.0585, 179.0377, 161.0253, 135.0469, | 1,3,4-Tri-caffeoylquinic acida |
| 1.6011 | 6.11 | 359.0839 | [M − 2H]2− | C33H36O18 | 0.0067 | 557.1475, 515.1457, 353.0866, 191.0573, 179.0352, 161.0247, 135.0478 | 5-Acetyl-1,3,4-tri-caffeoylquinic acidb |
| 1.5766 | 1.39 | 402.9929 | [M − C6H5O5N]− | C15H24O17N2P2 | −0.0031 | 323.0297, 305.0080, 272.9575, 174.9829, 158.9270, 136.9221, 111.0221 | Uridine-5′-diphospho glucoseb |
| 1.5485 | 3.88 | 639.1177 | [M + HCOOH–H]− | C30H26O13 | −0.0178 | 463.0769, 431.0962, 351.0514, 151.0063, 593.2811, 269.0451, 287.0530 | Apigenin-7-caffeoyl glucosidea |
| 1.5406 | 3.65 | 667.1477 | [M − H]− | C30H36O17 | −0.0982 | 504.0724, 463.0810, 301.0262, 299.0187, 271.0277 | Isoquercetin-2-O-(6′-acetyl-glucoside)-2′-glucosideb |
| 1.5130 | 2.25 | 789.2065 | [M − H]− | C33H41O22 | −0.0230 | 771.1759, 669.1614, 579.1319, 431.1158, 359.0972, 341.0860, | Dihydroluteolin-7-O-raffinosidec |
| 1.8447 | 1.15 | 277.0331 | [M − H]− | C8H10N2O9 | 121.0662, 135.0832, 101.0305, 114.0577 | Unknown | |
| 1.7048 | 1.38 | 111.9497 | Fragment ion | 242.9859, 238.1309 | Unknown | ||
| 1.5392 | 5.19 | 521.1998 | [M − H]− | C26H34O11 | 329.1398, 181.0512, 166.0237, 160.0541 | Unknown | |
| 1.5160 | 18.28 | 627.2366 | [M − H2O − H]− | C29H42O16 | — | Unknown | |
| 1.5088 | 18.46 | 552.2392 | [M − H]− | C29H35N3O8 | 381.2244, 255.2377, 161.0485, 101.0262 | Unknown | |
ROC curve analysis was used for assessing the specificity of the marker compounds in the distinction of different CFs. As shown in Fig. S8 and Tables S5–8,† the area under the curve (AUC) for CJ–HbJ, CJ–GJ, and GJ–HbJ ranged from 0.9 to 1.0, while the AUC for BJ-HJ was 0.5 to 0.7, the results of which are also consistent with the PLS-DA analysis. The results indicated that the identified biomarkers had a powerful diagnostic performance for most of the CFs.
3.5 Distribution of marker compounds in five Chrysanthemum flower cultivars
Once the marker compounds had been screened and putatively identified, the next step was to clarify the distribution of the marker compounds in different CF cultivars. This information is always of significance for phytochemotaxonomy. Therefore, a heatmap visualization was performed to obtain a deeper understanding of the distribution of the marker compounds. The relative concentration trends of the marker compounds in all the test samples are illustrated in Fig. 3. Although the genetic relationship among these five cultivars seemed to be very complicated due to ex situ introduction and mutual grafting during the long cultivation history,21 the heatmap clearly indicates that there are high chemical heterogeneities. Very clearly, among the identified marker compounds, the flavonoids including isoquercetin-2-O-(6′-acetyl-glucoside)-2′-glucoside, apigenin-7-caffeoylglucoside, dihydroluteolin-7-O-raffinoside, and the volatile oils such as γ-curcumene, (1R,4S)-1,7,7-trimethylbicyclo[2.2.1]heptan-2-yl(E)-2-methylbut-2-enoate, 2-isopropenyl-4a,8-dimethyl-1,2,3,4,4a,5,6,7-octahydronaphthalene, eudesm-7(11)-en-4-ol, cis-β-farnesene and β-sesquiphellandrene were mainly distributed in CJ, while these markers could be rarely found in other cultivars. Similarly, BJ was chemically characterized by the presence of the following four volatile constituents: α-terpineol, cis-verpineol, trans-carvyl acetate and benzaldehyde. HbJ was characterised by 2,6-dimethyl-2-heptanol and limonene, HJ by two caffeoylquinic acids (1,3,4-tri-caffeoylquinic acid and 5-acetyl-1,3,4-tri-caffeoylquinic acid) and two volatiles (limonene and α-terpineol), and GJ by two volatiles viz. tricyclene and benzaldehyde.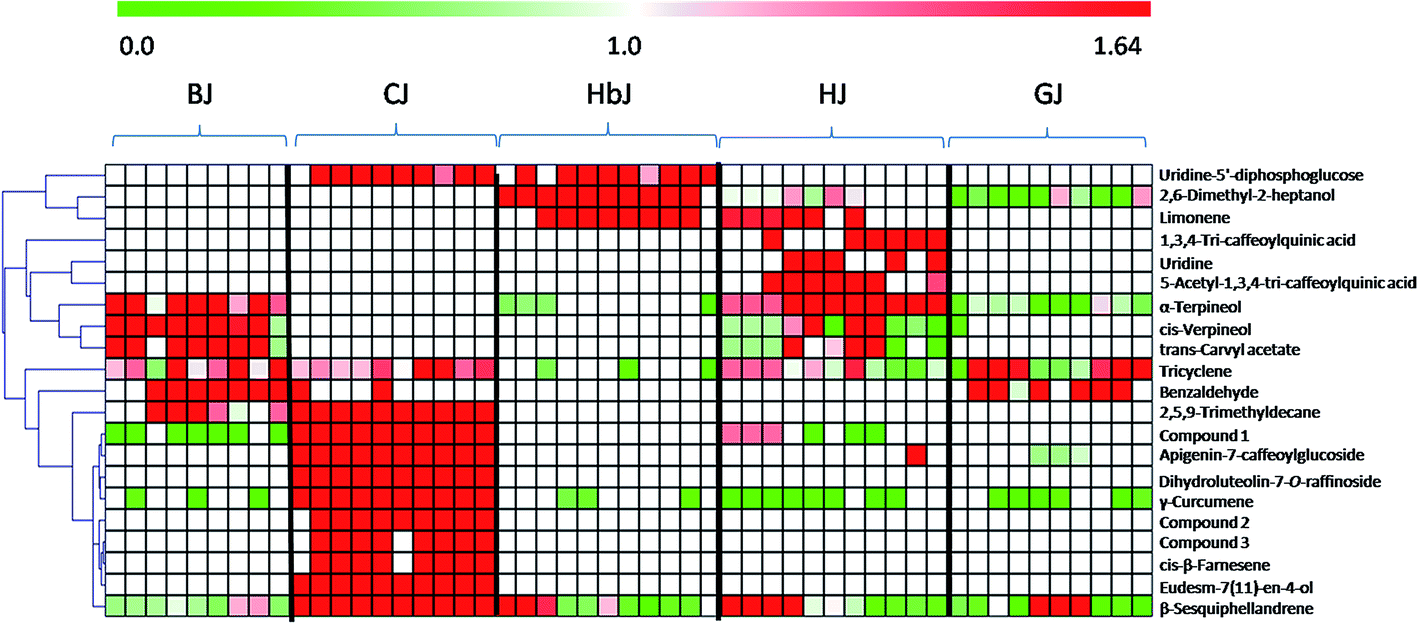 | ||
| Fig. 3 The heatmap of the identified marker compounds: the relative concentration trends of the potential chemical markers in all the test samples using heatmaps are illustrated, in which the shade of the color indicates the different concentration levels of a chemical. The more red or more green the color is, the higher or lower the relative concentration level is, respectively. Compound 1: isoquercetin-2-O-(6′-acetylglucoside)-2′-glucoside. Compound 2: (1R,4S)-1,7,7-trimethylbicyclo[2.2.1]heptan-2-yl(E)-2-methylbut-2-enoate. Compound 3: 2-isopropenyl-4a,8-dimethyl-1,2,3,4,4a,5,6,7-octahydronaphthalene. | ||
As one of the most famous geo-herbs indigenous to the Wuzhi and Wenxian counties of the Henan province, HJ has been considered to be the father of medicinal CF cultivars.33 BJ was also a commonly medicinally-used cultivar, and its characteristic distribution of the marker compounds was more similar to that of HJ than to the other CF cultivars. The cultivars of GJ and HbJ are often consumed as health tea, and according to the clinical practice of traditional Chinese medicine (TCM), the former is good at clearing liver heat while the latter is good at clearing lung heat.34 Although the specific compounds responsible for the different efficacies remain unclear, a great discrepancy between GJ and HbJ could be seen in the heatmap. As for CJ, it was clearly distinguishable from the other cultivars, suggesting a distant genetic relationship with the other CF cultivars. Meanwhile, the quality consistency among the different batches for this cultivar seemed to be considerably higher than for the others, which might be due to its relatively fixed geo-origin. This consistent quality of CJ guarantees its irreplaceable medicinal value, which is supported by previous publications.33
These experimental data, taken together, indicate that this metabolomic platform based on the fusion of HSGC-MS and UHPLC-MS datasets is a powerful way to visualize the difference in closely related species of medicinal herbs.
4. Conclusions
In this study, a metabolomic strategy based on the fusion of HSGC-MS and UHPLC-MS datasets was firstly proposed to differentiate the five CF cultivars. HSGC-MS was applied for the analysis of volatile metabolites, and UHPLC-MS provided a suitable complementary method to effectively characterize nonvolatile substances. A total of 21 marker compounds (14 volatile and 7 nonvolatile) were putatively identified. A heatmap was employed for clarifying the distribution of identified metabolites, and this could be useful for phytochemotaxonomy studies of CF species. More significantly, this integrated metabolomic strategy might be expanded to resolve other more complicated issues in plant systems where a full scale of metabolites instead of specifically targeted metabolites are really involved.Conflicts of interest
The authors have declared no conflict of interest.Acknowledgements
This work was supported by the National Natural Science Foundation of China (No. 81322051, 81130068 and 81603500). We also thank the Project Funded by the Priority Academic Program Development (PAPD) of Jiangsu Higher Education Institutions.References
- Chinese Pharmacopoeia Commission, Pharmacopoeia of the People’s Republic of China 2015, Chinese Medical Science and Technology Press, Beijing, 2015, vol. 1, pp. 310–311 Search PubMed.
- X. Y. Hang, L. H Duan and D. Zhao, Lishizhen Med. Mater. Med. Res., 2008, 7, 1702–1704 Search PubMed.
- Y. R. Niu, Y. R. Yin, L. L. Yin, S. H. Luo, J. Dong, H. Wang, Y. K. Hashi and S. Z. Chen, Phytochem. Anal., 2013, 24, 59–68 CrossRef CAS PubMed.
- D. L. Li, J. Anhui Agric. Sci., 2010, 7, 3444–3446 Search PubMed.
- X. R. Liang, H. Wu and W. K. Su, Food Anal. Method, 2014, 7, 197–204 CrossRef.
- H. N. Sun, J. Zhang, Q. Q. Fan, X. Y. Qi, F. Zhang, W. M. Fang, J. F. Jiang, F. D. Chen and S. M. Chen, Molecules, 2015, 20, 5346–5359 CrossRef CAS PubMed.
- Y. J. Chen, C. Y. Lin, S. S. Cheng and S. T. Chang, J. Agric. Food Chem., 2015, 63, 810–820 CrossRef CAS PubMed.
- Y. Y. Xie, J. L. Qu, Q. L. Wang, Y. Wang, M. Yoshikawa and D. Yuan, J. Agric. Food Chem., 2012, 60, 12574–12583 CrossRef CAS PubMed.
- Y. Q. Han, L. Q. Wang, X. H. Ying, J. M. Peng, M. Jiang, G. Bai and G. A. Luo, J. Ethnopharmacol., 2015, 174, 387–395 CrossRef CAS PubMed.
- L. X. Duan, T. L. Chen, M. Li, M. Chen, Y. Q. Zhou, G. H. Cui, A. H. Zhao, W. Jia, L. Q. Huang and X. Q. Qi, Mol. Plant, 2012, 2, 376–386 CrossRef PubMed.
- L. X. Guo, R. Li, K. Liu, J. Yang, H. J. Li, S. L. Li, J. Q. Liu, L. F. Liu and G. Z. Xin, J. Chromatogr. A, 2015, 1425, 129–140 CrossRef CAS PubMed.
- L. Wang, L. F. Liu, J. Y. Wang, Z. Q. Shi, W. Q. Chang, M. L. Chen, Y. H. Yin, Y. Jiang, H. J. Li, P. Li, Z. P. Yao and G. Z. Xin, Anal. Chim. Acta, 2017, 997, 28–35 Search PubMed.
- G. A. N. Gowda and D. Raftery, J. Magn. Reson., 2015, 260, 144–160 CrossRef PubMed.
- D. H. Robert, New Phytol., 2006, 169, 453–468 CrossRef PubMed.
- D. K. Lee, M. H. Yoon, Y. P. Kang, J. Yu, J. H. Park, J. Lee and S. W. Kwon, Food Chem., 2013, 141, 3931–3937 CrossRef CAS PubMed.
- Z. Y. He, Y. P. Xu, L. Wang, Y. Peng, M. Luo, H. Y. Cheng and X. W. Liu, Food Chem., 2016, 196, 1248–1255 CrossRef CAS PubMed.
- M. C. G. Mas, L. M. G. Rian, C. Alfaro, J. L. Rambla and A. I. Padilla, Int. J. Food Sci. Technol., 2009, 44, 510–518 CrossRef.
- L. M. Chen, A. Kotani, F. Kusu, Z. M. Wang, J. J. Zhu and H. Hakamata, Chem. Pharm. Bull., 2015, 63, 25–32 CrossRef CAS PubMed.
- A. K. Smilde, M. J. Werf, S. Bijlsma, B. J. C. Werff and R. H. Jellema, Anal. Chem., 2005, 77, 6729–6736 CrossRef CAS PubMed.
- L. Liu, Q. S. Guo and W. B. Xu, China J. Chin. Mater. Med., 2008, 33, 2891–2895 Search PubMed.
- D. Q. Wang, S. J. Liu and Y. M. Liang, J. Anhui TCM Coll., 2001, 20, 45–48 Search PubMed.
- R. P. Adams, Identification of essential oil components by gas chromatography/quadrupole mass spectroscopy, Allured Publishing Corporation, Appendix I, Carol Stream, IL, 2001 Search PubMed.
- X. D. Ma, W. W. Mao, P. Zhou, P. Li and H. J. Li, Microsc. Res. Tech., 2015, 78, 633–641 CrossRef CAS PubMed.
- D. S. B. Alexandre and S. M. D. Morais, Ind. Crops Prod., 2015, 76, 557–564 CrossRef.
- G. Flamini, P. L. Cioni and I. Morelli, J. Agric. Food Chem., 2013, 51, 2267–2271 CrossRef PubMed.
- L. Sheng, L. Y. Wen, C. X. Zhao and Y. Z. Liang, J. Instrum. Anal., 2008, 27, 84–87 Search PubMed.
- P. A. Robert, J. Am. Soc. Mass Spectrom., 2005, 16, 1902–1903 CrossRef.
- R. C. H. De Vos, S. Moco, A. Lommen, J. J. B. Keurentjes, R. J. Bino and R. D. Hall, Nat. Protoc., 2007, 2, 778–791 CrossRef CAS PubMed.
- S. Moco, R. J. Bino, O. Vorst, H. A. Verhoeven, J. Groot, T. A. Beek, J. Vervoort and C. H. R. De Vos, Plant Physiol., 2006, 141, 1205–1218 CrossRef CAS PubMed.
- M. N. Clifford, S. Knight and N. Kuhnert, J. Agric. Food Chem., 2005, 53, 3821–3832 CrossRef CAS PubMed.
- M. N. Clifford, S. Knight and N. Kuhnert, J. Agric. Food Chem., 2003, 51, 2900–2911 CrossRef CAS PubMed.
- S. T. Wang, H. Yang, W. Gao, H. J. Li and P. Li, J. Pharm. Biomed. Anal., 2016, 119, 91–98 CrossRef CAS PubMed.
- J. Zhou, Studies on the problem of origin of Chinese garden Chrysanthemum, Beijing Forestry University, Beijing, 2009 Search PubMed.
- L. Zhuo, X. Li and G. J. Qiu, J. Neijiang Norm. Univ., 2008, 23, 104–105 Search PubMed.
Footnote |
| † Electronic supplementary information (ESI) available. See DOI: 10.1039/c7ra13503c |
| This journal is © The Royal Society of Chemistry 2018 |