 Open Access Article
Creative Commons Attribution 3.0 Unported Licence
GSH-doped GQDs using citric acid rich-lime oil extract for highly selective and sensitive determination and discrimination of Fe3+ and Fe2+ in the presence of H2O2 by a fluorescence “turn-off” sensor
Khanitta Saenwonga,
Prawit Nuengmatchab,
Phitchan Sricharoena,
Nunticha Limchoowonga and
Saksit Chanthai *a
*a
aMaterials Chemistry Research Center, Department of Chemistry, Center of Excellence for Innovation in Chemistry, Faculty of Science, Khon Kaen University, Khon Kaen 40002, Thailand. E-mail: sakcha2@kku.ac.th
bNanomaterials Chemistry Research Unit, Department of Chemistry, Faculty of Science and Technology, Nakhon Si Thammarat Rajabhat University, Nakhon Si Thammarat 80280, Thailand
First published on 14th March 2018
Abstract
Synthesis and characterization of graphene quantum dots (GQDs) simultaneously doped with 1% glutathione (GSH-GQDs) by pyrolysis using citric acid rich-lime oil extract as a starting material. The excitation wavelength (λmax = 337 nm) of the obtained GSH-GQD solution is blue shifted from that of bare GQDs (λmax = 345 nm), with the same emission wavelength (λmax = 430 nm) indicating differences in the desired N and S matrices decorating the carbon based nanoparticles, without any background effect of both ionic strength and masking agent. For highly Fe3+-sensitive detection under optimum conditions, acetate buffer at pH 4.0 in the presence of 50 μM H2O2, the linearity range was 1.0–150 μM (R2 = 0.9984), giving its calibration curve: y = 34.934x + 169.61. The LOD and LOQ were found to be 0.10 and 0.34 μM, respectively. The method’s precisions expressed in terms of RSDs for repeatability (n = 3 × 3 for intra-day analysis) were 2.03 and 3.17% and for reproducibility (n = 5 × 3 for inter-day analysis) were 3.11 and 4.55% for Fe2+ and Fe3+, respectively. The recoveries of the method expressed as the mean percentage (n = 3) were found in the ranges of 100.1–104.1 and 98.08–102.7% for Fe2+ and Fe3+, respectively. The proposed method was then implemented satisfactorily for trace determination of iron speciation in drinking water.
1. Introduction
Iron (Fe) is a metal of biological, clinical, environmental, and industrial importance. It is one of the most essential trace elements in living biosystems and plays indispensable and versatile roles in many physiological and pathological processes, including enzyme catalysis, oxygen transport, cellular metabolism, electron transfer, and DNA and RNA synthesis.1–5 Speciation of iron, an occurrence of the element in two oxidation states (II and III), is mostly found in nature. Different biological activities of Fe2+and Fe3+ are well known. Fe2+ is favored for absorption by biological cells. To treat clinical symptoms of iron deficiency some medicaments containing Fe2+ can be administrated to eliminate complications. The low stability of Fe2+ caused by its easy oxidation to Fe3+ by oxygen in the air can result in a decrease in the real Fe2+ concentration in pharmaceuticals.6 However, both a deficiency and an excess accumulation of iron in the human body can induce serious disorders such as anaemia, intelligence decline, arthritis, heart failure, diabetes and cancer.7–9 Thus, the determination of iron speciation is of fundamental importance for the early identification and diagnosis of these diseases. In addition, the measurement of iron concentration in water samples is also crucial for environmental safety.10Currently, several analytical techniques for determination of Fe2+ and Fe3+ ions have been applied including solid phase extraction,11 fiber-optic chemosensor,12 voltammetric methods,13 high performance liquid chromatography,14 capillary electrophoresis,15 inductively coupled plasma mass spectrometry,16 flow injection analysis17 and chemiluminescence.18 Although these techniques are highly sensitive and selective, they require tedious sample preparation and preconcentration procedures, expensive instruments, and professional personnel.
In recent years, several fluorescence sensors have been widely investigated for the selective detection of iron speciation in biological systems because of their ability to provide a simple, sensitive, and selective method for monitoring without the need for any pretreatment of the sample; these techniques also have the advantages of spatial and temporal resolution.19–21 Therefore, the development of a novel fluorescence probe with low cytotoxicity, excellent biocompatibility, and high water solubility has become increasingly important and urgent. Recently, graphene quantum dots (GQDs) have ignited increasing research interest as an exciting class of carbon nanomaterial, and have emerged as a potential new platform in designing and tuning fluorescence (FL) biosensing and imaging.22–35 GQDs were discovered very recently as a class of zero-dimensional graphitic nanomaterials with lateral dimensions less than 100 nm in single layers, double layers and few layers (3 to <10).36–39 Moreover, similar to graphene nanosheets, GQDs have excellent characteristics such as large surface area, large diameter, fine surface grafting via the π–π conjugated network or surface groups and other special physical properties.40,41 Furthermore, the carboxyl and hydroxyl groups at their edge enable them to display the excellent properties of high biocompatibility, low toxicity, chemical inertness and good water-solubility for successive functionalization with various organic, inorganic, polymeric or biological species.42–46 On the basis of these unique properties, various GQD-based fluorescence probes for the detection of metal ions (Fe3+, Cu2+, or Pb2+),35–37 small organic molecules (2,4,6-trinitrotoluene or para-nitrophenol)47,48 and biomaterials (pyrocatechol, human immunoglobulin G, or protein kinase)49–51 have been explored. The major disadvantage of GQD-based fluorescence probes is that the sensitivity and selectivity are limited due to the non-specificity of GQDs.52–54 Doping GQDs with heteroatoms can effectively modulate their band gap and electronic density, enhancing the chemical activity of GQDs for practical applications, which has been proven through theoretical calculations and detailed experiments.55–59 For example, nitrogen-doped GQDs (N-GQDs) showed efficient electrocatalytic activity for the oxygen reduction reaction46 and cellular and deep-tissue imaging.60,61 Boron-doped GQDs (B-GQDs) gave rise to rich fluorescence owing to their peculiar interaction with the surrounding media.62 Sulfur-doped graphene quantum dots (S-GQDs) showed a stable blue-green fluorescence, drastically improved electronic properties, and increased surface chemical reactivity compared with undoped GQDs.63
Towards this target, a lot of synthesis methods for various functionalized and non-functionalized GQDs have been established in recent years. Some toxic small organic molecules have been employed to fabricate GQDs using multistep oxidative condensation reactions in organic solutions. In most cases, however, these organic synthetic methods suffer from some disadvantages, such as harsh reaction conditions, high prices, tedious processes, and the use of toxic starting materials.64–68 In this regard, searching for precursors from regular food may provide green routes that could overcome the above mentioned drawbacks. Some natural foods have been consumed by human beings for centuries, and are still very common in daily life. If natural food could be used as a non-toxic starting material for the synthesis of GQDs, such eco-friendly synthesis would be valuable. Recently there have been a few reports on fabricating fluorescent QDs from natural foods such as rice husk,69 honey,70 glucose,71 milk,72 orange juice73 and coffee74 due to their low cost, easy availability, and nearly unlimited sources.
These results inspired us to further produce fluorescent GQDs from natural foods. In this work, a selective fluorescence sensor for speciation of iron was developed based on graphene quantum dots, functionalized with glutathione (GSH-GQDs) prepared from lime oil extract. The lime oil extract was pyrolyzed in the presence of glutathione (GSH) to prepare N and S co-doped graphene quantum dots (GSH-GQDs). In the presence of ferric ion (Fe3+), the fluorescence intensity of the GSH-GQDs decreased linearly with increasing Fe3+ concentration due to quenching. The detection of Fe2+ is similar to the procedure mentioned for the determination of Fe3+ with the difference being the addition of H2O2 to the sample as an oxidation agent. This is intended to be used as a fluorescence sensor for the determination of Fe2+ and Fe3+ ions. In addition, the optimum conditions including Fe2+, Fe3+ and H2O2 concentration and the pH of the solution were investigated.
2. Experimental
2.1 Chemicals
All chemicals are of analytical grade. Citric acid, sodium acetate, sodium chloride, iron(II) sulfide, iron(III) chloride hexahydrate and paraffin oil were purchased from QRec™ (New Zealand). Sodium hydroxide, silver chloride, magnesium chloride, manganese(II) sulfate monohydrate, nickel(II) chloride and aluminium chloride were purchased from Carlo Erba (Italy). L-Glutathione (reduced form), mercury nitrate, cobalt nitrate hexahydrate, lead nitrate, zinc nitrate hexahydrate, cadmium nitrate tetrahydrate, copper nitrate trihydrate, and ethylenediaminetetraacetic acid (EDTA) were purchased from Sigma-Aldrich (Germany). Acetic acid was purchased from Merck (Germany). Hydrogen peroxide was purchased from Ajax Finechem (Australia). A Millipore water purification system (Molsheim, France) was used to obtain deionized water with a resistivity of 18.2 MΩ cm.2.2 Instruments
Spectrofluorometer Model RF-5301PC (Shimadzu, Japan) was mainly used. UV-visible spectrophotometer Model Agilent 8453 was from Agilent (Germany). pH meter UB-10 UltraBasic (Denver, USA) was used for the solution pH buffering system. Attenuated total reflectance-Fourier transform infrared (ATR-FTIR) spectroscopic measurement was performed on a TENSOR 27 system Fourier transform infrared spectrometer (Bruker, Germany). EDX spectra were taken by a HITACHI S-3000N scanning electron microscope (SEM, Hitachi Co. Ltd., Japan).2.3 Preparation and characterization of graphene quantum dots (GQDs) from lime oil extract
GQDs from citrus oil extract were prepared by pyrolysis. In this typical procedure, 130 mL of lime juice was evaporated to obtain lime oil extract. Then 2.0 g of the oil extract was added into a 5 mL beaker. The beaker was heated to 260 °C using a paraffin oil bath for about 5 min. The liquid was then transferred into a beaker containing 100 mL of 0.25 mol L−1 NaOH with continuous stirring for 30 min. The obtained sample solution was neutralized to pH 7.0 with NaOH, and the GQD stock solution was stored at 4 °C before use.2.4 Preparation of graphene quantum dots functionalized with glutathione (GSH-GQDs)
GSH-GQDs were also prepared by pyrolysis. Briefly, 2.0 g of lime oil extract and 1% (w/w) glutathione were added into a 5 mL beaker. The beaker was heated to 260 °C using a paraffin oil bath for about 5 min. The lime oil extract and glutathione mixture was slowly liquated and turned a brown colour. The liquid was transferred into a beaker containing 100 mL of 0.25 mol L−1 NaOH with continuous stirring for 30 min. The GSH-GQD stock solution was stored at 4 °C before use.2.5 Fluorescence measurement
The fluorescence measurement of GSH-GQDs was performed in acetate buffer solution at pH 4. For the determination of Fe3+, 500 μL of GSH-GQD solution and 1 mL of 1.0 M acetate buffer at pH 4 were mixed in a 10 mL volumetric flask. Then, various concentrations of Fe3+ were added to an aliquot of the GSH-GQD solution (10 mL final volume) at room temperature. The Fe3+ species that quenched the fluorescence intensity of each GSH-GQD solution were recorded immediately at 430 nm when excited at 345 nm. Then, the spectral measurements were used to plot the quenching calibration curve for Fe3+. The detection of Fe2+ species was also done by a similar procedure to that mentioned for the determination of Fe3+ with the difference being the addition of H2O2 as an oxidizing agent to the sample solution.2.6 Optimization of the proposed fluorescence sensor
To obtain the optimized conditions of the proposed fluorescence sensor, the main experimental parameters affecting the fluorescence intensity of the GSH-GQDs were investigated in detail as follows.3. Results and discussion
3.1 Characterization of the as-synthesized GQDs and GSH-GQDs
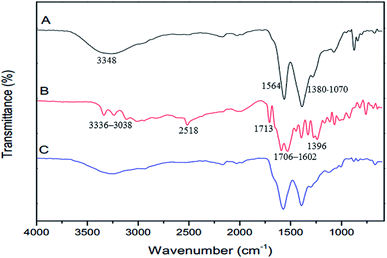
The FTIR spectra of GQDs, GSH, and GSH-GQDs are shown in Fig. 1. The as-prepared GQDs (Fig. 1A) show peaks at 1564 cm−1, which indicates the presence of the C![[double bond, length as m-dash]](https://www.rsc.org/images/entities/char_e001.gif) C stretching mode of polycyclic aromatic hydrocarbons.75 A broad peak at 3348 cm−1 is the characteristic peak of the hydroxyl group (–OH) from water molecules and carboxylic groups. The 1380–1070 cm−1 are attributed to the C–O in COH/COC (epoxy) groups.76 These results confirm the GQDs were successfully synthesized by lime oil extract pyrolysis. The FTIR spectrum of GSH is shown in Fig. 1B. Characteristic GSH broad absorption bands around 1706–1602 cm−1 (symmetric COO−), 1396 cm−1 (asymmetric COO−) and 1713 cm−1 (C
C stretching mode of polycyclic aromatic hydrocarbons.75 A broad peak at 3348 cm−1 is the characteristic peak of the hydroxyl group (–OH) from water molecules and carboxylic groups. The 1380–1070 cm−1 are attributed to the C–O in COH/COC (epoxy) groups.76 These results confirm the GQDs were successfully synthesized by lime oil extract pyrolysis. The FTIR spectrum of GSH is shown in Fig. 1B. Characteristic GSH broad absorption bands around 1706–1602 cm−1 (symmetric COO−), 1396 cm−1 (asymmetric COO−) and 1713 cm−1 (C![[double bond, length as m-dash]](https://www.rsc.org/images/entities/char_e001.gif) O) are observed indicating a –COOH group is present. Peaks around 3336–3038 cm−1 indicate symmetric N–H stretching and 2518 cm−1 indicate –SH (S–H) groups,77 respectively. In the FTIR spectra of GQDs functionalized with GSH (Fig. 1C), the disappearance of the S–H group vibration at 2518 cm−1 (S–H) is clear and is likely a consequence of a covalent bond established between the GQDs and GSH. These spectra confirmed the presence of GSH doped in the GQDs.
O) are observed indicating a –COOH group is present. Peaks around 3336–3038 cm−1 indicate symmetric N–H stretching and 2518 cm−1 indicate –SH (S–H) groups,77 respectively. In the FTIR spectra of GQDs functionalized with GSH (Fig. 1C), the disappearance of the S–H group vibration at 2518 cm−1 (S–H) is clear and is likely a consequence of a covalent bond established between the GQDs and GSH. These spectra confirmed the presence of GSH doped in the GQDs.
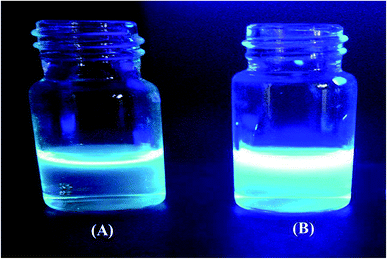
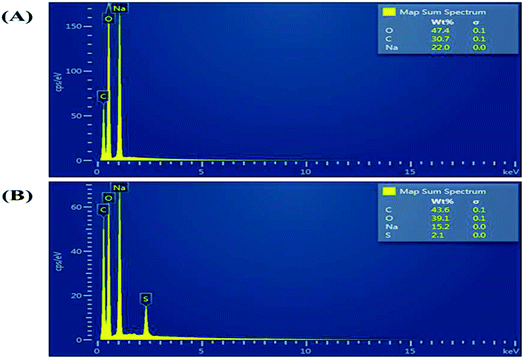
Fig. 2 shows a photograph of the solution of GQDs Fig. 2(A) and GSH-GQDs Fig. 2(B) taken under UV light. The GSH-GQD solution shows brighter blue emission than the GQDs under UV light. It was also confirmed by EDX spectra (Fig. 3A and B) that the GSH doped GQDs, compared with bare GQDs, were obtained by the appearance of S at 2.31 keV (Fig. 3B) which was commonly found in association with C (0.277 keV) and O (0.525 keV), but not N (0.392 keV) which would be a weak signal and overlapped in between the C and O peaks. The presence of the Na peak in both EDX spectra came from the NaOH solution used.
3.2 The fluorescence turn-off sensor for ferric ions with GSH-GQDs
The overall assay strategy for the sensing of Fe3+ is shown in Scheme 1. GSH doped GQDs were obtained through the pyrolysis of lime oil extract in the presence of GSH at 260 °C for 5 min, in which the GSH was used as an additional sulfur and nitrogen source, while the lime oil extract was used as the natural carbon source. The absorption and emission fluorescence spectra of GSH-GQDs show peaks at 345 and 430 nm, respectively. The GSH-GQDs show excellent fluorescence stability and low toxicity under the preparation conditions.More importantly, it was demonstrated that the GSH-GQDs were highly selective towards Fe3+, in which it is evident that the incorporation of S atoms into GQDs should be of crucial importance for tuning the electronic local density of the GQDs and promoting the coordination interaction between Fe3+ and the phenolic hydroxyl groups on the edge of S-GQDs. S (electronegativity of S: 2.58) is an electron donor, but fundamentally different from N (electronegativity of N: 3.04) because of its lower electronegativity and larger atomic radius. Therefore, the valence electrons of S in the third shell are easily lost, and the higher surface electron density of O atoms further promotes the coordination interaction.78 Therefore, we deduce that when Fe3+ ions are added into the S-GQDs solution, they can coordinate with the phenolic hydroxyl groups on the edge of S-GQDs, and the electrons in the excited state of S-GQDs will transfer to the half-filled 3d orbitals of Fe3+, facilitating non-radiative electron/hole recombination annihilation and leading to significant fluorescence quenching.79,80
3.3 Effect of the solution pH
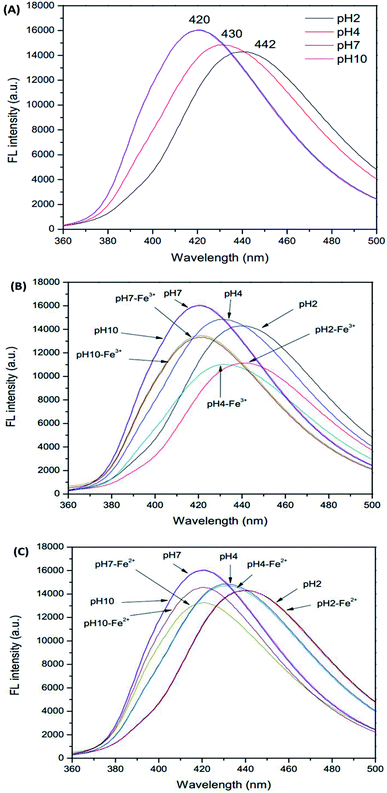
Initially, due to the presence of pH sensitive functional groups in the GSH-GQDs, we investigated the effect of pH on their fluorescence intensity. As demonstrated in Fig. 4A–C, we found that the pH of the solution is able to influence the fluorescence signal of the sensor before and after the addition of Fe3+ ions. The fluorescence intensity of the sensor is plotted versus pH in the range of 2–10 (Fig. 4A). It was observed that the emission intensity changed the maximum wavelength and decreased sharply when the pH value was below 7. It was evident that at various pH values the fluorescence intensity was quenched by Fe3+, but at around pH 4 it could not be quenched by Fe2+. Thus, towards this sensitive pH value an iron speciation analysis could be selectively conducted in association with simple oxidation of Fe2+ to Fe3+ using H2O2 as an oxidizing agent.In order to keep the fluorescence intensity of the GSH-GQDs as stable as possible and to ensure sensitive determination of Fe3+, a citrate buffer solution (pH 4, 1.0 M) was used.
3.4 Effect of H2O2 on speciation of Fe2+ and Fe3+
Our studies showed that Fe3+ ions immediately reduce the fluorescence intensity of GSH-GQDs. However, no such changes were observed when Fe3+ was replaced by Fe2+. According to the following reaction, H2O2 is capable of generating higher oxidation states of iron, which is referred to as the Fenton reaction.81| Fe2+ + H2O2 → Fe3+ + OH− + OH˙ |
Therefore, by means of the Fenton reaction, selective and sensitive determination of Fe2+ based on GSH-GQDs fluorescence quenching is feasible. The effect of H2O2 concentration was tested by evaluating the fluorescence intensity of the GSH-GQDs.
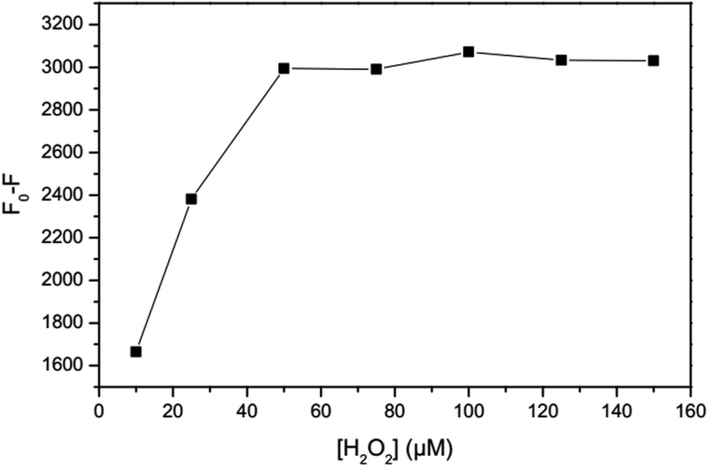
As shown in Fig. 5, the addition of H2O2 results in quenching of the fluorescence intensity proportional to the H2O2 concentration. The optimum concentration of hydrogen peroxide is when no obvious change in fluorescence intensity due to H2O2 is observed in the absence of Fe2+, while in the presence of Fe2+ oxidization of almost all of the Fe2+ ions occurs. Therefore, the effectiveness of different concentrations of H2O2 for oxidation of the highest concentration of Fe2+ in a linear range (100 μM) was investigated. According to the revealed results, the concentration of 50 μM was chosen for H2O2, taking the complete oxidation of Fe2+ ions and unnoticeable change of GSH-GQDs emission into account.
3.5 Effect of ionic strength and masking agent
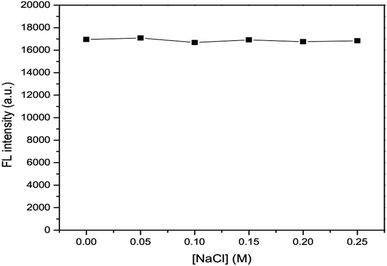
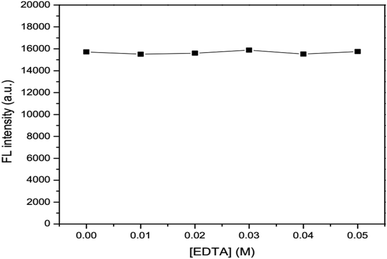
The effects of ionic strength as 0.05, 0.10, 0.15, 0.20 and 0.25 M NaCl solutions (Fig. 6) and masking agent as 0.01, 0.02, 0.03, 0.04 and 0.05 EDTA solutions (Fig. 7) tested were also investigated. It was found that both ionic strength and masking agent had no effect on the fluorescence intensity of the GSH-GQD solution. A further aim is that modification of the ionic strength of the mixture solution could be done in association with the addition of EDTA to mask any metal ion interferences in the sample.3.6 Selectivity of the proposed sensor
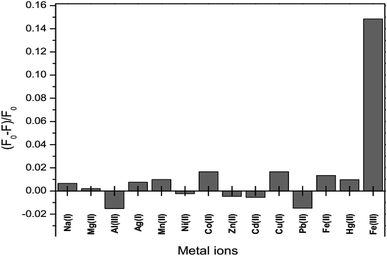
The fluorescence intensity of GSH-GQDs in the presence of various metal ions, Na+, Ag+, Mg2+, Mn2+, Ni2+, Co2+, Zn2+, Cd2+, Cu2+, Pb2+ Fe2+, Hg2+, Al3+ and Fe3+, was investigated. The values of (F0 − F)/F0 were plotted using 0.1 mL of 10 μM of each metal. Fig. 8 shows that the addition of Fe3+ to the reaction mixture of the GSH-GQDs system resulted in fluorescence quenching, whereas the other remaining cations had no significant effect under the same experimental conditions.3.7 Method validation
The analytical characteristics of the proposed method were validated under optimized conditions in terms of linearity, limit of detection (LOD), limit of quantification (LOQ), and precision (expressed as the relative standard deviation, RSD, of the calibration slope obtained from both intra-day and inter-day analysis) to estimate the efficiency and feasibility of the method for use with drinking water samples. The linearity range is from 1–150 μM (R2 = 0.9984). The linear calibration graph is as follows: y = 34.934x + 169.61 (where y is the fluorescence intensity and x is the concentration of Fe3+) (Fig. 9). The LOD defined as 3SD/m (where SD is the standard deviation of a very low concentration of Fe3+ and m is the slope of the calibration graph) was 0.10 μM. The LOQ defined as 10SD/m, was 0.34 μM. The precision, which was evaluated in terms of repeatability (data from 3 × 3 independent standard preparation, intra-day RSD), was 2.03% and 3.17% and the reproducibility (work performed during 5 × 3 consecutive days, inter-day RSD) was 3.11% and 4.55% for Fe2+ and Fe3+, respectively, indicating acceptable repeatability of the method.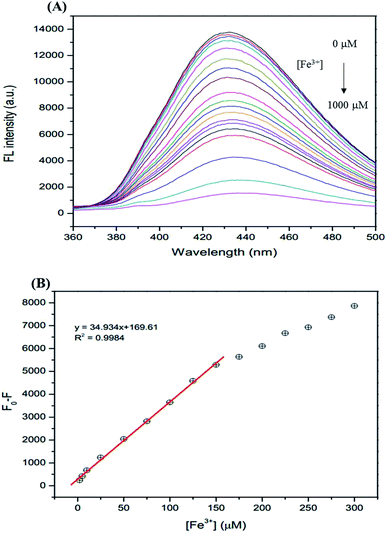 | ||
| Fig. 9 (A) The changes in the FL intensity of the GSH-GQDs at different Fe3+ concentrations (0–1000 μM), (B) linear relationship of F0 − F versus the concentration of Fe3+ over the range 1–150 μM. | ||
3.8 Real sample analysis
Iron speciation, Fe2+ and Fe3+, in some brands of bottled drinking water samples was studied. To demonstrate the applicability and reliability of the proposed method, it was successfully applied to fifteen samples of drinking water including five brands of water (brands 1–5). The amounts of Fe2+ and Fe3+ in these samples were obtained as shown in Table 1. The results showed that both Fe2+ and Fe3+ were found in all samples studied. In addition, to evaluate the matrix effect the accuracy of the method was verified by calculating the recovery in the real samples. Each sample was spiked with five concentrations (0, 25, 50, 75 and 100 μM) of a standard solution of both Fe2+ and Fe3+. Then, the relative percentage recoveries were calculated as follows:| % Recovery = [(Cfound − Creal)/Cadded] × 100 |
| Drinking water sample | Fe2+ | Fe3+ | ||||
|---|---|---|---|---|---|---|
| Added (μM) | Found (μM) | Recovery (%) ± SD | Added (μM) | Found (μM) | Recovery (%) ± SD | |
| Brand 1 | 0 | 0.11 | — | 0 | 0.22 | — |
| 25 | 25.72 | 102.86 ± 4.15 | 25 | 25.22 | 100.90 ± 1.85 | |
| 50 | 51.15 | 102.30 ± 1.08 | 50 | 49.04 | 98.08 ± 2.67 | |
| 75 | 75.95 | 101.27 ± 3.13 | 75 | 75.17 | 100.23 ± 2.54 | |
| 100 | 103.24 | 103.24 ± 4.44 | 100 | 98.55 | 98.55 ± 4.34 | |
| Brand 2 | 0 | 0.28 | — | 0 | 0.34 | — |
| 25 | 25.51 | 102.05 ± 3.73 | 25 | 25.28 | 101.13 ± 1.89 | |
| 50 | 51.04 | 102.07 ± 2.58 | 50 | 49.99 | 99.99 ± 3.73 | |
| 75 | 78.06 | 104.09 ± 2.24 | 75 | 74.45 | 99.26 ± 5.20 | |
| 100 | 103.01 | 103.01 ± 4.11 | 100 | 98.20 | 98.20 ± 2.97 | |
| Brand 3 | 0 | 0.40 | — | 0 | 0.37 | — |
| 25 | 25.17 | 100.66 ± 2.99 | 25 | 25.05 | 100.20 ± 2.69 | |
| 50 | 51.88 | 103.75 ± 4.34 | 50 | 49.39 | 98.77 ± 2.49 | |
| 75 | 77.69 | 103.58 ± 2.61 | 75 | 74.77 | 99.69 ± 3.15 | |
| 100 | 101.13 | 101.13 ± 3.92 | 100 | 100.06 | 100.06 ± 2.56 | |
| Brand 4 | 0 | 0.25 | — | 0 | 0.42 | — |
| 25 | 25.02 | 100.09 ± 3.44 | 25 | 25.57 | 102.29 ± 4.22 | |
| 50 | 50.78 | 101.55 ± 4.22 | 50 | 51.33 | 102.65 ± 2.09 | |
| 75 | 76.62 | 102.16 ± 3.17 | 75 | 74.30 | 99.07 ± 5.11 | |
| 100 | 102.55 | 102.55 ± 1.97 | 100 | 99.13 | 99.13 ± 3.42 | |
| Brand 5 | 0 | 0.16 | — | 0 | 0.31 | — |
| 25 | 25.08 | 100.32 ± 3.59 | 25 | 25.31 | 101.24 ± 3.12 | |
| 50 | 51.24 | 102.48 ± 2.99 | 50 | 50.83 | 101.67 ± 2.41 | |
| 75 | 77.28 | 103.04 ± 3.18 | 75 | 75.69 | 100.92 ± 2.38 | |
| 100 | 102.31 | 102.31 ± 3.75 | 100 | 99.51 | 99.51 ± 1.86 | |
| Carbon based material | Linear range | LOD | Reference |
|---|---|---|---|
| Carbon dots (CDs) conjugated with phenol groups | 1–100 mM | 0.17 mM | 82 |
| Gold nanoparticles (AuNPs) conjugated with glycol chitosan | 0–180 μM | 11.3 nM | 83 |
| Boron-doped graphene quantum dots (B-GQDs) | 0.01–100 μM | 0.005 μM | 84 |
| Sulfur-doped graphene quantum dots (S-GQDs) | 0–0.70 μM | 4.2 nM | 85 |
| Nitrogen-doped carbon dots (N-CDs) | 0–1.6 μM | 0.05 μM | 86 |
| N/P co-doped carbon dots | 1–150 μM | 0.33 μM | 87 |
| GSH-doped GQDs (lime oil extract) | 1–150 μM | 0.10 μM | This work |
4. Conclusion
A highly sensitive fluorescence sensor for speciation of Fe2+ and Fe3+ ions based on the fluorescence quenching of GSH-GQDs was obtained. A novel approach for the preparation of GQDs by pyrolysis of citric acid rich-lime oil extract was demonstrated for selective determination of Fe2+ and Fe3+ at trace level under optimum conditions, mainly including ensuring the solution was pH 4.0 in the presence of H2O2. The analytical features of merit of the proposed method were well validated, and could be applied to determine both Fe2+ and Fe3+ in five brands of bottled drinking water samples, in particular having high recovery. Using the as-prepared GQDs doped with a small amount of GSH as a simple and cheap fluorescence sensor with natural lime oil extract as a starting material meets the requirements of green chemistry. In addition, using multi-functional materials such as a S- and N-doped GQD based spectroscopic sensor and/or other reactive cation or anion-doped carbon based materials with their intrinsic quantum yields could have potential in approaching green chemistry for future trends in nanoparticle applications.88–90Conflicts of interest
The authors have declared no conflict of interest.Acknowledgements
The authors thank the Higher Education Research Promotion and National Research University Project of Thailand, Office of the Higher Education Commission, through the Food and Functional Food Research Cluster of Khon Kaen University, Materials Chemistry Research Center, Department of Chemistry and Center of Excellence for Innovation in Chemistry (PERCH-CIC), Thailand for financial support.References
- M. W. Hentze, M. U. Muckenthaler, B. Galy and C. Camaschella, Cell, 2010, 142, 24–38 CrossRef CAS PubMed.
- T. A. Rouault, Nat. Chem. Biol., 2006, 2, 406–414 CrossRef CAS PubMed.
- B. D’Autreaux, N. P. Tucker, R. Dixon and S. Spiro, Nature, 2005, 437, 769–772 CrossRef PubMed.
- J. S. Wu, W. M. Liu, J. C. Ge, H. Y. Zhang and P. F. Wang, Chem. Soc. Rev., 2011, 40, 3483–3495 RSC.
- R. S. Eisenstein, Annu. Rev. Nutr., 2000, 20, 627–662 CrossRef CAS PubMed.
- M. Balcerzak and A. Tyburska, Acta Pharm., 2008, 58, 327–334 CrossRef CAS PubMed.
- S. X. Wang, X. M. Meng and M. Z. Zhu, Tetrahedron Lett., 2011, 52, 2840–2843 CrossRef CAS.
- C. Brugnara, Clin. Chem., 2003, 49, 1573–1578 CAS.
- N. Narayanaswamy and T. Govindaraju, Sens. Actuators, B, 2012, 161, 304–310 CrossRef CAS.
- World Health Organization, Water safety plans, in WHO Guidelines for Drinking Water Quality, WHO, Geneva, 4th edn, 2011, p. 226, http://whqlibdoc.who.int/publications/2011/9789241548151_eng.pdf Search PubMed.
- Y. Chen, Y. Huang, S. Feng and D. Yuan, Anal. Methods, 2015, 7, 4971–4978 RSC.
- Y. H. He, J. P. Lai, H. Sun, Z. M. Chen and S. Lan, Sens. Actuators, B, 2016, 225, 405–412 CrossRef CAS.
- L. K. Mudashiru, A. C. Aplin and B. R. Horrocks, Anal. Methods, 2011, 3, 927–936 RSC.
- P. Bermejo, E. Peña, R. Domínguez, A. Bermejo, J. M. Fraga and J. A. Cocho, Talanta, 2000, 50, 1211–1222 CrossRef CAS PubMed.
- J. Xu, P. Che and Y. F. Ma, J. Chromatogr. A, 1996, 749, 287–294 CrossRef CAS PubMed.
- X. P. Yan, M. J. Hendry and R. Kerrich, Anal. Chem., 2000, 72, 1879–1884 CrossRef CAS PubMed.
- A. Saavedra, E. Donati and E. Cortón, Sens. Actuators, B, 2015, 220, 448–455 CrossRef CAS.
- S. Hirata, H. Yoshihara and M. Aihara, Talanta, 1999, 49, 1059–1067 CrossRef CAS PubMed.
- M. Karimil, A. Badieil and G. M. Ziarani, J. Fluoresc., 2015, 25, 1297–1302 CrossRef PubMed.
- R. Kagit, M. Yildirim, O. Ozay, S. Yesilot and H. Ozay, Inorg. Chem., 2014, 53, 2144–2151 CrossRef CAS PubMed.
- B.-Y. Chen, C.-C. Kuo, Y.-S. Huang, S.-T. Lu, F.-C. Liang and D.-H. Jiang, ACS Appl. Mater. Interfaces, 2015, 7, 2797–2808 CAS.
- L. Tang, R. Ji, X. Cao, J. Lin, H. Jiang, X. Li, K. S. Teng, C. M. Luk, S. Zeng, J. Hao and S. P. Lau, ACS Nano, 2012, 6, 5102–5110 CrossRef CAS PubMed.
- S. Zhuo, M. Shao and S.-T. Lee, ACS Nano, 2012, 6, 1059–1064 CrossRef CAS PubMed.
- S. Zhu, J. Zhang, S. Tang, C. Qiao, L. Wang, H. Wang, X. Liu, B. Li, Y. Li, W. Yu, X. Wang, H. Sun and B. Yang, Adv. Funct. Mater., 2012, 22, 4732–4740 CrossRef CAS.
- J. Shen, Y. Zhu, C. Chen, X. Yang and C. Li, Chem. Commun., 2011, 47, 2580–2582 RSC.
- D. Pan, J. Zhang, Z. Li and M. Wu, Adv. Mater., 2010, 22, 734–738 CrossRef CAS PubMed.
- M. Zhang, L. Bai, W. Shang, W. Xie, H. Ma, Y. Fu, D. Fang, H. Sun, L. Fan, M. Han, C. Liu and S. J. Yang, Mater. Chem., 2012, 22, 7461–7467 RSC.
- Y. Wu, M. Wen, M. Navlani-García, Y. Kuwahara, K. Mori and H. Yamashita, Chem.–Asian J., 2017, 12, 860–867 CrossRef CAS PubMed.
- S. H. Choi, D. H. Kim, A. V. Raghu, K. R. Reddy, H.-I. Lee, K. S. Yoon, H. M. Jeong and B. K. Kim, J. Macromol. Sci., Part B: Phys., 2012, 51, 197–207 CrossRef CAS.
- M. U. Khan, K. R. Reddy, T. Snguanwongchai, E. Haque and V. G. Gomes, Colloid Polym. Sci., 2016, 294, 1599–1610 CAS.
- B. D. Pan, J. Zhang, Z. Li and M. Wu, Adv. Mater., 2010, 22, 734–738 CrossRef PubMed.
- K. R. Reddy, K.-P. Lee, A. I. Gopalan, M. S. Kim, A. M. Showkat and Y. C. Nho, J. Polym. Sci., Part A: Polym. Chem., 2006, 44, 3355–3364 CrossRef CAS.
- K. R. Reddy, V. G. Gomes and M. Hassan, Mater. Res. Express, 2014, 1, 015012 CrossRef.
- K. R. Reddy, B. C. Sin, C. H. Yoo, W. Park, K. S. Ryu, J.-S. Lee, D. Sohn and Y. Lee, Scr. Mater., 2008, 58, 1010–1013 CrossRef CAS.
- K. R. Reddy, B. C. Sin, K. S. Ryu, J. Noh and Y. Lee, Synth. Met., 2009, 159, 1934–1939 CrossRef CAS.
- H. Cheng, Y. Zhao, Y. Fan, X. Xie, L. Qu and G. Shi, ACS Nano, 2012, 6, 2237–2244 CrossRef CAS PubMed.
- J. Shen, Y. Zhu, X. Yang and C. Li, Chem. Commun., 2012, 48, 3686–3699 RSC.
- H. Tetsuka, R. Asahi, A. Nagoya, K. Okamoto, I. Tajima, R. Ohta and A. Okamoto, Adv. Mater., 2012, 24, 5333–5338 CrossRef CAS PubMed.
- D. R. Son, A. V. Raghu, K. R. Reddy and H. M. Jeong, J. Macromol. Sci., Part B: Phys., 2016, 55, 1099–1110 CrossRef CAS.
- P. Luo, Z. Ji, C. Li and G. Shi, Chem. Commun., 2013, 46, 5094–5096 Search PubMed.
- J. Shen, Y. Zhu, C. Chen, X. Yang and C. Li, Chem. Commun., 2011, 47, 2580–2582 RSC.
- J. Shen, Y. Zhu, X. Yang, J. Zong, J. Zhang and C. Li, New J. Chem., 2012, 36, 97–101 RSC.
- Y.-L. Zhang, L. Wang, H.-C. Zhang, Y. Liu, H.-Y. Wang, Z.-H. Kang and S.-T. Lee, RSC Adv., 2013, 3, 3733–3738 RSC.
- K. R. Reddy, M. Hassan and V. G. Gomes, Appl. Catal., A, 2015, 489, 1–16 CrossRef CAS.
- Y. R. Lee, S. C. Kim, H.-i. Lee, H. M. Jeong, A. V. Raghu, K. R. Reddy and B. K. Kim, Macromol. Res., 2011, 19, 66–71 CrossRef CAS.
- M. Cakici, R. R. Kakarla and F. Alonso-Marroquin, Chem. Eng. J., 2017, 309, 151–158 CrossRef CAS.
- F. Wang, Z. Gu, W. Lei, W. Wang, X. Xia and Q. Hao, Sens. Actuators, B, 2014, 190, 516–522 CrossRef CAS.
- Y.-X. Qi, M. Zhang, Q.-Q. Fu, R. Liu and G.-Y. Shi, Chem. Commun., 2013, 49, 10599–10601 RSC.
- L. Fan, Y. Hu, X. Wang, L. Zhang, F. Li, D. Han, Z. Li, Q. Zhang, Z. Wang and L. Niu, Talanta, 2012, 101, 192–197 CrossRef CAS PubMed.
- Y. Zhou, Z.-B. Qu, Y. Zeng, T. Zhou and G. Shi, Biosens. Bioelectron., 2014, 52, 317–323 CrossRef CAS PubMed.
- F. Yang, M. Zhao, B. Zheng, D. Xiao, L. Wu and Y. Guo, J. Mater. Chem., 2012, 22, 25471–25479 RSC.
- H. Zhao, Y. Chang, M. Liu, S. Gao, H. Yu and X. Quan, Chem. Commun., 2013, 49, 234–236 RSC.
- Y. Wang, L. Zhang, R.-P. Liang, J.-M. Bai and J.-D. Qiu, Anal. Chem., 2013, 85, 9148–9155 CrossRef CAS PubMed.
- D. Pan, J. Zhang, Z. Li and M. Wu, Adv. Mater., 2010, 22, 734–738 CrossRef CAS PubMed.
- S. Zhu, J. Zhang, C. Qiao, S. Tang, Y. Li, W. Yuan, B. Li, L. Tian, F. Liu, R. Hu, H. Gao, H. Wei, H. Zhang, H. Sun and B. Yang, Chem. Commun., 2011, 47, 6858–6860 RSC.
- L. Lin and S. Zhang, Chem. Commun., 2012, 48, 10177–10179 RSC.
- Y. Li, Y. Zhao, H. Cheng, Y. Hu, G. Shi, L. Dai and L. Qu, J. Am. Chem. Soc., 2012, 134, 15–18 CrossRef CAS PubMed.
- C. Hu, Y. Liu, Y. Yang, J. Cui, Z. Huang, Y. Wang, L. Yang, H. Wang, Y. Xiao and J. Rong, J. Mater. Chem. B, 2013, 1, 39–42 RSC.
- Q. Liu, B. Guo, Z. Rao, B. Zhang and J. R. Gong, Nano Lett., 2013, 13, 2436–2441 CrossRef CAS PubMed.
- Z. Fan, Y. Li, X. Li, L. Fan, S. Zhou, D. Fang and S. Yang, Carbon, 2014, 70, 149–156 CrossRef CAS.
- D. Qu, M. Zheng, P. Du, Y. Zhou, L. Zhang, D. Li, H. Tan, Z. Zhao, Z. Xie and Z. Sun, Nanoscale, 2013, 5, 12272–12277 RSC.
- S. Li, Y. Li, J. Cao, J. Zhu, L. Fan and X. Li, Anal. Chem., 2014, 86, 10201–10207 CrossRef CAS PubMed.
- D. Pan, J. Zhang, Z. Li and M. Wu, Adv. Mater., 2010, 22, 734–737 CrossRef CAS PubMed.
- R. Liu, D. Wu, X. Feng and K. Muellen, J. Am. Chem. Soc., 2011, 133, 15221–15223 CrossRef CAS PubMed.
- J. Peng, W. Gao, B. K. Gupta, Z. Liu, R. A. Romeroburto, L. Ge, L. Song, L. B. Alemany, X. Zhan, G. Gao, S. A. Vithayathil, B. A. Kaipparettu, A. A. Marti, T. Hayashi, J. J. Zhu and P. M. Ajayan, Nano Lett., 2012, 12, 844–849 CrossRef CAS PubMed.
- Y. Dong, J. Lin, Y. Chen, F. Fu, Y. Chi and G. Chen, Nanoscale, 2014, 6, 7410–7415 RSC.
- Y. Dong, J. Shao, C. Chen, H. Li, R. Wang, Y. Chi, X. Lin and G. Chen, Carbon, 2012, 50, 4738–4743 CrossRef CAS.
- Z. Wang, J. Yu, X. Zhang, N. Li, B. Liu, Y. Li, Y. Wang, W. Wang, Y. Li, L. Zhang, S. Dissanayake, S. L. Suib and L. Sun, ACS Appl. Mater. Interfaces, 2016, 8, 1434–1439 CAS.
- S. Mahesh, C. L. Lekshmi, K. D. Renuka and K. Joseph, Part. Part. Syst. Charact., 2016, 30, 70–74 CrossRef.
- L. B. Tang, R. B. Ji, X. M. Li, G. X. Bai, C. P. Liu, J. H. Hao, J. Y. Lin, H. X. Jiang, K. S. Teng, Z. B. Yang and S. P. Lau, ACS Nano, 2014, 8, 6312–6320 CrossRef CAS PubMed.
- C. Z. Zhu, J. F. Zhai and S. J. Dong, Chem. Commun., 2012, 48, 9367–9369 RSC.
- S. Sahu, B. Behera, T. K. Maiti and S. Mohapatra, Chem. Commun., 2012, 48, 8835–8837 RSC.
- L. Wang, W. Li, B. Wu, Z. Li, S. Wang, Y. Liu, D. Pan and M. Wu, Chem. Eng. J., 2016, 300, 75–82 CrossRef CAS.
- W. Zhang, Y. Liu, X. Meng, T. Ding, Y. Xu, H. Xu, Y. Ren, B. Liu, J. Huang, J. Yang and X. Fang, Phys. Chem. Chem. Phys., 2015, 17, 22361–22366 RSC.
- H. Wang, Q. Hao, X. Yang, L. Lu and X. Wang, Electrochem. Commun., 2009, 11, 1158–1161 CrossRef CAS.
- J. P. Monrás, V. Díaz, D. Bravo, R. A. Montes, T. G. Chasteen, I. O. Osorio-Román, C. C. Vásquez and J. M. Pérez-Donoso, PLoS One, 2012, 7, 48657 Search PubMed.
- S. Li, Y. Li, J. Cao, J. Zhu, L. Fan and X. Li, Anal. Chem., 2014, 86, 10201–10207 CrossRef CAS PubMed.
- Q. Mei, C. Jiang, G. Guan, K. Zhang, B. Liu and R. Liu, Chem. Commun., 2012, 48, 7468–7470 RSC.
- Y.-S. Xia and C.-Q. Zhu, Talanta, 2008, 75, 215–221 CAS.
- R. Liu, H. Li, W. Kong, J. Liu, Y. Liu and C. Tong, Mater. Res. Bull., 2013, 48, 2529–2534 CrossRef CAS.
- H. J. H. Fenton and J. H. Ryffel, J. Chem. Soc., Trans., 1902, 81, 434 RSC.
- M. R. Hormozi-Nezhad and M. Taghipoura, Anal. Methods, 2016, 8, 4064–4068 RSC.
- K. Kim, Y.-S. Nam, Y. Lee and K.-B. Lee, J. Anal. Methods Chem., 2017, 2017, 1–11 CrossRef PubMed.
- L. Chen, C. Wu, P. D. Xiaowei, F. P. Wu and C. Cai, Talanta, 2017, 164, 100–109 CrossRef CAS PubMed.
- S. Li, Y. Li, J. Cao, J. Zhu, L. Fan and X. Li, Anal. Chem., 2014, 86(20), 10201–10207 CrossRef CAS PubMed.
- R. Wang, X. Wang and Y. Sun, Sens. Actuators, B, 2017, 241, 73–79 CrossRef CAS.
- J. Shangguan, J. Huang, D. He, X. He, K. Wang, R. Ye, X. Yang, T. Qing and J. Tang, Anal. Chem., 2017, 89, 7477–7484 CrossRef CAS PubMed.
- M. Hassan, E. Haque, K. R. Reddy, A. I. Minett, J. Chen and V. G. Gomes, Nanoscale, 2014, 6, 11988–11994 RSC.
- K. R. Reddy, H. M. Jeong, Y. Lee and A. V. Raghu, J. Polym. Sci., Part A: Polym. Chem., 2010, 48, 1477–1484 CrossRef CAS.
- K. R. Reddy, K.-P. Lee, J. Y. Kim and Y. Lee, J. Nanosci. Nanotechnol., 2008, 8, 5632–5639 CrossRef CAS PubMed.
| This journal is © The Royal Society of Chemistry 2018 |

