 Open Access Article
Creative Commons Attribution 3.0 Unported Licence
Pervaporation separation of ethyl acetate from aqueous solutions using ZSM-5 filled dual-layer poly(ether-block-amide)/polyethersulfone membrane
M. Vatani,
A. Raisi * and
G. Pazuki
Department of Chemical Engineering, Amirkabir University of Technology (Tehran Polytechnic), Hafez Ave, P. O. Box 15875-4413, Tehran, Iran. E-mail: raisia@aut.ac.ir; Fax: +98 21 66405847; Tel: +98 21 64543125
First published on 26th January 2018
Abstract
In the present study, dual-layer mixed matrix membranes (MMMs) were prepared by incorporating ZSM-5 zeolite into poly(ether-block-amide) (PEBA) as an active layer on the polyethersulfone (PES) membrane as a support layer for pervaporation separation of ethyl acetate (EAc) from EAc/water mixtures. The ZSM-5 zeolite nanoparticles were synthesized by the hydrothermal technique and characterized using XRD, XRF and FESEM analysis. The ATR-FTIR, SEM, DSC and contact angle tests were used to characterize the fabricated MMMs. The effect of ZSM-5 concentration on the performance of the membranes was investigated by the pervaporation experiments and the results showed that loading 10% wt% ZSM-5 into the PEBA matrix had the best separation performance. The effect of feed concentration (1–5 wt%) and operating temperature (30–50 °C) on the separation factor and permeation flux of the neat PEBA/PES and PEBA/PES membranes containing 10 wt% ZSM-5 were studied at laminar and turbulent feed flow regimes. Analysis of variance was used to investigate the interaction effect of EAc concentration and temperature on the performance of the prepared membranes. It was observed that both feed concentration and temperature had positive effects on the total permeation flux and separation factor. The ZSM-5/PEBA/PES membrane containing 10 wt% ZSM-5 showed a separation factor and total flux of 124.94 and 1882 g m−2 h−1 at laminar flow and 134.22 and 1985 g m−2 h−1 at turbulent flow, respectively for a feed concentration of 5 wt% and temperature of 50 °C.
Introduction
Pervaporation, as a membrane separation technology, is an efficient method for the separation of organic compounds from aqueous solutions in comparison to conventional processes like distillation due to energy-saving process, low production costs and high selectivity.1 Three types of materials including polymers, inorganic and composite materials have been used for fabrication of the pervaporation membranes.2 The hydrophobic polymers were used to enhance the efficiency of polymeric membranes toward the separation of organic compounds with low concentrations from aqueous solutions.3–5 However, the use of polymeric membranes due to the low chemical and thermal stability as well as intrinsic trade-off between permeability and selectivity is limited.6 The higher chemical and thermal stability were obtained by preparing inorganic membranes.7 However, the main drawback of inorganic membranes is the high brittleness and difficult fabrication of inorganic defect-free membranes in the large scale.8 Mixed matrix membranes (MMMs) have been prepared from the polymeric and inorganic materials to overcome the drawbacks of neat polymeric and inorganic membranes.9 The MMMs were prepared via different methods such as physical blending of the polymer and inorganic materials,10 sol–gel method,11 in situ polymerization12 and self-assembly method.13 Among them, the physical blending of polymer/inorganic materials and sol–gel methods were commonly used for fabrication of the pervaporation MMMs. However, in the development of the MMMs, there are several challenges such as inorganic particles agglomeration and sedimentation, interfacial voids, low adhesion, polymer chains rigidification and pore blockage which have significant effects on the separation performance of the pervaporation membranes.Various inorganic materials as filler including activated carbon,14 graphene oxide,15 carbon nanotubes,16 metal oxide nanoparticles,17 clay,18 mesoporous materials19 and zeolites20 have been used for the preparation of MMMs. Among them, zeolites with crystalline structures and well-defined pores in the range of nanometers due to their good adsorption properties as well as high mechanical and chemical stability have been widely employed for the preparation of pervaporation MMMs. Different zeolites such as NaA,21 NaY,22 NaX,23,24 ZIF-8 (ref. 25) and ZSM-5 (ref. 26–30) have been blended with polymers for the fabrication MMMs in the pervaporation process. Due to its high hydrophobicity, high surface area and uniform pore size distribution, ZSM-5 zeolite has been incorporated in the polymeric membranes to develop hydrophobic pervaporation MMMs toward the separation of organic compounds from aqueous solutions. For example, Zhang et al.26 prepared the ZSM-5/hydroxyl terminated polybutadiene (HTPB)-based polyurethaneurea (PU) MMM for the pervaporation separation of isopropyl acetate from its aqueous solutions. Kittur et al.28 fabricated the ZSM-5/PDMS MMMs for the pervaporation separation of isopropanol from water. Vane et al.29 also incorporated the ZSM-5 zeolite into the PDMS membranes for the separation of ethanol from ethanol/water mixtures. Gu et al.30 fabricated the single layer ZSM-5/poly(ether-block-amide) (PEBA) membrane for the separation of ethyl acetate (EAc) from aqueous solutions.
Multi-layer mixed matrix membranes are another type of the membranes that have been used in the pervaporation process in recent years. The multi-layer mixed matrix membranes consist of a thin dense top layer containing inorganic fillers on porous sub-layers as a mechanical support. In previous studies, we reported the performance of nano zeolite NaX/polyvinyl alcohol (PVA)/polyethersulfone (PES)31 and carbon nanotubes/PVA/PES/polyester32 multilayer mixed matrix membranes for dehydration of ethanol/water mixture via the pervaporation process. However, there are few studies about pervaporation separation of organic compounds from aqueous solutions using multi-layer pervaporation MMMs.
Due to its low cost and low toxicity, EAc is widely used as a solvent in the chemical industry and as a raw material for the production of plasticizers, adhesive agents, drugs, perfumes, thinners, synthetic resins and varnishes.33,34 EAc is mainly synthesized via the esterification of acetic acid with ethanol.35 The product of the esterification process consists of water. Therefore, the EAc produced from the esterification process has a low concentration and needs to be concentrated and purified for use in various applications. In this area, the pervaporation, as an energy saving membrane process, has a high potential for the recovery of EAc from the aqueous solutions.36 In this work, the ZSM-5/PEBA/PES dual-layer MMMs were prepared by casting ZSM-5/PEBA/n-butanol solution over the porous PES membrane as a support layer. The ZSM-5 zeolite nanoparticles were synthesized via the hydrothermal method and characterized using XRD, XRF and FESEM analysis. The ATR-FTIR, SEM, DSC and contact angle analysis were used to characterize the prepared membranes. The effect of ZSM-5 content on the performance of prepared MMMs toward the recovery of EAc from aqueous solutions was investigated. Also, the effect of feed concentration and operating temperature on the separation factor and permeation flux of the dual-layer MMMs in the laminar and turbulent flow regimes was studied. A full factorial design was used to develop the polynomial models for the separation factor and total flux as a function of EAc concentration and temperature. The main innovative aspect of this study is the use of nanofillers to prepare dual-layer mixed matrix membranes for the pervaporation separation of the EAc from the aqueous solutions. Another important contribution is the investigation of the effect of feed concentration, temperature and flow rate on the separation performance of the prepared mixed matrix membranes with the analysis of variance (ANOVA).
Experimental
Materials
The commercial Pebax® 2533 (80 wt% poly(tetramethylene oxide) and 20 wt% polyamide) and PES (molecular weight of 58![[thin space (1/6-em)]](https://www.rsc.org/images/entities/char_2009.gif) 000 g mol−1, Ultrason E6020P) provided from Arkema Inc. (Paris, France) and BASF (Ludwigshafen, Germany) were used as the membrane materials, respectively. N,N-Dimethyl formamide (DMF) and n-butanol purchased from Merck Co. Ltd. (Darmstadt, Germany) were used as solvents for PES and PEBA, respectively. Tetrapropylammonium hydroxide (TPAOH), sodium hydroxide (NAOH), aluminum isopropoxide supplied from Merck Co. Ltd. and tetraethyl orthosilicate (TEOS) supplied from Sigma Inc. (Sigma Aldrich, MO, USA) were used for synthesis of the ZSM-5 zeolite. Ethyl acetate was purchased from Merck Co. Ltd. and de-ionized water was mixed as the pervaporation feed.
000 g mol−1, Ultrason E6020P) provided from Arkema Inc. (Paris, France) and BASF (Ludwigshafen, Germany) were used as the membrane materials, respectively. N,N-Dimethyl formamide (DMF) and n-butanol purchased from Merck Co. Ltd. (Darmstadt, Germany) were used as solvents for PES and PEBA, respectively. Tetrapropylammonium hydroxide (TPAOH), sodium hydroxide (NAOH), aluminum isopropoxide supplied from Merck Co. Ltd. and tetraethyl orthosilicate (TEOS) supplied from Sigma Inc. (Sigma Aldrich, MO, USA) were used for synthesis of the ZSM-5 zeolite. Ethyl acetate was purchased from Merck Co. Ltd. and de-ionized water was mixed as the pervaporation feed.
Synthesis of ZSM-5 zeolite
ZSM-5 zeolite nanoparticles were synthesized from gel composition containing TPAOH, TEOS and water as solution A and aluminum isopropoxide, NAOH, TPAOH and water as solution B by the following procedure. 4.22 g TPAOH and 8 g TEOS was initially dissolved in 20 g de-ionized water under stirring for 2 h (solution A). Solution B was prepared by dissolving 1.8 g TPAOH, 0.48 g NAOH and 0.3 aluminum isopropoxide in 20 g de-ionized water. Solution A and solution B were then mixed together under stirring for a further 4 h to obtain a homogeneous gel. The prepared gel was then put to a Teflon lined steel autoclave at 200 °C for 2 days. Afterward, the synthesized zeolite was centrifuged and washed with deionized water three times. Then, the obtained solid product was dried at 110 °C for 12 h. Finally, the synthesized zeolite was calcined at 550 °C for 5 h.Fabrication of dual-layer mixed matrix membranes
The phase inversion technique was used to fabricate the ZSM-5 filled PEBA/PES dual-layer MMMs. The porous PES ultrafiltration membrane was prepared as a support layer using the non-solvent induced phase separation (NIPS) method as previously described.37–39 Briefly, the air bubble-free 16 wt% PES solution is prepared by dissolving the PES granules into the DMF under stirring for 24 h followed by de-aerating in a vacuum system for 1 h. The PES membranes were prepared by casting the PES solution on a glass plate followed by immersing into the de-ionized water batch at room temperature, storing into another de-ionized water bath for 24 h and drying at room temperature for another 24 h. The thickness of the prepared membranes was about 80 ± 5 μm.The neat PEBA and ZSM-5/PEBA membranes were prepared as a selective top layer on the surface of the PES sub-layer by the solvent evaporation induced phase separation method.40 Briefly, the PEBA homogenous solution was achieved by dissolving PEBA granules in n-butanol under stirring for 5 h at 70 °C. In addition, the suspensions of ZSM-5 zeolite were prepared by adding various amounts of ZSM-5 nanoparticles to n-butanol under stirring for 1 h and sonication for 30 min in an ultrasonic (UP200S (200 W, 24 kHz), Hielscher Ultrasonics GmbH, Germany). Then one sixth of the PEBA solution was added to the ZSM-5 suspension under stirring for 30 min followed by sonication in an ultrasonic for 15 min. This procedure was continued until all of the polymer solution was added to the zeolite suspension. Afterwards, the prepared bubble-free dope solution containing ZSM-5 was casted over the porous PES support membrane. Finally, the prepared films were dried at room temperature for 24 h, and then the residual solvent was evaporated by drying at 60 °C in an oven. The thickness of the top layer was about 20 ± 2 μm.
Fig. 1 shows the schematic of the procedure used for the preparation dope solution containing ZSM-5 nanoparticles and fabrication of the PES membrane and dual-layer ZSM-5/PEBA/PES membrane. The fabricated membranes were named as given in Table 1.
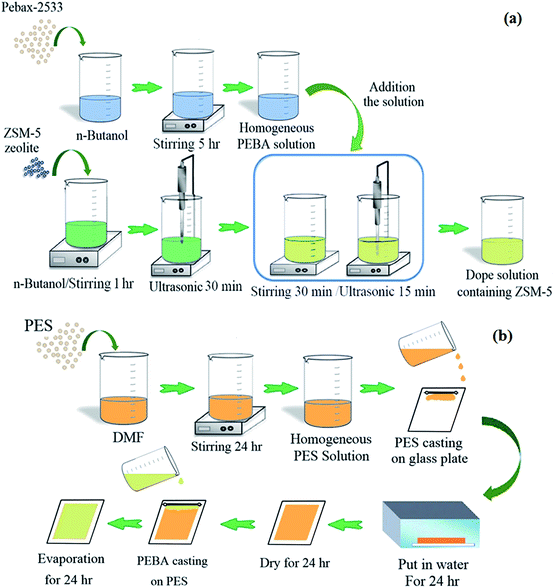 | ||
| Fig. 1 The schematic of procedure used for the preparation dope solution containing ZSM-5 nanoparticles (a) and fabrication of dual layer ZSM-5/PEBA/PES membrane (b). | ||
| Membrane sample | PEBA-2533 (wt%) | ZSM-5 (wt%) | n-Butanol (wt%) |
|---|---|---|---|
| M0 | 10 | 0.00 | 90.00 |
| M05.0 | 10 | 0.50 | 89.50 |
| M07.5 | 10 | 0.75 | 89.25 |
| M10.0 | 10 | 1.00 | 89.00 |
| M12.5 | 10 | 1.25 | 88.75 |
| M17.5 | 10 | 1.75 | 88.25 |
Characterization tests
Pervaporation experiments
To investigate the separation performance of the fabricated membrane, the pervaporation experiments were carried out using a cross flow flat plate and frame membrane module with an effective area of 35 cm2 for the separation of low concentrations of EAc from aqueous solutions. The membrane module had a feed channel with dimensions of 5 cm (width) × 7 cm (length) × 0.213 cm (height). The pervaporation apparatus was similar as described by Aroujalian and Raisi.41 Each experiment was repeated three times and the average values were reported. The performance of the prepared MMMs with different ZSM-5 zeolite concentrations (0, 5, 7.5, 10, 12.5 and 17.5 wt%) was investigated in a laminar feed flow at a feed concentration of 5 wt% and a temperature of 40 °C. Also, the effects of EAc concentration (1, 3 and 5 wt%) and operating temperature (30, 40 and 50 °C) at laminar (feed flow rate of 4 L min−1) and turbulent flow regimes (feed flow rate of 13 L min−1) were evaluated on the separation of EAc/water mixtures using the M0 and M10.0 membranes. The EAc concentration in the permeate solutions was specified using a gas chromatography (Younglin 6000 M Series Gas Chromatography, Anyang, Korea) equipped with a flame ionization detector (FID) and a TRB-Wax capillary column (Teknokroma, Barcelona, Spain) 60 m × 0.32 mm ID × 0.5 μm film thickness. The carrier gas was helium with a column pressure of 10 psi. The temperature of the oven, injector and detector were 100, 200 and 220 °C, respectively.The performances of the membranes for pervaporation separation of EAc/water mixture can be indicated in terms of total permeate flux (J) and separation factor (α) as follows:
 | (1) |
 | (2) |
Results and discussion
ZSM-5 zeolite characterization
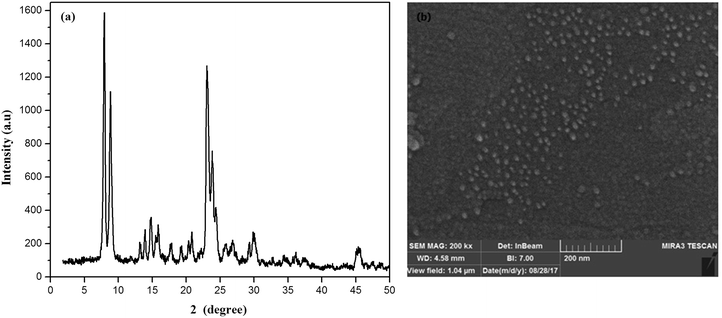
Fig. 2a shows the XRD pattern of the synthesized ZSM-5 zeolite. There are four sharp diffraction peaks at 2θ = 7.9, 8.8, 23.9 and 24.4° which are attributed to the ZSM-5 zeolite.42 The sharp peaks in the XRD pattern of zeolite indicated the pure crystalline structure of synthesized zeolites. The crystal size of zeolite particles obtained from the well-known Scherrer's equation was found to be 32.3 nm.The FESEM image of ZSM-5 zeolite (Fig. 2b) showed that the almost spherical-like ZSM-5 particles with a uniform size distribution in the range of 20–50 nm were synthesized. The average particle size of ZSM-5 zeolite particles was 35 nm. The XRF result on the synthesized ZSM-5 zeolite indicated that the SiO2/Al2O3 ratio was found to be 52.
Mixed matrix membranes characterization
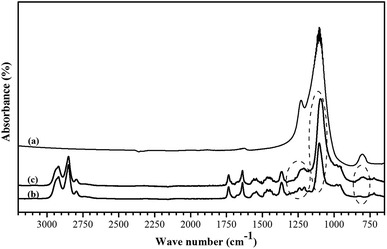
![[double bond, length as m-dash]](https://www.rsc.org/images/entities/char_e001.gif) O at 1730 cm−1 and amide I adsorption band at 1640 cm−1 are assigned to urethane groups of PEBA. The peaks at wave numbers of 1350–1400, 1150–1240 and 720 cm−1 are related to CCH bending, amide III stretching group and stretching C–C group, respectively. The adsorption bands at a wave number of about 1100 and 800 cm−1 confirmed the ether function group in the PEO block of PEBA. The observed new bands at a wave number of 1100 and 800 cm−1 in the FTIR spectrum of MMM show the presence of ZSM-5 zeolite in the PEBA matrix.40
O at 1730 cm−1 and amide I adsorption band at 1640 cm−1 are assigned to urethane groups of PEBA. The peaks at wave numbers of 1350–1400, 1150–1240 and 720 cm−1 are related to CCH bending, amide III stretching group and stretching C–C group, respectively. The adsorption bands at a wave number of about 1100 and 800 cm−1 confirmed the ether function group in the PEO block of PEBA. The observed new bands at a wave number of 1100 and 800 cm−1 in the FTIR spectrum of MMM show the presence of ZSM-5 zeolite in the PEBA matrix.40
| Membrane | Contact angle (°) |
|---|---|
| M0 | 81 ± 2.1 |
| M05.0 | 86 ± 1.9 |
| M07.5 | 90 ± 2.9 |
| M10.0 | 92 ± 1.7 |
| M12.5 | 94 ± 2.5 |
| M17.5 | 96 ± 1.6 |
Mixed matrix membranes pervaporation performance
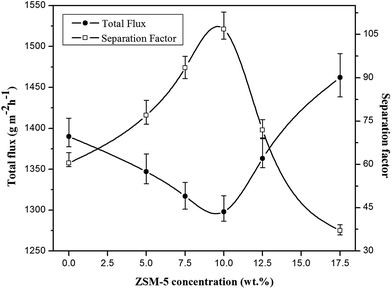 | ||
| Fig. 6 The effect of ZSM-5 concentration on the total flux and separation factor of various prepared membranes (EAc concentration = 5 wt% and T = 40 °C). | ||
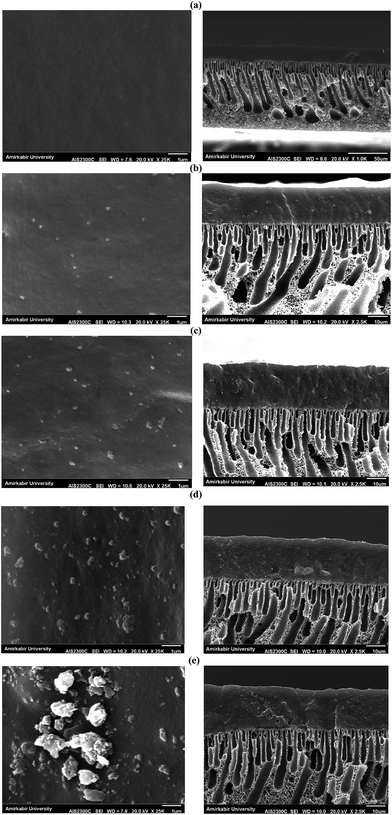
The permeation flux was increased at zeolite concentrations higher than 10 wt%. Defects in the top layer of the MMMs could be responsible for increasing the permeation flux of the dual-layer membrane containing 12.5 and 17.5 wt% ZSM-5. These defects were created in the membrane top layer due to agglomeration of ZSM-5 nanoparticles at high zeolite concentrations, as detected by the SEM analysis (Fig. 4d and e). The increase in separation factor by increasing zeolite loading content up to 10 wt% could be attributed to the enhancement in hydrophobicity of the membrane and increasing the sorption of EAc molecules by adding ZSM-5 zeolite into the PEBA/PES membranes as confirmed by contact angle tests. Based on the results of the contact angle test, by loading ZSM-5 zeolite into the PEBA matrix, the contact angle of the prepared membranes was increased which resulted in more selective sorption of the EAc molecules using the MMMs. The aggregation of ZSM-5 nanoparticles in MMMs at concentrations higher than 10 wt% zeolite resulted in defects between the polymer chains, which allowed the simultaneous permeation of EAc and water and led to a decrease in the separation factor. Therefore, the best separation performance was observed for the dual-layer ZSM-5/PEBA/PES membrane containing 10 wt% zeolite. Zhang et al.26 indicated that the optimum performance of the HTPB–PU/ZSM-5 membrane was obtained by loading 20 wt% ZSM-5 into the membranes for pervaporation separation of isopropyl acetate from aqueous solution. Gu et al.30 observed the enhancement in EAc/water separation factor by enhancement of the ZSM-5 loading from 0 to 10 wt% into the single layer PEBA membrane.
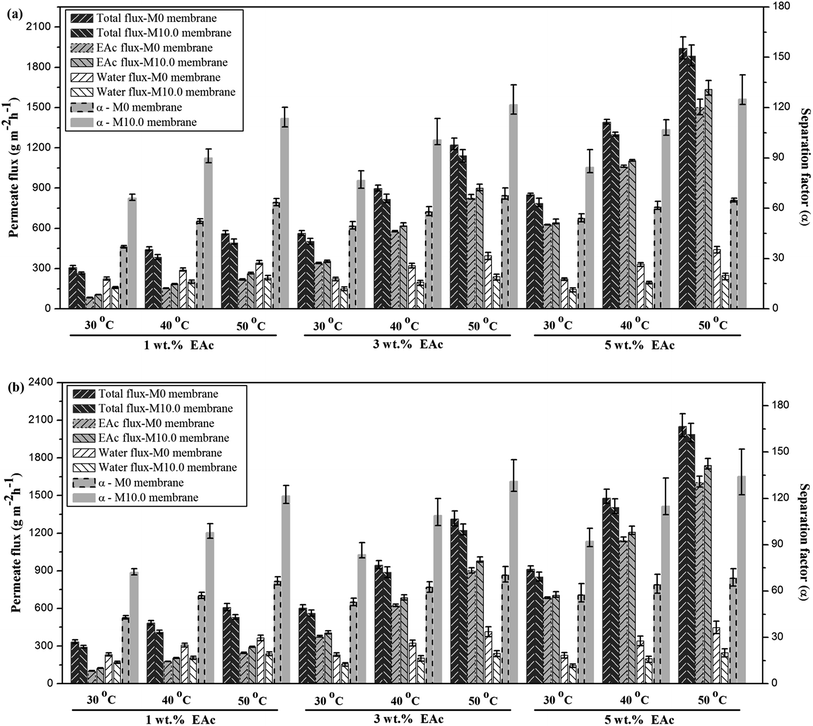
The comparison of the separation factor of both M0 and M10.0 membranes at the turbulent flow regime showed that the separation factor of both membranes in the turbulent flow regime was higher than the separation factor at laminar flow regime in different feed concentrations and operating temperatures as indicated in Fig. 7. The EAc permeation flux and total flux for both M0 and M10.0 membranes at the turbulent flow regime were higher than the laminar flow regime. By increasing the feed flow rate, the mass transfer rate of EAc from the bulk solution to the membrane surface was increased and subsequently the EAc partial flux and total flux were enhanced. This trend can be explained based on the resistance-in-series model in which the total mass transport resistance through a dual-layer membrane is the sum of the liquid boundary-layer resistance, intrinsic membrane active layer resistance and support layer resistance.48 When the liquid boundary-layer resistance is much larger than the intrinsic membrane resistance, the mass transfer in the boundary-layer becomes rate-limiting.49 Therefore, a change in the feed flow regime from laminar to turbulent leads to a decrease in the concentration polarization near the membrane surface and a reduction in the boundary-layer thickness, and consequently the permeation rate across the membrane enhances. These observations are consistent with the results in the literature. For instance, Dutta and Sikdar50 reported enhancement in the separation factor of trichloroethane with increasing feed flow rate. Psaume et al.51 indicated that the permeation flux was increased by increasing the Reynolds number. Li et al.52 observed an enhancement in both total flux and separation factor of the cellulose acetate/polydimethylsiloxane membrane for the pervaporation separation of acetone from aqueous solution by increasing flow rate. The permeation fluxes and separation factor as a function of feed concentration for the M0 and M10.0 membranes at a temperature of 40 °C and turbulent feed flow is indicated in Fig. 8. As shown, the separation factor, total flux and EAc partial flux of both membranes increased by variation in feed concentration from 1 to 5 wt%. The composition of feed solution has a remarkable influence on the component sorption into the membrane and on the component diffusion through the membrane, because the kinetic and thermodynamic properties of the permeating species and membrane are significantly affected by the component concentration in the feed solution. The enhancement in EAc permeation flux by increasing feed concentration could be attributed to increasing the driving force and acceleration of the diffusion rate of EAc molecular during the pervaporation process. Increasing EAc feed concentration will enhance the concentration gradient across the membrane; thereby the EAc permeation rate through the membrane increases. Also, the high sorption of EAc relative to water into the membranes due to the hydrophobic nature of the membrane is responsible for increasing the separation factor by increasing the EAc concentration in the feed solution. As confirmed by contact angle and FTIR tests, the hydrophobic structure of the PEBA/PES and ZSM-5/PEBA/PES membranes resulted in the faster sorption rate of EAc compared with the sorption rate of water and an enhancement in interaction between the EAc and membrane resulted in an increase in the separation factor by an enhancement in EAc concentration. The gradual increase in the water partial flux was observed by increasing EAc feed concentration for the M0 membrane, whereas the insignificant change in water flux was achieved by increasing feed concentration for the M10.0 membrane, as indicated in Fig. 8a. This behavior can be ascribed to the membrane swelling phenomenon. The membrane swelling due to an increase in the feed concentration affects the separation performance of the membrane. The swelling of the membrane leads to a membrane with higher free volume and unrestricted transfer of the permeating components through the membrane. When a higher EAc concentration feed solution was in contact with the neat PEBA/PES membrane, the membrane swelling occurred. This resulted in easier transport of water molecules through the swollen membrane, and consequently the water partial flux enhanced with the EAc feed concentration. The constant water permeation flux with an enhancement in the feed concentration for the M10.0 membranes indicated that the incorporation of ZSM-5 nanoparticles into the PEBA matrix prevents the membrane swelling.
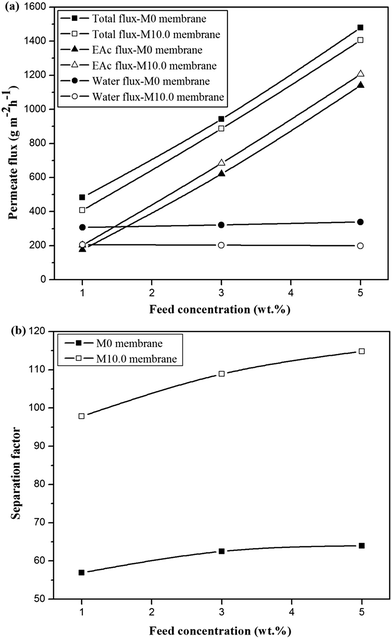 | ||
| Fig. 8 The effect of feed concentration on the permeate fluxes (a) and separation factor (b) for the M0 and M10.0 membranes at temperature of 40 °C and turbulent flow. | ||
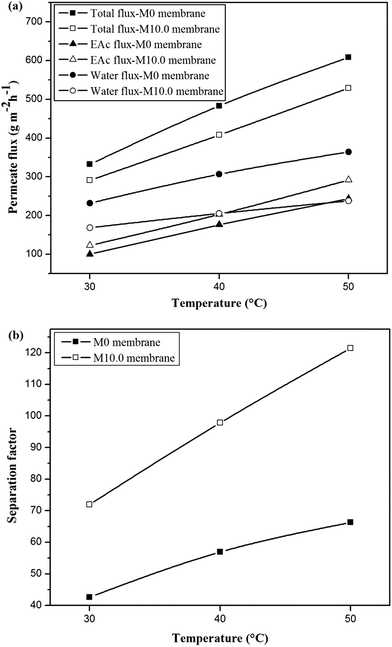
The permeation fluxes and separation factor as a function of feed temperature for the M0 and M10.0 membranes for the EAc feed concentration of 1 wt% and turbulent feed flow is shown in Fig. 9. It can be seen that all permeation fluxes and EAc separation factor increased by enhancing the feed temperature. Since the viscosity and diffusivity of components in the feed solution as well as the solubility and diffusivity of permeating components in the membrane are temperature dependent, a change in the operating temperature has a significant influence on the separation properties of the membrane. Moreover, in the dense polymeric membranes, the permeating components diffuse in the membrane via the free volumes, which are produced by jumping of the polymer chains. The frequency of polymer chain motions enhances by increasing temperature. Consequently the free volume in the polymer matrix increases and leads to higher permeation rate through the membrane. Therefore, both EAc and water partial fluxes and total flux enhance as the operating temperature goes to higher levels. Furthermore, Fig. 9b indicates that the separation factor enhanced by increasing the operating temperature. The EAc and water partial fluxes enhance with temperature, but the EAc flux is more sensitive to variation in the feed temperature because of its higher activation energy for the permeation. Thus, the separation factor that is proportional to the ratio of the EAc flux to water flux increases by enhancing the operating temperature. Similar reports are presented in the literature for the effect of feed concentration and temperature on the permeation flux and separation factor. For example, Zhang et al.26 observed an enhancement in the isopropyl acetate and water partial flux, total flux and separation factor using the HTPB–PU/ZSM-5 membrane by increasing feed concentration from 0.2 to 1 wt% and operating temperature from 30 to 60 °C. Gu et al.30 investigated the effect of feed concentration and temperature on the pervaporation performance of the ZSM-5/PEBA membrane toward low concentrations of EAc from aqueous solution. They found the significant enhancement in the EAc partial flux, total flux and separation factor as well as gradual reduction in the water partial flux by increasing feed concentration. Both separation factor and total flux were also enhanced by increasing the feed temperature up to 50 °C. Tan et al.53 also observed that both separation factor and total permeation flux for separation of n-butanol/water mixtures using the ZSM-5/PEBA membrane were increased by enhancing temperature and feed concentration.
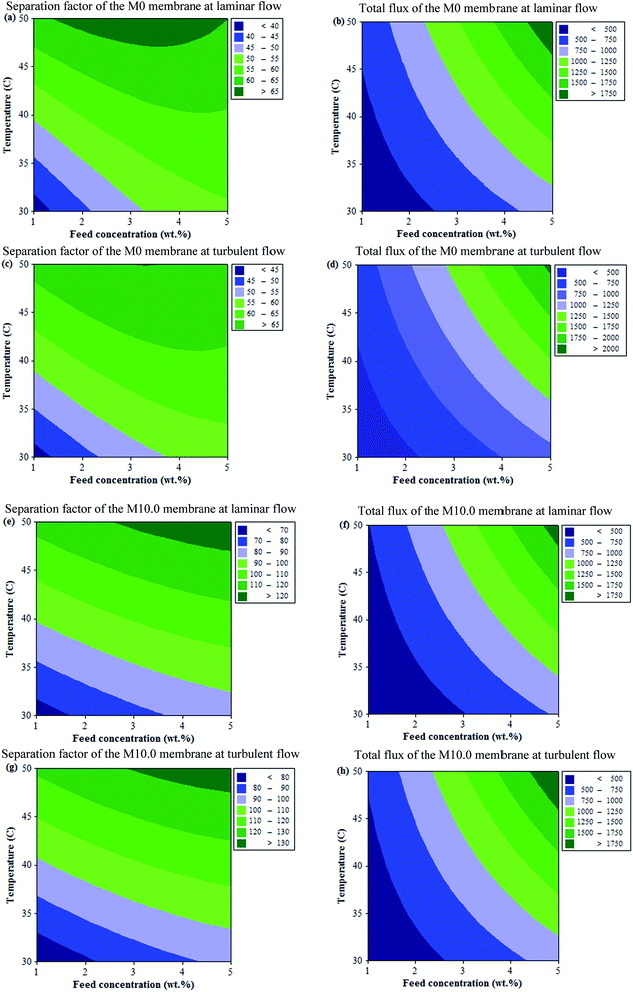
| Y = β0 + β1X1 + β2X2 + β3X12 + β4X22 + β5X1X2 | (3) |
| Source | DF | Laminar flow regime | Turbulent flow regime | ||||||||||
|---|---|---|---|---|---|---|---|---|---|---|---|---|---|
| Separation factor | Total flux | Separation factor | Total flux | ||||||||||
| Sum of squares | F factor | P factor | Sum of squares | F factor | P factor | Sum of squares | F factor | P factor | Sum of squares | F factor | P factor | ||
| Regression | 5 | 713.367 | 154.60 | 0.001 | 2![[thin space (1/6-em)]](https://www.rsc.org/images/entities/char_2009.gif) 217 217![[thin space (1/6-em)]](https://www.rsc.org/images/entities/char_2009.gif) 883 883 |
10![[thin space (1/6-em)]](https://www.rsc.org/images/entities/char_2009.gif) 779.99 779.99 |
0.000 | 604.314 | 417.71 | 0.000 | 2![[thin space (1/6-em)]](https://www.rsc.org/images/entities/char_2009.gif) 458 458![[thin space (1/6-em)]](https://www.rsc.org/images/entities/char_2009.gif) 380 380 |
5845.55 | 0.000 |
| Linear | 2 | 633.376 | 343.16 | 0.000 | 2![[thin space (1/6-em)]](https://www.rsc.org/images/entities/char_2009.gif) 041 041![[thin space (1/6-em)]](https://www.rsc.org/images/entities/char_2009.gif) 397 397 |
24![[thin space (1/6-em)]](https://www.rsc.org/images/entities/char_2009.gif) 805.46 805.46 |
0.000 | 544.613 | 941.10 | 0.000 | 2![[thin space (1/6-em)]](https://www.rsc.org/images/entities/char_2009.gif) 271 271![[thin space (1/6-em)]](https://www.rsc.org/images/entities/char_2009.gif) 367 367 |
13![[thin space (1/6-em)]](https://www.rsc.org/images/entities/char_2009.gif) 502.18 502.18 |
0.000 |
| X1 | 1 | 119.260 | 129.23 | 0.001 | 1![[thin space (1/6-em)]](https://www.rsc.org/images/entities/char_2009.gif) 374 374![[thin space (1/6-em)]](https://www.rsc.org/images/entities/char_2009.gif) 731 731 |
33![[thin space (1/6-em)]](https://www.rsc.org/images/entities/char_2009.gif) 409.30 409.30 |
0.000 | 92.905 | 321.08 | 0.000 | 1![[thin space (1/6-em)]](https://www.rsc.org/images/entities/char_2009.gif) 518 518![[thin space (1/6-em)]](https://www.rsc.org/images/entities/char_2009.gif) 054 054 |
18![[thin space (1/6-em)]](https://www.rsc.org/images/entities/char_2009.gif) 048.2 048.2 |
0.000 |
| X2 | 1 | 514.115 | 557.09 | 0.000 | 666![[thin space (1/6-em)]](https://www.rsc.org/images/entities/char_2009.gif) 667 667 |
16![[thin space (1/6-em)]](https://www.rsc.org/images/entities/char_2009.gif) 201.62 201.62 |
0.000 | 451.707 | 1561.12 | 0.000 | 753![[thin space (1/6-em)]](https://www.rsc.org/images/entities/char_2009.gif) 313 313 |
8956.16 | 0.000 |
| Square | 2 | 19.151 | 10.38 | 0.045 | 924 | 11.23 | 0.040 | 18.741 | 32.39 | 0.009 | 1252 | 7.44 | 0.069 |
| X1 × X1 | 1 | 17.543 | 19.01 | 0.022 | 910 | 22.12 | 0.018 | 13.957 | 48.24 | 0.006 | 1250 | 14.86 | 0.031 |
| X2 × X2 | 1 | 1.608 | 1.74 | 0.279 | 14 | 0.35 | 0.598 | 4.784 | 16.53 | 0.027 | 2 | 0.02 | 0.887 |
| Interaction | 1 | 60.840 | 65.93 | 0.004 | 175![[thin space (1/6-em)]](https://www.rsc.org/images/entities/char_2009.gif) 561 561 |
4266.56 | 0.000 | 40.960 | 141.56 | 0.001 | 185![[thin space (1/6-em)]](https://www.rsc.org/images/entities/char_2009.gif) 761 761 |
2208.52 | 0.000 |
| X1 × X2 | 1 | 60.840 | 65.93 | 0.004 | 175![[thin space (1/6-em)]](https://www.rsc.org/images/entities/char_2009.gif) 561 561 |
4266.56 | 0.000 | 40.960 | 141.56 | 0.001 | 185![[thin space (1/6-em)]](https://www.rsc.org/images/entities/char_2009.gif) 761 761 |
2208.52 | 0.000 |
| Residual error | 3 | 2.769 | 123 | 0.868 | 252 | ||||||||
| Total | 8 | 716.135 | 2![[thin space (1/6-em)]](https://www.rsc.org/images/entities/char_2009.gif) 218 218![[thin space (1/6-em)]](https://www.rsc.org/images/entities/char_2009.gif) 006 006 |
605.182 | 2![[thin space (1/6-em)]](https://www.rsc.org/images/entities/char_2009.gif) 458 458![[thin space (1/6-em)]](https://www.rsc.org/images/entities/char_2009.gif) 632 632 |
||||||||
| Source | DF | Laminar flow regime | Turbulent flow regime | ||||||||||
|---|---|---|---|---|---|---|---|---|---|---|---|---|---|
| Separation factor | Total flux | Separation factor | Total flux | ||||||||||
| Sum of squares | F factor | P factor | Sum of squares | F factor | P factor | Sum of squares | F factor | P factor | Sum of squares | F factor | P factor | ||
| Regression | 5 | 3344.74 | 1110.54 | 0.000 | 2![[thin space (1/6-em)]](https://www.rsc.org/images/entities/char_2009.gif) 163 163![[thin space (1/6-em)]](https://www.rsc.org/images/entities/char_2009.gif) 062 062 |
1621.45 | 0.000 | 3664.84 | 2246.74 | 0.000 | 2![[thin space (1/6-em)]](https://www.rsc.org/images/entities/char_2009.gif) 403 403![[thin space (1/6-em)]](https://www.rsc.org/images/entities/char_2009.gif) 742 742 |
5552.44 | 0.000 |
| Linear | 2 | 3321.08 | 2756.71 | 0.000 | 1![[thin space (1/6-em)]](https://www.rsc.org/images/entities/char_2009.gif) 971 971![[thin space (1/6-em)]](https://www.rsc.org/images/entities/char_2009.gif) 024 024 |
3693.75 | 0.000 | 3635.56 | 5571.96 | 0.000 | 2![[thin space (1/6-em)]](https://www.rsc.org/images/entities/char_2009.gif) 201 201![[thin space (1/6-em)]](https://www.rsc.org/images/entities/char_2009.gif) 550 550 |
12![[thin space (1/6-em)]](https://www.rsc.org/images/entities/char_2009.gif) 713.47 713.47 |
0.000 |
| X1 | 1 | 362.70 | 602.14 | 0.000 | 1![[thin space (1/6-em)]](https://www.rsc.org/images/entities/char_2009.gif) 330 330![[thin space (1/6-em)]](https://www.rsc.org/images/entities/char_2009.gif) 104 104 |
4985.29 | 0.000 | 414.00 | 1269.03 | 0.000 | 1![[thin space (1/6-em)]](https://www.rsc.org/images/entities/char_2009.gif) 512 512![[thin space (1/6-em)]](https://www.rsc.org/images/entities/char_2009.gif) 024 024 |
17![[thin space (1/6-em)]](https://www.rsc.org/images/entities/char_2009.gif) 463.22 463.22 |
0.000 |
| X2 | 1 | 2958.37 | 4911.29 | 0.000 | 640![[thin space (1/6-em)]](https://www.rsc.org/images/entities/char_2009.gif) 920 920 |
2402.20 | 0.000 | 3221.56 | 9874.90 | 0.000 | 689![[thin space (1/6-em)]](https://www.rsc.org/images/entities/char_2009.gif) 526 526 |
7963.73 | 0.000 |
| Square | 2 | 12.21 | 10.13 | 0.046 | 2377 | 4.45 | 0.126 | 15.59 | 23.90 | 0.014 | 1040 | 6.01 | 0.089 |
| X1 × X1 | 1 | 8.50 | 14.11 | 0.033 | 2112 | 7.92 | 0.067 | 11.46 | 35.12 | 0.010 | 968 | 11.18 | 0.044 |
| X2 × X2 | 1 | 3.71 | 16.16 | 0.049 | 264 | 0.99 | 0.393 | 4.14 | 12.68 | 0.038 | 72 | 0.83 | 0.429 |
| Interaction | 1 | 11.46 | 19.02 | 0.022 | 189![[thin space (1/6-em)]](https://www.rsc.org/images/entities/char_2009.gif) 660 660 |
710.86 | 0.000 | 13.69 | 41.96 | 0.007 | 201![[thin space (1/6-em)]](https://www.rsc.org/images/entities/char_2009.gif) 152 152 |
2323.22 | 0.000 |
| X1 × X2 | 1 | 11.46 | 19.02 | 0.022 | 189![[thin space (1/6-em)]](https://www.rsc.org/images/entities/char_2009.gif) 660 660 |
710.86 | 0.000 | 13.69 | 41.96 | 0.007 | 201![[thin space (1/6-em)]](https://www.rsc.org/images/entities/char_2009.gif) 152 152 |
2323.22 | 0.000 |
| Residual error | 3 | 1.81 | 800 | 0.98 | 260 | ||||||||
| Total | 8 | 3346.55 | 2![[thin space (1/6-em)]](https://www.rsc.org/images/entities/char_2009.gif) 163 163![[thin space (1/6-em)]](https://www.rsc.org/images/entities/char_2009.gif) 862 862 |
3665.82 | 2![[thin space (1/6-em)]](https://www.rsc.org/images/entities/char_2009.gif) 404 404![[thin space (1/6-em)]](https://www.rsc.org/images/entities/char_2009.gif) 002 002 |
||||||||
| Y | β0 | β1 | β2 | β3 | β4 | β5 |
|---|---|---|---|---|---|---|
| Separation factor of the M0 membrane at laminar flow | −15.61 | 14.47 | 1.51 | −0.74 | 0.000 | −0.195 |
| Total flux of the M0 membrane at laminar flow | 147.00 | −211.00 | 1.91 | 5.33 | 0.000 | 10.47 |
| Separation factor of the M0 membrane at turbulent flow | −27.62 | 12.33 | 2.58 | −0.66 | −0.015 | −0.16 |
| Total flux of the M0 membrane at turbulent flow | 129.75 | −217.00 | 3.11 | 6.25 | 0.000 | 10.78 |
| Separation factor of the M10.0 membrane at laminar flow | −36.52 | 10.36 | 3.56 | −0.51 | −0.013 | −0.085 |
| Total flux of the M10.0 membrane at laminar flow | 184.38 | −248.83 | 0.02 | 8.13 | 0.000 | 10.89 |
| Separation factor of the M10.0 membrane at turbulent flow | −35.89 | 11.44 | 3.75 | −0.59 | −0.014 | −0.092 |
| Total flux of the M10.0 membrane at turbulent flow | 175.33 | −230.50 | 0.26 | 5.50 | 0.000 | 11.21 |
Comparison of pervaporation performance
The pervaporation separation of EAc from aqueous solution using the prepared membranes at optimum conditions was compared with other PEBA and MMMs reported by other researchers and the results are listed in Table 6. As shown, the total flux of the prepared MMMs in this work is higher than those of other reported membranes in the literature. The good balance in the trade-off between the permeation flux and the separation factor of the prepared membrane was observed. The use of ZSM-5 zeolite increased the EAc separation factor of the M10.0 membrane.| Membrane | Feed (wt%) | T (°C) | Flux (g m−2 h−1) | Separation factor | Ref. |
|---|---|---|---|---|---|
| PEBA/ZSM-5 | 5 | 50 | 199.5 | 185 | 30 |
| P(VDF-HFP)/[bmim]BF4 | 5 | 45 | 737 | 123 | 54 |
| P(VDF-HFP) | 5 | 45 | 510 | 65 | 54 |
| PDMS/PTFE | 0.99 | 30 | 276 | 95 | 55 |
| P(VDF-co-HFP) | 3 | 30 | 690 | 163 | 56 |
| P(VDF-HFP) | 3 | 30 | 415 | 80 | 57 |
| PDMS | 5 | 40 | 460 | 76 | 58 |
| PDMS/PMHS | 5 | 40 | 260 | 24 | 58 |
| Polyurethane urea | 2.5 | 30 | 250 | 655 | 59 |
| M0 | 5 | 50 | 1940 | 64.70 | This study |
| M10.0 | 5 | 50 | 1985 | 134.22 |
Conclusion
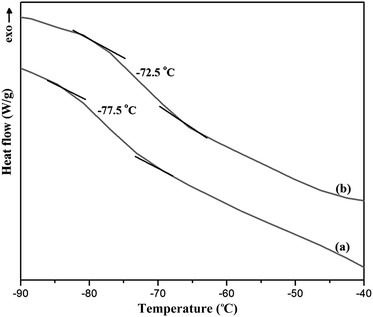
The EAc was successfully separated from its aqueous solution by the pervaporation process with the prepared ZSM-5/PEBA/PES dual-layer mixed matrix membranes. The influences of zeolite content of the membrane and operating parameters of the pervaporation process like feed concentration, temperature and feed flow regime on the separation performance of the prepared membranes were investigated. The ZSM-5 zeolite nanoparticles were synthesized via the conventional hydrothermal method. The XRD pattern of ZSM-5 zeolite showed the crystalline structure of the synthesized zeolite particles. The SEM images of the prepared membranes indicated the homogenous dispersion of ZSM-5 zeolite in the top layer of the membranes up to 10 wt% zeolite, while the aggregation of ZSM-5 nanoparticles in the top layer was observed by zeolite loading concentrations higher than 10 wt%. The contact angle measurement indicated that the hydrophobicity and glass transient temperature of membranes was increased by loading ZSM-5 zeolite into the PEBA/PES dual-layer membranes. The maximum separation factor of 106.83 and total flux of 1298 g m−2 h−1 were obtained by loading 10 wt% ZSM-5 zeolite into the PEBA matrix for feed concentration of 5 wt% and temperature of 40 °C at laminar feed flow. The results of pervaporation experiments showed that the separation factor, total permeation flux and EAc partial flux of both neat and mixed matrix membranes were increased by increasing feed concentration from 1 to 5 wt% and temperature from 30 to 50 °C. The water partial flux of MMMs did not change by increasing feed concentration, whereas an enhancement in the operating temperature resulted in a gradual increase in the water flux. The comparison of the membranes performance for the separation of EAc from EAc/water mixtures in the laminar and turbulent feed flow regimes revealed that the separation factor of both M0 and M10.0 membranes at the turbulent flow regime was higher than the separation factor values at the laminar flow regime. The EAc partial flux and total flux for both M0 and M10.0 membranes at the turbulent flow regime were higher than those of the laminar flow regime, whereas the water flux was almost constant at laminar and turbulent flow regimes for MMMs. The ANOVA results were evaluated for the total flux and separation factor of the M0 and M10.0 membranes as functions of feed concentration and operating temperature at laminar and turbulent flow. It was found that the temperature had a higher effect on the separation factor compared with the feed concentration, as the F value of temperature was higher than that of the EAc feed concentration.Conflicts of interest
There are no conflicts to declare.References
- G. Jyoti, A. Keshav and J. Anandkumar, J. Eng., 2015, 2015, 1 CrossRef.
- Y. K. Ong, G. M. Shi, N. L. Le, Y. P. Tang, J. Zuo, S. P. Nunes and T. S. Chung, Prog. Polym. Sci., 2016, 57, 1 CrossRef CAS.
- S. Tanaka, Y. Chao, S. Araki and Y. Miyake, J. Membr. Sci., 2010, 348, 383 CrossRef CAS.
- P. Sampranpiboon, R. Jiraratananon, D. Uttapap, X. Feng and R. Y. M. Huang, J. Membr. Sci., 2000, 174, 55 CrossRef CAS.
- X. Tian, B. Zhu and Y. Xu, J. Membr. Sci., 2005, 248, 109 CrossRef CAS.
- N. Ma, Z. Zhan and Z. Wang, Microporous Mesoporous Mater., 2016, 235, 100 CrossRef CAS.
- S. L. Wee, C. T. Tye and S. Bhatia, Sep. Purif. Technol., 2008, 63, 500 CrossRef CAS.
- J. Sekulić, M. W. J. Luiten, J. E. T. Elshof, N. E. Benes and K. Keizer, Desalination, 2002, 148, 19 CrossRef.
- S. D. Bhat and T. M. Aminabhavi, Sep. Purif. Rev., 2007, 36, 203 CrossRef CAS.
- C. Ding, X. Zhang, C. Li, X. Hao, Y. Wang and G. Guan, Sep. Purif. Technol., 2016, 166, 252 CrossRef CAS.
- A. Sabetghadam and T. Mohammadi, Compos. Interfaces, 2010, 17, 223 CrossRef CAS.
- C. F. Zhang, G. L. Wu, L. L. Dong, J. Tang, Y. X. Bai, Y. H. Zhu, Q. S. Liu, Y. P. Sun and J. Gu, RSC Adv., 2016, 6, 18308 RSC.
- J. Zhao, Y. Zhu, F. Pan, G. He, C. Fang, K. Cao, R. Xing and Z. Jiang, J. Membr. Sci., 2015, 487, 162 CrossRef CAS.
- L. Aouinti, D. Roizard and M. Belbachir, Sep. Purif. Technol., 2015, 147, 51 CrossRef CAS.
- N. Wang, S. Ji, J. Li, R. Zhang and G. Zhang, J. Membr. Sci., 2014, 455, 113 CrossRef CAS.
- M. Amirilargani, M. A. Tofighy, T. Mohammadi and B. Sadatnia, Ind. Eng. Chem. Res., 2014, 53, 12819 CrossRef CAS.
- G. Dudek, M. Gnus, R. Turczyn, A. Strzelewicz and M. Krasowska, Sep. Purif. Technol., 2014, 133, 8 CrossRef CAS.
- T. Jose, S. C. George, H. J. Maria, R. Wilson and S. Thomas, Ind. Eng. Chem. Res., 2014, 53, 16820 CrossRef CAS.
- E. J. Flynn, D. A. Keane, P. M. Tabari and M. A. Morris, Sep. Purif. Technol., 2013, 118, 73 CrossRef CAS.
- M. Amirilargani and B. Sadatnia, J. Membr. Sci., 2014, 469, 1 CrossRef CAS.
- T. Khosravi, S. Mosleh, O. Bakhtiari and T. Mohammadi, Chem. Eng. Res. Des., 2012, 90, 2353 CrossRef CAS.
- H. G. Premakshi, K. Ramesh and M. Y. Kariduraganavar, Chem. Eng. Res. Des., 2015, 94, 32 CrossRef CAS.
- M. Fathizadeh, A. Aroujalian, A. Raisi and M. Fotouhi, Desalination, 2013, 314, 20 CrossRef CAS.
- Y. Fathi, A. Raisi and A. Aroujalian, Desalin. Water Treat., 2017, 60, 188 CrossRef.
- S. Fazlifard, T. Mohammadi and O. Bakhtiari, Chem. Eng. Technol., 2017, 40, 648 CrossRef CAS.
- C. Zhang, L. Yang, Y. Bai, J. Gu and Y. Sun, Sep. Purif. Technol., 2012, 85, 8 CrossRef CAS.
- P. Shao and A. Kumar, J. Membr. Sci., 2009, 339, 143 CrossRef CAS.
- A. A. Kittur, S. K. Choudhari and M. Y. Kariduraganavar, Compos. Interfaces, 2006, 13, 507 CrossRef CAS.
- L. M. Vane, V. V. Namboodiri and T. C. Bowen, J. Membr. Sci., 2008, 308, 230 CrossRef CAS.
- J. Gu, X. Zhang, Y. Bai, L. Yang, C. Zhang and Y. Sun, Int. J. Polym. Sci., 2013, 2013, 1 Search PubMed.
- F. Asvadi, A. Raisi and A. Aroujalian, Microporous Mesoporous Mater., 2017, 251, 135 CrossRef CAS.
- S. Panahian, A. Raisi and A. Aroujalian, Desalination, 2015, 355, 45 CrossRef CAS.
- Y. Wang, Ind. Eng. Chem. Res., 2015, 54, 3082 CrossRef CAS.
- H. K. Yuan, J. Ren, X. H. Ma and Z. L. Xu, Desalination, 2011, 280, 252 CrossRef CAS.
- Y. T. Tang, Y. W. Chen, H. P. Huang, C. C. Yu, S. B. Hung and M. J. Lee, AIChE J., 2005, 51, 1683 CrossRef CAS.
- A. Penkova, G. Polotskaya and A. Toikka, Chem. Eng. Process., 2015, 87, 81 CrossRef CAS.
- I. Sadeghi, A. Aroujalian, A. Raisi, B. Dabir and M. Fathizadeh, J. Membr. Sci., 2013, 430, 24 CrossRef CAS.
- K. Zarshenas, A. Raisi and A. Aroujalian, RSC Adv., 2015, 5, 19760 RSC.
- S. A. Habibiannejad, A. Aroujalian and A. Raisi, RSC Adv., 2016, 6, 79563 RSC.
- K. Zarshenas, A. Raisi and A. Aroujalian, J. Membr. Sci., 2016, 510, 270 CrossRef CAS.
- A. Aroujalian and A. Raisi, J. Membr. Sci., 2007, 303, 154 CrossRef CAS.
- R. Van Grieken, J. L. Sotelo, J. M. Menendez and J. A. Melero, Microporous Mesoporous Mater., 2000, 39, 135 CrossRef CAS.
- L. Shirazi, E. Jamshidi and M. R. Ghasemi, Cryst. Res. Technol., 2008, 43, 1300 CrossRef CAS.
- B. Yu, H. Cong, Z. Li, J. Tang and X. S. Zhao, J. Appl. Polym. Sci., 2013, 130, 2867 CrossRef CAS.
- M. M. Rahman, V. Filiz, S. Shishatskiy, C. Abetz, S. Neumann, S. Bolmer, M. M. Khan and V. Abetz, J. Membr. Sci., 2013, 437, 286 CrossRef CAS.
- J. H. Kim, B. R. Min, J. Won, S. H. Joo, H. S. Kim and Y. S. Kang, Macromolecules, 2003, 36, 6183 CrossRef CAS.
- X. Qiao, T. S. Chung and R. Rajagopalan, Chem. Eng. Sci., 2006, 61, 6816 CrossRef CAS.
- A. Raisi, A. Aroujalian and T. Kaghazchi, Sep. Sci. Technol., 2009, 44, 3538 CrossRef CAS.
- M. Peng, L. M. Vane and S. X. Liu, J. Hazard. Mater., 2013, 98, 69 CrossRef.
- B. K. Dutta and S. K. Sikdar, Environ. Sci. Technol., 1999, 33, 1709 CrossRef CAS.
- R. Psaume, P. Aptel, Y. Aurelle, J. C. Mora and J. L. Bersillon, J. Membr. Sci., 1988, 36, 373 CrossRef CAS.
- L. Li, Z. Xiao, S. Tan, L. Pu and Z. Zhang, J. Membr. Sci., 2004, 243, 177 CrossRef CAS.
- H. Tan, Y. Wu and T. Li, J. Appl. Polym. Sci., 2013, 129, 105 CrossRef CAS.
- D. Yongquan, W. Ming, C. Lin and L. Mingjun, Desalination, 2012, 295, 53 CrossRef.
- W. D. Zhang, W. Sun, J. Yang and Z. Q. Ren, Appl. Biochem. Biotechnol., 2010, 160, 156 CrossRef CAS PubMed.
- B. K. Zhu, X. Z. Tian and Y. Y. Xu, Desalination, 2005, 184, 71 CrossRef CAS.
- X. Tian, X. Jiang, B. Zhu and Y. Xu, J. Membr. Sci., 2006, 279, 479 CrossRef CAS.
- M. Osorio-Galindo, A. Iborra-Clar, I. Alcaina-Miranda and A. Ribes-Greus, J. Appl. Polym. Sci., 2001, 81, 546 CrossRef CAS.
- Y. Bai, J. Qian, C. Zhang, L. Zhang, Q. An and H. Chen, J. Membr. Sci., 2008, 325, 932 CrossRef CAS.
| This journal is © The Royal Society of Chemistry 2018 |

