 Open Access Article
Novel magnetic g-C3N4/α-Fe2O3/Fe3O4 composite for the very effective visible-light-Fenton degradation of Orange II
Zhuliang Wangab,
Yiping Fana,
Rong Wua,
Yaoxing Huoa,
Hao Wu *ab,
Fang Wangab and
Xiaohong Xu
 *ab
*ab
aSchool of Chemistry and Materials Science of Shanxi Normal University, Key Laboratory of Magnetic Molecules and Magnetic Information Materials of Ministry of Education, Linfen, 041004, China. E-mail: xuxh@sxnu.edu.cn; wuhao@sxnu.edu.cn
bResearch Institute of Materials Science of Shanxi Normal University, Collaborative Innovation Center for Shanxi Advanced Permanent Magnetic Materials and Techonology, Linfen, 041004, China
First published on 30th January 2018
Abstract
A novel magnetic heterogeneous g-C3N4/α-Fe2O3/Fe3O4 catalyst was successfully synthesized through a simple hydrothermal method. The structure, morphology, and optical properties of the catalyst were characterized. The photocatalytic activity of the heterogeneous g-C3N4/α-Fe2O3/Fe3O4 catalyst for the photo-Fenton degradation of Orange II in the presence of H2O2 irradiated with visible light (λ > 420 nm) at neutral pH was evaluated. The g-C3N4/α-Fe2O3/Fe3O4 photocatalyst was found to be an excellent catalyst for the degradation of Orange II and offers great advantages over the traditional Fenton system (Fe(II/III)/H2O2). The results indicated that successfully combining monodispersed Fe3O4 nanoparticles and g-C3N4/α-Fe2O3 enhanced light harvesting, retarded photogenerated electron–hole recombination, and significantly enhanced the photocatalytic activity of the system. The g-C3N4/α-Fe2O3/Fe3O4 (30%) sample gave the highest degradation rate constant, 0.091 min−1, which was almost 4.01 times higher than the degradation rate constant for α-Fe2O3 and 2.65 times higher than the degradation rate constant for g-C3N4/α-Fe2O3 under the same conditions. A reasonable mechanism for catalysis by the g-C3N4/α-Fe2O3/Fe3O4 composite was developed. The g-C3N4/α-Fe2O3/Fe3O4 composite was found to be stable and recyclable, meaning it has great potential for use as a photo-Fenton catalyst for effectively degrading organic pollutants in wastewater.
1. Introduction
Increasing amounts of synthetic organic dye pollutants are being released into the environment after synthetic dyes have been used in the textile, leather, pharmaceutical, food, and other industries.1 Advanced oxidation processes including ozonation, Fenton reactions, photo-Fenton reactions, photocatalysis, ultrasonication, and other processes can potentially be used to degrade recalcitrant organic contaminants because total mineralization is more likely to be achieved using advanced oxidation processes than using classical wastewater treatment processes.2–7 The Fenton reaction, an advanced oxidation process, involves producing radicals using homogeneous Fe(II/III) and H2O2. The Fenton reaction has been shown to be an effective treatment for wastewater produced by various industries because it is fast, simple to perform, and does not produce toxic products8,9 However, there are some drawbacks to homogeneous processes such as the Fenton reaction in that sludge is generated, the pH must be adjusted before and after the reaction, and the catalyst is lost in the effluent. These drawbacks limit the applications of the Fenton reaction.10 Using a solid catalyst in a “heterogeneous Fenton oxidation reaction” may solve these problems.11,12Hematite (α-Fe2O3), a common semiconductor with a narrow band gap of 1.9–2.1 eV, has been used as a heterogeneous photo-Fenton catalyst. α-Fe2O3 is easy and cheap to produce, nontoxic, and can be used over a wide pH range.13 The photocatalytic degradation efficiency achieved using α-Fe2O3 can be markedly increased by coupling the α-Fe2O3 with other oxides or semiconductors.14–20 Graphitic carbon nitride (g-C3N4), which has been studied in recent years, is a typical metal-free polymeric semiconductor that is very chemically stable and environmentally benign, and it has been found to have a band gap of 2.7 eV, making it suitable for absorbing visible light. g-C3N4 is therefore a promising candidate for coupling with α-Fe2O3 to form a heterogeneous photo-Fenton catalyst. Many attempts have been made to fabricate α-Fe2O3/g-C3N4 composites for photodegrading organic dyes using visible light.21,22 However, the g-C3N4/α-Fe2O3 heterogeneous catalyst is not appropriate for practical use because it is difficult to remove from suspension and reuse. Magnetically separable photocatalysts have attracted considerable interest because they can be removed from suspensions easily.
Many magnetic materials are available (e.g., Fe3O4, γ-Fe2O3, and MFe2O4, where M is Ba2+, Co2+, Mg2+, Mn2+, Ni2+, or Zn2+). Magnetite (Fe3O4) is one of the most popular materials for producing magnetically recoverable catalysts because it is cheap, has a desirable degree of magnetism, and is nontoxic.23 However, Fe3O4 is very conductive, so it can transfer photogenerated electrons rapidly, improving charge carrier separation efficiency.24 It has recently been found that immobilizing a photocatalyst using Fe3O4 nanoparticles can effectively increase the cyclic utilization rate and improve the photodegradation efficiency of the catalyst.25–29 The preparation of magnetically separable visible-light-driven photocatalysts based on Fe3O4 is an active research field. However, to the best of our knowledge, g-C3N4/α-Fe2O3/Fe3O4 composites have not previously been prepared or their photo-Fenton catalytic properties investigated.
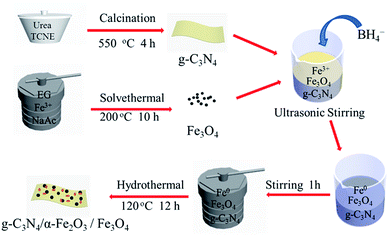
In the work presented here a novel magnetic g-C3N4/α-Fe2O3/Fe3O4 composite was synthesized using a simple hydrothermal method. The heterogeneous photo-Fenton activity of the g-C3N4/α-Fe2O3/Fe3O4 composite was investigated using the composite to degrade Orange II, a typical recalcitrant organic contaminant. The effects of the g-C3N4/α-Fe2O3 to Fe3O4 weight ratio, scavengers of reactive species, and the role of hydrogen peroxide (H2O2) on the photocatalytic activity of the composite were investigated in detail. The results demonstrated that successfully combining monodispersed Fe3O4 nanoparticles and g-C3N4/α-Fe2O3 enhanced light harvesting, retarded photogenerated electron–hole recombination, and significantly enhanced the photocatalytic activity of the g-C3N4/α-Fe2O3/Fe3O4. The magnetic recovery and reusability of the composite were also investigated, and the results indicated that the g-C3N4/α-Fe2O3/Fe3O4 composite will be a valuable photocatalyst that could be used to organic dye wastewater treatment.
2. Experimental
2.1. Chemical reagents and materials
Ferric chloride (FeCl3·6H2O 99%) and polyethylene glycol 4000 (PEG-4000) were purchased from Shanghai Chemical Reagents Company (Shanghai, China). Urea (99%) was purchased from Kermel (Tianjin, China) and NaBH4 (AR) was purchased from Da mao (Tianjin, China). TCNE (98%), Orange II (99.9%, C16H11N2NaO4S) and sodium acetate (NaAc 99%) were provided by Acros Organics (New Jersey, USA). Ethylene glycol (EG ≥ 99%) was purchased from Sigma-Aldrich. Coumarin (COU 99%) was purchased from J&K Scientific Ltd. (Beijing China). All chemicals were analytical grade and used as received without further purification.2.2. Characterization
The crystal phases of the sample were analyzed by X-ray diffraction (XRD: Rigaku Ultima IV, Japan). A scanning electron microscope (SEM, JSM-7500F, JEOL, Japan) was used to characterize the morphology of the obtained products. The composite of the sample was investigated by the energy dispersive spectroscopy (EDS) attached to the SEM. The structure and morphology of the products were examined by transmission electron microscopy (TEM: JEOL2100, Japan). Fourier transform infrared spectra (FT-IR) were measured using Spectrum One infrared spectrometer with KBr as the reference. The photoluminescence spectra (PL) of samples were measured with a fluorescence spectrophotometer (LSP920, UK) using a Xe lamp as an excitation source with optical filters. UV-vis diffuse reflectance spectroscopy was recorded with a spectrophotometer (UV-2700, shimadzu Japan). The PL spectra of hydroxyl radical (˙OH) detection were measured by a fluorescence spectrophotometer (Cray Eclipse, Agilent Technologies Australia). The specific surface area and pore size distributions were measured with liquid nitrogen at 77 K using a Micromeritics ASAP 2020 instrument via the Brunauer–Emmett–Teller (BET) method (Quantachrome, USA). The magnetic property was measured by Physical Property Measurement System (PPMS, XL-5 Quantum Design USA) at room temperature.2.3. Preparation of the samples
2.4. Photodegradation of Orange II
The photocatalytic efficiencies of the samples that were prepared were evaluated using the samples to degrade Orange II in the presence of H2O2 and irradiated with visible light produced using a Xe light (500 W) with a 420 nm cut-off filter. For a degradation experiment, a 50 mg L−1 (the initial concentration, C0) stock solution (100 mL) of Orange II was placed in a glass beaker, then the catalyst being tested was added and the mixture was put in a dark place and constantly stirred using a magnetic stirrer for 30 min to allow absorption–desorption equilibrium to be reached. H2O2 (0.1 mL) was then added and the mixture was immediately irradiated with visible light. All the tests were performed at a constant temperature of 25 ± 0.2 °C, achieved using a water bath. A 3.0 mL aliquot of the solution was removed at each of a series of specified times, and absorbance at 484 nm was measured using a UV-visible spectrophotometer.2.5. Measurement of ˙OH
The formation of ˙OH was detected by the PL technique using COU as a probe molecule. Experimental procedures were as follows: 0.1 g of g-C3N4/α-Fe2O3/Fe3O4 composites was dispersed in 100 mL of 1 × 10⁻³ M COU aqueous solution in a glass beaker, then the solution was constantly stirred using a magnetic stirrer for 30 min to allow absorption–desorption equilibrium to be reached. H2O2 (0.1 mL) was then added and the mixture was immediately irradiated with visible light using a Xe light (500 W) with a 420 nm cut-off filter. All the tests were performed at a constant temperature of 25 ± 0.2 °C, achieved using a water bath. A 3.0 mL aliquot of the solution was removed at each of 15 min, and the reaction solution was filtrated to measure the PL intensity at 456 nm by an Agilent Technologies Cary Eclipse Fluorescence Spectrophotometer. The excitation wavelength was 332 nm, the scanning speed was 120 nm min−1. The width of excitation and emission slit was set to be both 5 nm.3. Results and discussion
The X-ray diffraction patterns of the g-C3N4, α-Fe2O3, Fe3O4, and g-C3N4/α-Fe2O3 materials and the g-C3N4/α-Fe2O3/Fe3O4 composites with different Fe3O4 contents are shown in Fig. 2a. The g-C3N4 gave a pronounced peak at 27.5° indexed as a (002) diffraction plane corresponding to the characteristic interlayer stacking peak of a conjugated aromatic system (JCPDS files no. 87-1526).34 The positions and relative intensities of all the diffraction peaks for the Fe3O4 sample matched the data for pure face-centered cubic Fe3O4, and the diffraction peaks in the range 30.6–63.2° were indexed as (220), (311), (400), (422), (511), and (440) reflections (JCPDS files no. 19-0629).35 Diffraction peaks were found for α-Fe2O3 at 24.2°, 33.3°, 35.7°, 40.9°, and 49.5°, and these were indexed as (012), (104), (110), (113), and (024) planes of α-Fe2O3, respectively (JCPDS files no. 33-0664).16 The g-C3N4/α-Fe2O3/Fe3O4 composite X-ray diffraction patterns contained the diffraction peaks for g-C3N4, α-Fe2O3, and Fe3O4, and the intensity of the Fe3O4 peak increased as the Fe3O4 weight percent increased. This suggested that the desired g-C3N4/α-Fe2O3/Fe3O4 composites were successfully prepared using the hydrothermal method.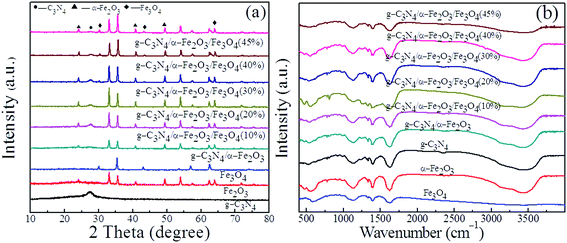 | ||
| Fig. 2 (a) XRD patterns and (b) FT-IR spectra of g-C3N4, Fe3O4, α-Fe2O3 and g-C3N4/α-Fe2O3/Fe3O4 samples. | ||
Fourier-transform infrared spectra were acquired to characterize the structural properties of the samples, and the results are shown in Fig. 2b. The g-C3N4 sample gave a broad band at 3400 cm−1 indicative of N–H stretching vibrations and a band in the range 1214–1634 cm−1 corresponding to heterocycle C–N and C![[double bond, length as m-dash]](https://www.rsc.org/images/entities/char_e001.gif) N stretching vibrations.36 A breathing mode at 806 cm−1 was related to typical s-triazine unit bending vibrations.37 The composites containing Fe3O4 and α-Fe2O3 had characteristic peaks at 470 and 560 cm−1 attributed to Fe–O stretching.38,39 It can be seen that the main characteristic peaks of g-C3N4, Fe3O4, and α-Fe2O3 were found in the g-C3N4/α-Fe2O3/Fe3O4 composite spectra, further demonstrating that α-Fe2O3 and Fe3O4 had been deposited on the surfaces of the g-C3N4 sheets.
N stretching vibrations.36 A breathing mode at 806 cm−1 was related to typical s-triazine unit bending vibrations.37 The composites containing Fe3O4 and α-Fe2O3 had characteristic peaks at 470 and 560 cm−1 attributed to Fe–O stretching.38,39 It can be seen that the main characteristic peaks of g-C3N4, Fe3O4, and α-Fe2O3 were found in the g-C3N4/α-Fe2O3/Fe3O4 composite spectra, further demonstrating that α-Fe2O3 and Fe3O4 had been deposited on the surfaces of the g-C3N4 sheets.
The morphologies of the samples and the ways in which the samples formed were investigated using scanning electron microscopy and transmission electron microscopy. Scanning electron microscopy images for g-C3N4, Fe3O4, and g-C3N4/α-Fe2O3/Fe3O4 (30%) are shown in Fig. 3a–c, respectively. The pristine g-C3N4 sample had a sheet-like structure. The Fe3O4 nanoparticles were nearly spherical. In contrast, the g-C3N4/α-Fe2O3/Fe3O4 composite produced using the 12 h hydrothermal reaction process was irregular and rough in shape because of the Fe3O4 and α-Fe2O3 deposited on the g-C3N4 surfaces. It can be seen from the transmission electron microscopy images shown in Fig. 3d and e that the pristine g-C3N4 had typical two-dimensional sheet-like nanosheets and that the Fe3O4 were very dispersible. It can clearly be seen from the g-C3N4/α-Fe2O3/Fe3O4 transmission electron microscopy image shown in Fig. 3f that Fe3O4 and α-Fe2O3 particles were uniformly distributed over the g-C3N4 sheet surfaces and a sandwich-like structure was formed. This unique architecture can greatly promote separation efficiency of electron–hole pairs. High resolution transmission electron microscopy (HRTEM) image of g-C3N4/α-Fe2O3/Fe3O4 is shown in Fig. 3g. It can be noted that there are two different lattice fringes on the surface of g-C3N4, the lattice fringe of 0.271 nm and 0.253 nm in the observed nanocrystallites agrees well with the (104) lattice planes of α-Fe2O3 and the (311) lattice planes of Fe3O4, respectively, which indicates the existence of the heterojunction structure between g-C3N4, α-Fe2O3 and Fe3O4.40,41
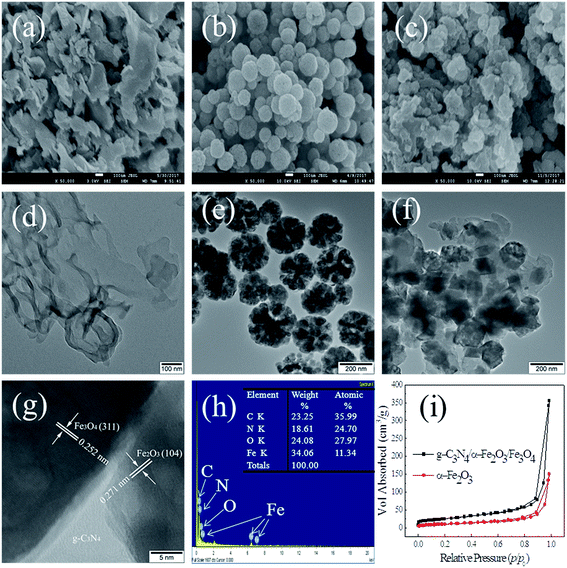 | ||
| Fig. 3 SEM (a–c), TEM (d–f), HRTEM (g), EDX (h), and N2 adsorption–desorption isotherm (i) of the samples. | ||
Energy dispersive spectroscopy was performed to determine the elemental composition of the g-C3N4/α-Fe2O3/Fe3O4 (30%) sample, and the results are shown in Fig. 3d. The peaks were ascribed to the elements C, N, O, and Fe and agreed with the X-ray diffraction patterns, further confirming the presence of g-C3N4, Fe3O4, and α-Fe2O3 particles in the composite. The specific surface areas of the α-Fe2O3 and the g-C3N4/α-Fe2O3/Fe3O4 (30%) composite were determined by acquiring N2 adsorption/desorption isotherms (Fig. 2h). Both samples gave type IV adsorption–desorption isotherms according to the Brunauer–Deming–Deming–Teller classification. Type IV adsorption–desorption isotherms are typical of materials with mesoporous domains. The BET surface area of g-C3N4/α-Fe2O3/Fe3O4 (30%) was 88.37 m2 g−1, which was much higher than the surface area of α-Fe2O3 (38.54 m2 g−1). Importantly, the pore volume was also higher for g-C3N4/α-Fe2O3/Fe3O4 (30%), at 0.55 cm3 g−1, than for α-Fe2O3 (0.23 cm3 g−1). The high pore volume of g-C3N4/α-Fe2O3/Fe3O4 (30%) would have facilitated charge separation in the composite system and made the composite suitable for heterogeneous photo-Fenton applications.24
It is well known that enhancing absorption in the visible-light region improves the activity of a photocatalyst. The UV-vis diffuse reflection spectra of α-Fe2O3, g-C3N4/α-Fe2O3, and g-C3N4/α-Fe2O3/Fe3O4 with different Fe3O4 weight percentages were acquired and are shown in Fig. 4a. α-Fe2O3 had an absorption threshold at 657 nm associated with a band gap energy of 1.9 eV, which agreed with the previously reported band gap energy.42 g-C3N4/α-Fe2O3 had an absorption threshold at 617 nm associated with a band gap energy of 2.01 eV, which was lower than the band gap energy of pure g-C3N4 (∼2.7 eV). The g-C3N4/α-Fe2O3/Fe3O4 (10%), g-C3N4/α-Fe2O3/Fe3O4 (30%), and g-C3N4/α-Fe2O3/Fe3O4 (45%) absorption thresholds were at 627, 661, and 669 nm, respectively, and the band gap energies were 1.98, 1.88, and 1.85 eV, respectively. These results indicate that the g-C3N4/α-Fe2O3/Fe3O4 composite absorption edge shifted to a longer wavelength and the ability to absorb visible light improved as the Fe3O4 to g-C3N4/α-Fe2O3 weight ratio increased. The increase in visible light absorption may have been caused by heterogeneous structures forming. The results imply that the response of the photocatalyst to visible light was improved by loading Fe3O4 and α-Fe2O3 onto the g-C3N4 sheets, which may have increased the photocatalytic activity by allowing more photogenerated charge carriers to be formed.
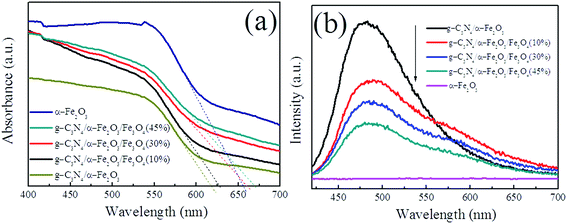 | ||
| Fig. 4 UV-vis DRS (a) and PL spectra (b) of α-Fe2O3, g-C3N4/α-Fe2O3, and g-C3N4/α-Fe2O3/Fe3O4 samples. | ||
The migration, transfer, and recombination processes for the photogenerated electron–hole pairs in the samples were investigated by acquiring room temperature PL spectra of α-Fe2O3, g-C3N4/α-Fe2O3, and the g-C3N4/α-Fe2O3/Fe3O4 composites. The spectra are shown in Fig. 4b. No obvious α-Fe2O3 emission peak was found because the α-Fe2O3 peak intensity was much weaker than the g-C3N4/α-Fe2O3 and g-C3N4/α-Fe2O3/Fe3O4 composite peak intensities.21 The main g-C3N4/α-Fe2O3 and g-C3N4/α-Fe2O3/Fe3O4 composite emission bands were centered on 480 nm, and the g-C3N4/α-Fe2O3/Fe3O4 composite emission peaks were much weaker than the pure g-C3N4/α-Fe2O3 emission peak, indicating that the recombination of photogenerated electron–hole pairs was efficiently hampered. The emission peak became weaker as the amount of Fe3O4 present increased, meaning the lifetimes of the photogenerated charge carriers would have increased as the amount of Fe3O4 present increased.
The photo-Fenton photocatalytic activities of α-Fe2O3, g-C3N4/α-Fe2O3, and g-C3N4/α-Fe2O3/Fe3O4 composites were determined using the catalysts to decompose Orange II when irradiated with visible light (λ > 420 nm). As shown in Fig. 5a, Orange II was degraded by each sample, and the photocatalytic activities of the composites were closely related to the compositions of the composites. All the g-C3N4/α-Fe2O3/Fe3O4 samples had stronger photocatalytic activities than did α-Fe2O3 and g-C3N4/α-Fe2O3. The enhanced photocatalytic activities of the composites could have been caused by the composites having higher surface areas, higher visible-light absorption capacities, and higher electron–hole separation efficiencies.
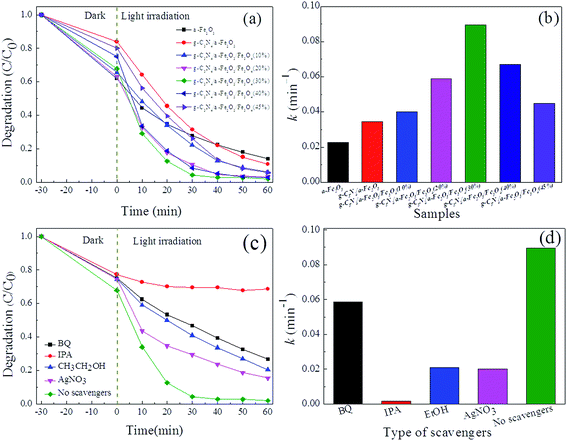 | ||
| Fig. 5 (a) Degradation rate and (b) kinetic constant of all samples, (c) degradation rate and (d) kinetic constant of g-C3N4/α-Fe2O3/Fe3O4 (30%) samples with different scavengers. | ||
The experimental data were analyzed to investigate the Orange II degradation kinetics, and it was found that a pseudo-first-order model fitted the data. The formula for the pseudo-first-order model is
| ln(c0/c) = kt, |
The reactive species trapping experiments were performed to evaluate role of the active species in the photocatalytic process. 1,4-Benzoquinone (BQ), isopropanol (IPA), ethanol (EtOH), and silver nitrate (AgNO3) were used to capture superoxide radicals (˙O2−), hydroxyl radicals (˙OH), holes (h+), and electrons (e−), respectively.44,45 The results of degradation rate and kinetic constant of g-C3N4/α-Fe2O3/Fe3O4 (30%) samples with different scavengers are shown in Fig. 5c and d. It can be seen that using IPA as a radical scavenger markedly decreased the degradation rate, indicating that ˙OH radicals were involved in the photocatalytic process. Likewise, using EtOH, BQ, and AgNO3 decreased the degradation rate to some extent, indicating that ˙O2−, h+, and e− also played roles in the photocatalytic process.
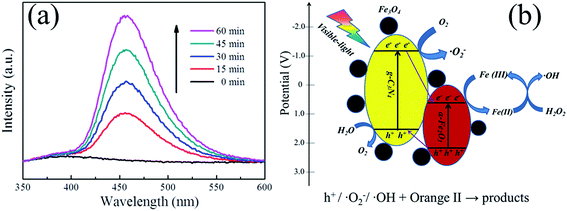
To further detect the formation of ˙OH in our visible-light-Fenton system, the PL technique was performed using COU as a probe molecule according to the published literatures.46,47 Because of COU can readily react with ˙OH to produce highly fluorescent product, 7-hydroxycoumarin (7HC), we can detect the formation of ˙OH by the PL spectra of 7HC in an aqueous solution containing g-C3N4/α-Fe2O3/Fe3O4 composite, COU and H2O2 under visible light irradiation. As shown in Fig. 6a, a gradual increase in the PL intensity at about 456 nm was observed with increasing irradiation time, which indicated that fluorescent product 7HC was formed during visible-light-Fenton process due to the specific reaction between ˙OH and COU. Thus, it could be inferred that the ˙OH is producing at the g-C3N4/α-Fe2O3/Fe3O4 composites surface, which is consistent with the results of reactive species trapping experiments.
The results described above led us to propose the catalytic mechanism for the g-C3N4/α-Fe2O3/Fe3O4 composite shown in Fig. 6b. There are five main possible aspects to the Orange II catalytic degradation process. (i) Both α-Fe2O3 and g-C3N4 can efficiently absorb visible light and form photogenerated electron–hole pairs (eqn (1)) because the g-C3N4 and α-Fe2O3 band gap energies are about 2.70 and 1.90 eV, respectively. (ii) The Fe(III) on the α-Fe2O3 surfaces may be reduced to Fe(II) by excited electrons, then Fe(II) could react with H2O2 to form the Fenton system, generating ˙HO radicals (eqn (3)). (iii) The g-C3N4 conduction band bottom level is more negative than the O2/˙O2− redox potential (−0.16 eV),48 so the photogenerated electrons in the g-C3N4 conduction band could react with O2 on the photocatalyst surfaces to form ˙O2− radicals (eqn (4)). (iv) The presence of heterojunctions between α-Fe2O3 and g-C3N4 may allow the holes generated in the α-Fe2O3 valence band to be transferred to the g-C3N4 valence band. The photogenerated holes could react with H2O to produce O2 (eqn (5)), and the O2 generated could react with electrons to generate ˙O2−. Likewise, the electrons generated in the g-C3N4 conduction band could be transferred to the α-Fe2O3 conduction band, reducing more Fe(III) to Fe(II) on the α-Fe2O3 surfaces, directly contributing to the production of ˙HO radicals.
The g-C3N4/α-Fe2O3/Fe3O4 catalyst also had a high surface area to which Orange II could adsorb, benefiting the degradation process. It is worth noting that the high conductivity of Fe3O4 will mean that some Fe3O4 between the α-Fe2O3 and g-C3N4 nanosheet interfaces could act as a medium for the transmission of electrons and holes between g-C3N4 and α-Fe2O3, strongly decreasing the probability that photogenerated electron–hole pairs in the g-C3N4/α-Fe2O3/Fe3O4 composite system will recombine. This will cause more electrons and holes to form active species that could be involved in the photodegradation of Orange II. This photo-Fenton system works through ˙OH, ˙O2−, and holes that all acting as reactive species (eqn (6)), significantly increasing the photocatalytic activity relative to a traditional Fenton system.
| g-C3N4/α-Fe2O3/Fe3O4 + hν → e− + h+ | (1) |
| Fe(III) + e− → Fe(II) | (2) |
| H2O2 + Fe(II) → Fe(III) + ˙OH + OH− | (3) |
| O2 + e− → ˙O2− | (4) |
| h+ + H2O → O2 | (5) |
| h+/˙O2−/˙OH + Orange II → products | (6) |
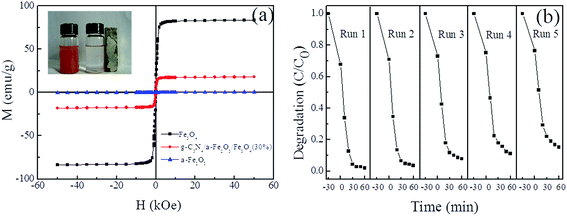
The magnetic properties of Fe2O3, Fe3O4 and the g-C3N4/α-Fe2O3/Fe3O4 composites were measured at room temperature, and the results are shown in Fig. 7a. The α-Fe2O3 magnetization curve showed that α-Fe2O3 was almost non-magnetic. Saturation magnetization for Fe3O4 and g-C3N4/α-Fe2O3/Fe3O4 was found at about 83.58 and 17.98 emu g−1, respectively. The saturated magnetization was lower for g-C3N4/α-Fe2O3/Fe3O4 than for the Fe3O4 nanoparticles because of the presence of nonmagnetic g-C3N4 and α-Fe2O3. Separation of the magnetic photocatalyst from a treated solution using a magnet is shown in the inset in Fig. 7a. We concluded that the nanocomposite was magnetic enough to allow the composite to be magnetically separated from a treated solution.
The reusability of a photocatalyst is an important parameter from the economic viewpoint. Recycling tests were conducted to investigate the stability of g-C3N4/α-Fe2O3/Fe3O4, and the results are shown in Fig. 7b. More than 85% of the original photocatalytic activity of g-C3N4/α-Fe2O3/Fe3O4 (30%) was retained after five successive experimental runs using the same experimental conditions. The photocatalytic activity may have decreased with repeated use because of photocorrosion of the nanocomposite. These results indicated that the g-C3N4/α-Fe2O3/Fe3O4 catalyst is quite stable and could be reused.
4. Conclusions
Magnetic heterogeneous g-C3N4/α-Fe2O3/Fe3O4 composites with different Fe3O4 mass percentages were successfully fabricated via a facile hydrothermal synthesis route. Combining the Fenton and photocatalytic processes in one reaction system gave the composite excellent catalytic activity. Of the samples that were prepared, g-C3N4/α-Fe2O3/Fe3O4 (30%) had the best catalytic activity. The enhanced photocatalytic activities could be ascribed to increases in the surface area, visible light absorption capacity, and electron–hole separation efficiency, leading to more h+ and e− being generated to participate in the degradation process. A possible catalytic mechanism for the g-C3N4/α-Fe2O3/Fe3O4 composite was proposed. This photo-Fenton system works through ˙OH, ˙O2−, and holes that all acting as reactive species, significantly increasing the photocatalytic activity relative to a traditional Fenton system. The g-C3N4/α-Fe2O3/Fe3O4 catalyst could be reused and was magnetic enough to be easily separated from a treated solution. The simply prepared magnetic heterogeneous composite was found to be an effective visible-light-driven photo-Fenton catalyst that may be useful in environmental applications.Conflicts of interest
The authors declare no competing financial interest.Acknowledgements
This work was supported by the National Science Foundation of China (Grant No. 61434002), the Special Funds of Sanjin Scholars Program.References
- H. Lin, H. Zhang, X. Wang, L. Wang and J. Wu, Sep. Purif. Technol., 2014, 122, 533–540 CrossRef CAS.
- M. A. Oturan and J.-J. Aaron, Crit. Rev. Environ. Sci. Technol., 2014, 44, 2577–2641 CrossRef CAS.
- L. Clarizia, D. Russo, I. Di Somma, R. Marotta and R. Andreozzi, Appl. Catal., B, 2017, 209, 358–371 CrossRef CAS.
- S. Rahim Pouran, A. R. Abdul Aziz and W. M. A. Wan Daud, J. Ind. Eng. Chem., 2015, 21, 53–69 CrossRef CAS.
- M. Sayed, J. A. Khan, L. A. Shah, N. S. Shah, F. Shah, H. M. Khan, P. Zhang and H. Arandiyan, J. Phys. Chem. C, 2017, 122, 406–421 Search PubMed.
- M. Sayed, L. A. Shah, J. A. Khan, N. S. Shah, J. Nisar, H. M. Khan, P. Zhang and A. R. Khan, J. Phys. Chem. A, 2016, 120, 9916–9931 CrossRef CAS PubMed.
- A. M. Khan, A. Mehmood, M. Sayed, M. F. Nazar, B. Ismail, R. A. Khan, H. Ullah, H. M. Abdur Rehman, A. Y. Khan and A. R. Khan, J. Mol. Liq., 2017, 236, 395–403 CrossRef CAS.
- H. Li, Y. Li, L. Xiang, Q. Huang, J. Qiu, H. Zhang, M. V. Sivaiah, F. Baron, J. Barrault, S. Petit and S. Valange, J. Hazard. Mater., 2015, 287, 32–41 CrossRef CAS PubMed.
- J. M. Monteagudo, A. Durán and C. López-Almodóvar, Appl. Catal., B, 2008, 83, 46–55 CrossRef CAS.
- A. Mirzaei, Z. Chen, F. Haghighat and L. Yerushalmi, Chemosphere, 2017, 174, 665–688 CrossRef CAS PubMed.
- X. Zhang, Y. Ding, H. Tang, X. Han, L. Zhu and N. Wang, Chem. Eng. J., 2014, 236, 251–262 CrossRef CAS.
- J. A. Khan, X. He, N. S. Shah, M. Sayed, H. M. Khan and D. D. Dionysiou, Chem. Eng. J., 2017, 325, 485–494 CrossRef CAS.
- D. B. Jiang, X. Liu, X. Xu and Y. X. Zhang, J. Phys. Chem. Solids, 2018, 112, 209–215 CrossRef CAS.
- L. Zhou, J. Lei, L. Wang, Y. Liu and J. Zhang, Appl. Catal., B, 2017 DOI:10.1016/j.apcatb.2017.08.039.
- J. Zhang, T. Yao, C. Guan, N. Zhang, H. Zhang, X. Zhang and J. Wu, J. Colloid Interface Sci., 2017, 505, 130–138 CrossRef CAS PubMed.
- Q. Tian, W. Wu, L. Sun, S. Yang, M. Lei, J. Zhou, Y. Liu, X. Xiao, F. Ren, C. Jiang and V. A. L. Roy, ACS Appl. Mater. Interfaces, 2014, 6, 13088–13097 CAS.
- L. Qin, M. Liu, Y. Wu, Z. Xu, X. Guo and G. Zhang, Appl. Catal., B, 2016, 194, 50–60 CrossRef CAS.
- B. Liu, L. Tian, R. Wang, J. Yang, R. Guan and X. Chen, Appl. Surf. Sci., 2017, 422, 607–615 CrossRef CAS.
- S. Guo, G. Zhang, Y. Guo and J. C. Yu, Carbon, 2013, 60, 437–444 CrossRef CAS.
- D. Bi and Y. Xu, Langmuir, 2011, 27, 9359–9366 CrossRef CAS PubMed.
- D. Xiao, K. Dai, Y. Qu, Y. Yin and H. Chen, Appl. Surf. Sci., 2015, 358, 181–187 CrossRef CAS.
- S. Hu, R. Jin, G. Lu, D. Liu and J. Gui, RSC Adv., 2014, 4, 24863 RSC.
- A. Akhundi and A. Habibi-Yangjeh, Ceram. Int., 2015, 41, 5634–5643 CrossRef CAS.
- S. Kumar, S. T, B. Kumar, A. Baruah and V. Shanker, J. Phys. Chem. C, 2013, 117, 26135–26143 CAS.
- D. Zhu, S. Liu, M. Chen, J. Zhang and X. Wang, Colloids Surf., A, 2018, 537, 372–382 CrossRef CAS.
- D. Zhang, S. Cui and J. Yang, J. Alloys Compd., 2017, 708, 1141–1149 CrossRef CAS.
- J. Wang, Y. Chen, G. Liu and Y. Cao, Composites, Part B, 2017, 114, 211–222 CrossRef CAS.
- R. Nagarjuna, S. Challagulla, R. Ganesan and S. Roy, Chem. Eng. J., 2017, 308, 59–66 CrossRef CAS.
- S. Hu, W. Ouyang, L. Guo, Z. Lin, X. Jiang, B. Qiu and G. Chen, Biosens. Bioelectron., 2017, 92, 718–723 CrossRef CAS PubMed.
- M. Zhang and X. Wang, Energy Environ. Sci., 2014, 7, 1902 CAS.
- N. Gao, H. Wu, Y. Chang, X. Guo, L. Zhang, L. Du and Y. Fu, Spectrochim. Acta, Part A, 2015, 134, 10–16 CrossRef CAS PubMed.
- Y.-P. Sun, X.-q. Li, J. Cao, W.-x. Zhang and H. P. Wang, Adv. Colloid Interface Sci., 2006, 120, 47–56 CrossRef CAS PubMed.
- C. Cai, Z. Zhang, J. Liu, N. Shan, H. Zhang and D. D. Dionysiou, Appl. Catal., B, 2016, 182, 456–468 CrossRef CAS.
- X. Zhou, B. Jin, R. Chen, F. Peng and Y. Fang, Mater. Res. Bull., 2013, 48, 1447–1452 CrossRef CAS.
- X. Li, X. Huang, D. Liu, X. Wang, S. Song, L. Zhou and H. Zhang, J. Phys. Chem. C, 2011, 115, 21567–21573 CAS.
- E. S. Baeissa, Frontiers in Nanoscience and Nanotechnology, 2016, 2, 100–106 CrossRef.
- M. Mousavi and A. Habibi-Yangjeh, J. Colloid Interface Sci., 2016, 465, 83–92 CrossRef CAS PubMed.
- X. Zhang, S. Lin, Z. Chen, M. Megharaj and R. Naidu, Water Res., 2011, 45, 3481–3488 CrossRef CAS PubMed.
- T. Wang, X. Jin, Z. Chen, M. Megharaj and R. Naidu, Sci. Total Environ., 2014, 466–467, 210–213 CrossRef CAS PubMed.
- B. Jia, L. Gao and J. Sun, J. Am. Ceram. Soc., 2007, 90, 1315–1318 CrossRef CAS.
- P. Liu, Q. Xu, D. Gao, S. Shi and B. Xia, Journal of Advances in Nanomaterials, 2017 DOI:10.22606/jan.2017.21002.
- Y. Cui, J. Briscoe, Y. Wang, N. V. Tarakina and S. Dunn, ACS Appl. Mater. Interfaces, 2017, 9, 24518–24526 CAS.
- S. Chi, C. Ji, S. Sun, H. Jiang, R. Qu and C. Sun, Ind. Eng. Chem. Res., 2016, 55, 12060–12067 CrossRef CAS.
- E. Cheng, S. Zhou, M. Li and Z. Li, Appl. Surf. Sci., 2017, 410, 383–392 CrossRef CAS.
- W. J. Kim, E. Jang and T. J. Park, Appl. Surf. Sci., 2017, 419, 159–164 CrossRef CAS.
- K.-i. Ishibashi, A. Fujishima, T. Watanabe and K. Hashimoto, Electrochem. Commun., 2000, 2, 207–210 CrossRef CAS.
- Q. Xiang, J. Yu and P. K. Wong, J. Colloid Interface Sci., 2011, 357, 163–167 CrossRef CAS PubMed.
- F. Dong, L. Wu, Y. Sun, M. Fu, Z. Wu and S. C. Lee, J. Mater. Chem., 2011, 21, 15171–15174 RSC.
| This journal is © The Royal Society of Chemistry 2018 |

