 Open Access Article
Comparison of two online extraction systems and development of the online SPE-HPLC-DAD method to simultaneously determine ten β-amino alcohol drugs in plasma†
Man Wang ab,
Lei Liua,
Zheng Yinab and
Yaxin Lu*ab
aCollege of Pharmacy, Nankai University, Tianjin 300071, PR China. E-mail: yaxinlu@nankai.edu.cn
bState Key Laboratory of Medicinal Chemical Biology, Nankai University, Tianjin 300071, PR China
First published on 5th February 2018
Abstract
For the chromatographic analysis of biological samples, sample preparation requires efficient matrix removal and retention of the analytes. The development of online pretreatment technologies provides a fully automated solution for biological sample analysis. Online pretreatment solutions improve both throughput and precision. In this study, we compared two online extraction systems, an online solid-phase extraction (SPE) system and an online turbulent flow chromatography (TFC) extraction system, which are being applied by more analysts at present. The comparison showed that the TFC extraction produced better matrix removal effects, while, peak analysis showed that the online SPE system had obvious advantages in peak shape and efficiency. Thus, we developed an automated online SPE-high performance liquid chromatography (HPLC)-diode array detector (DAD) method for the simultaneous determination of ten β-amino alcohols. The results provide a reference for analysts to choose an appropriate online pretreatment method and provide a solution for biological sample analysis of β-amino alcohol drugs.
Introduction
Due to the complex matrix in biological samples, matrix removal and analyte extraction are always important for chromatographic analysis. Conventional extraction techniques mainly include protein precipitation (PPT),1 liquid–liquid extraction (LLE)2 and off-line SPE methods.3 However, these manual operations are prone to human error and are time-consuming, which significantly affects the throughput and reproducibility of the process.4 Sample pretreatment is the labor-intensive, time-limiting step in bioanalytical processes, typically taking 80% of the total analysis time and involving intensive manual processing.5An online preparation method, such as direct detection using probe electrospray ionization mass spectrometry6–8 and online extraction methods, could overcome the shortcomings mentioned above to a great extent. The most commonly used online extraction methods are based on solid phase extraction9–12 and turbulent flow chromatography.13–15 The fully automated online SPE-HPLC technique, which instrumentally integrates the biological fluids clean-up process with bioanalysis, has been widely applied to remove interfering matrix substances. Turbulent flow chromatography (TFC) was introduced in the late 1990s as a technique for direct injection of biological fluids into a column.16 Under turbulent flow conditions, small molecules in solution diffuse more extensively into the pores of particles than large molecules, leading to the separation of substances by size.17 With the advantage of automation, this technique has been used for high throughput sample preparation to detect various analytes in complex samples.18–20
Both of these online preparation methods are increasingly being used for biological sample analysis, but no comparative analysis of the two online pretreatment systems is available to provide a reference to aid analysts' selection. Hence, we evaluated two different online systems, Turboflow and online SPE, for the extraction of samples and comparied several parameters such as matrix removal effects and peak analysis. To obtain a more representative result, we chose a series of β-amino alcohols with different polarities as the target analytes. After comparison, we selected the online SPE-HPLC-DAD system for method validation. Our lab has previously reported an HPLC-mass spectrometry method for the simultaneous determination of a broad range of cardiovascular drugs in plasma.21 In this study, we made a few modifications to the compounds selection and detector, adding a more polar compound, adrenaline, which increased the difficulty of online extraction and simultaneous detection, and replacing mass spectrometry was with DAD for more convenient application, as DAD is a cheaper detector, which is still widely used in hospitals in China. We provide a DAD method enabling laboratories and hospitals without MS to conduct biological sample analysis.
Experimental
Reagents and materials
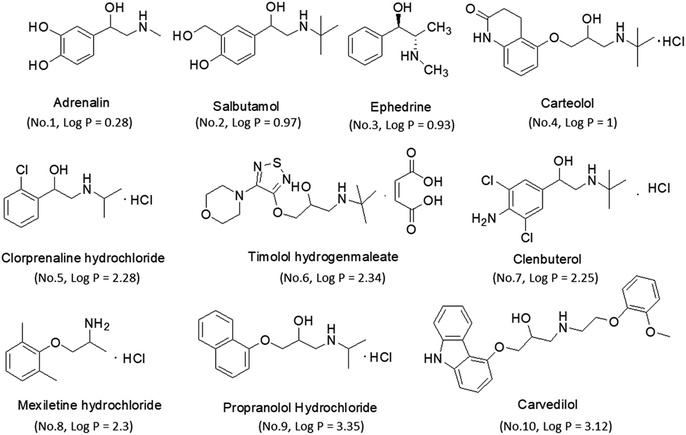
Reference standards of adrenaline, salbutamol, timolol, carteolol, ephedrine, mexiletine, clorprenaline, clenbuterol, propranolol and carvedilol were purchased from the National Institutes of Food and Drug Control (Beijing, China). Their chemical structures and physicochemical parameters are shown in Fig. 1. Analytical purity sodium dihydrogen phosphate and hydrochloric acid were obtained from Tianjin Chemical Reagents Company (Tianjin, China). HPLC grade acetonitrile (ACN) and water were obtained from Tedia Company, Inc. (Fairfield, USA).Plasma
Drug-free heparinized rat plasma was collected from male Sprague-Dawley rats (body weight: 220–250 g) obtained from the Laboratory Animal Center, Academy of Military Medical Science (Beijing, China). The animal facilities and protocols were approved by the Institutional Animal Care and Use Committee of Nankai University. All procedures were carried out in accordance with the Guidelines for Animal Experimentation of Nankai University (Tianjin, China).Preparation of calibration work solutions and quality control samples
The stock solutions of all drugs were prepared at a concentration of 1.00 mg mL−1 with ACN/water (1![[thin space (1/6-em)]](https://www.rsc.org/images/entities/char_2009.gif) :
:![[thin space (1/6-em)]](https://www.rsc.org/images/entities/char_2009.gif) 1, v/v) and stored at 4 °C. The solutions of standards and quality controls were diluted with blank plasma (10
1, v/v) and stored at 4 °C. The solutions of standards and quality controls were diluted with blank plasma (10![[thin space (1/6-em)]](https://www.rsc.org/images/entities/char_2009.gif) :
:![[thin space (1/6-em)]](https://www.rsc.org/images/entities/char_2009.gif) 90, v/v) to prepare a series of samples with different concentrations ranging from 10 ng mL−1 to 2560 ng mL−1. Quality control (QC) samples including solutions for the lower limit of quantification (LLOQ), limit of detection (LOD), QC low (QCL), QC middle (QCM) and QC high (QCH) of 40, 160 and 1280 ng mL−1 were prepared for validating the method. All of the work solutions were freshly diluted when used.
90, v/v) to prepare a series of samples with different concentrations ranging from 10 ng mL−1 to 2560 ng mL−1. Quality control (QC) samples including solutions for the lower limit of quantification (LLOQ), limit of detection (LOD), QC low (QCL), QC middle (QCM) and QC high (QCH) of 40, 160 and 1280 ng mL−1 were prepared for validating the method. All of the work solutions were freshly diluted when used.
Online SPE-HPLC method
Online SPE and HPLC analysis were carried out using an UltiMate 3000 Dual-Gradient HPLC system (Sunnyvale, CA, USA) equipped with two ternary pumps, a vacuum degasser, an autosampler and a thermostatted column compartment with a six-way valve. The online SPE column was a CAPCELL PAK MF Ph-1 column (4.0 × 10 mm, Shiseido, Japan) and the analytical column was a Venusil MP C18 column (5 μm, 4.6 × 150 mm, Agela Technologies, China).The online pretreatment and separation were accomplished by three steps, including a loading phase, a washing phase and an elution phase, as reported before.22 The loading and washing time was 1 min, and the elution time was 9 min at a flow rate of 1 mL min−1. The mobile phases and gradient are shown in Fig. 2 and Table S1.†
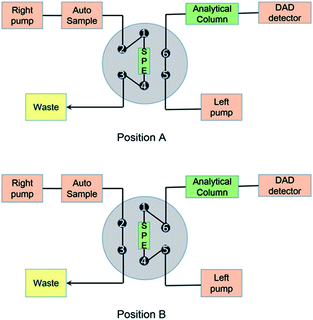 | ||
| Fig. 2 Schematic diagram of the online SPE/TFC-HPLC-DAD system.22 | ||
Online TFC-HPLC method
For the online TFC-HPLC method, the same instruments were used as in the online SPE-HPLC method, except the SPE column was replaced by a TurboFlow HTLC C18-P XL column (1.0 × 5.0 mm, Thermo Scientific, USA). The flow rate was increased for TFC extraction and the details are shown in Fig. 2 and Table S2.†Statistical analysis
We conducted a t-test with Microsoft Excel, setting the conditions for a one-tailed, paired test. When the p value <0.05, the difference was considered significant.Results and discussions
The comparison of the two pretreatment systems
![[thin space (1/6-em)]](https://www.rsc.org/images/entities/char_2009.gif) P ≤ 0.28.
P ≤ 0.28.| R = 2(tR2 − tR1)/(W1 + W2) | (1) |
To characterize the peak asymmetry, the tailing factor (T) was calculated as below:23
| T = W0.05h/2d1 | (2) |
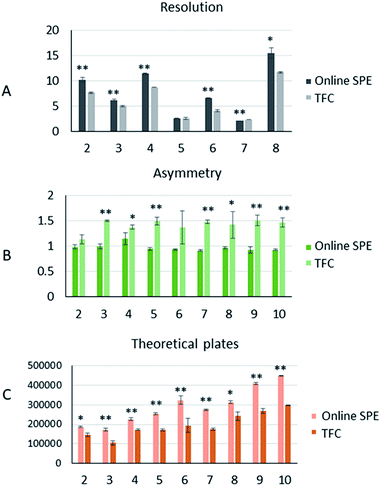
The number of theoretical plates is an important parameter for evaluating the separation performance of a chromatographic system. As the same analytical column was used for both, the comparison of theoretical plates could reflect the efficiency of the two different pretreatment systems. The theoretical plates (n) were calculated as below:23
| n = 16(tR/W)2 | (3) |
Method validation
Based on the comparison of retention abilities and peak analysis, we performed a method validation of the online SPE-HPLC-DAD method.![[thin space (1/6-em)]](https://www.rsc.org/images/entities/char_2009.gif) :
:![[thin space (1/6-em)]](https://www.rsc.org/images/entities/char_2009.gif) 1, v/v) for online SPE HPLC-DAD analysis. The set 2 samples were prepared using the mobile phase containing different QC solution levels. The set 2 samples were analyzed directly by HPLC-DAD. The extraction recoveries were determined by comparing the mean response of the set 1 samples to that of the set 2 samples at each QC level. The extraction recoveries of the QC samples are presented in Table S3.† According to the guidance of the U.S. Food and Drug Administration, the recovery of the analyte should be precise and reproducible.25 The extraction recoveries at different concentrations ranged from 92.38% to 98.53% and the RSDs of the recoveries ranged from 3.43% to 5.79%.
1, v/v) for online SPE HPLC-DAD analysis. The set 2 samples were prepared using the mobile phase containing different QC solution levels. The set 2 samples were analyzed directly by HPLC-DAD. The extraction recoveries were determined by comparing the mean response of the set 1 samples to that of the set 2 samples at each QC level. The extraction recoveries of the QC samples are presented in Table S3.† According to the guidance of the U.S. Food and Drug Administration, the recovery of the analyte should be precise and reproducible.25 The extraction recoveries at different concentrations ranged from 92.38% to 98.53% and the RSDs of the recoveries ranged from 3.43% to 5.79%.![[thin space (1/6-em)]](https://www.rsc.org/images/entities/char_2009.gif) :
:![[thin space (1/6-em)]](https://www.rsc.org/images/entities/char_2009.gif) 1, adequate precision with a coefficient of variation (CV) less than 20% and trueness within 20% of the nominal value (i.e., trueness between 80 and 120%) for each analysis run.18 The LOD is the minimum concentration of the sample at which the S/N is not less than 3. The LLOQ and LOD of each drug is shown in Table 1. The standard calibration curves were constructed using the peak area of each analyte versus the nominal concentrations of the eight plasma standards. Five standard curves were conducted for each drug in parallel. Linear least-square regression analysis, with a weighting factor of 1/x2, was performed to assess the linearity, as well as to generate the standard calibration equation: y = ax + b, where y is the peak area, x is the concentration, a is the slope and b is the intercept of the regression line. The method was linear over the concentration range of each analyte (r > 0.99). The mean values of the linear regression equation for each of the analytes are listed in Table 1.
1, adequate precision with a coefficient of variation (CV) less than 20% and trueness within 20% of the nominal value (i.e., trueness between 80 and 120%) for each analysis run.18 The LOD is the minimum concentration of the sample at which the S/N is not less than 3. The LLOQ and LOD of each drug is shown in Table 1. The standard calibration curves were constructed using the peak area of each analyte versus the nominal concentrations of the eight plasma standards. Five standard curves were conducted for each drug in parallel. Linear least-square regression analysis, with a weighting factor of 1/x2, was performed to assess the linearity, as well as to generate the standard calibration equation: y = ax + b, where y is the peak area, x is the concentration, a is the slope and b is the intercept of the regression line. The method was linear over the concentration range of each analyte (r > 0.99). The mean values of the linear regression equation for each of the analytes are listed in Table 1.
| Analyte | LOD (ng mL−1) | LOQ (ng mL−1) | Linear range (ng mL−1) | Slope (×104) | Intercept (×103) | R2 | |||
|---|---|---|---|---|---|---|---|---|---|
| Mean | SD | Mean | SD | Mean | SD | ||||
| 1 | 10 | 40 | 40–2560 | 13.3 | 4.0 | −42.1 | 8.6 | 0.9966 | 0.0051 |
| 2 | 5 | 20 | 20–2560 | 16.0 | 2.6 | 30.2 | 5.0 | 0.9960 | 0.0031 |
| 3 | 2.5 | 10 | 10–2560 | 51.7 | 2.9 | −23.4 | 6.1 | 0.9995 | 0.0007 |
| 4 | 2.5 | 10 | 10–2560 | 93.0 | 2.6 | −1.9 | 0.4 | 0.9999 | 0.0001 |
| 5 | 5 | 20 | 20–2560 | 44.3 | 1.5 | −15.6 | 2.7 | 0.9999 | 0.0002 |
| 6 | 10 | 40 | 40–2560 | 8.7 | 0.6 | 7.9 | 0.4 | 0.9983 | 0.0018 |
| 7 | 5 | 20 | 20–2560 | 93.3 | 3.2 | −193.8 | 20.1 | 0.9998 | 0.0001 |
| 8 | 10 | 40 | 40–2560 | 41.7 | 2.1 | 59.8 | 5.6 | 0.9994 | 0.0008 |
| 9 | 10 | 40 | 40–2560 | 85.3 | 5.1 | −273.6 | 50.6 | 0.9996 | 0.0002 |
| 10 | 10 | 40 | 40–2560 | 34.3 | 4.7 | 52.6 | 1.7 | 0.9992 | 0.0006 |
| Analyte | Nominal Conc. (ng mL−1) | Intra-day | Inter-day | ||||||
|---|---|---|---|---|---|---|---|---|---|
| Conc. found (ng mL−1) | Trueness (%) | RSD (%) | Conc. found (ng mL−1) | Trueness (%) | RSD (%) | ||||
| Mean | SD | Mean | SD | ||||||
| 1 | 40 | 41.8 | 1.1 | 104.6 | 2.5 | 41.9 | 3.8 | 104.7 | 9.1 |
| 160 | 174.4 | 8.2 | 109.0 | 4.7 | 149.1 | 27.5 | 93.2 | 8.4 | |
| 1280 | 1298.8 | 47.6 | 101.5 | 3.7 | 1215.9 | 113.4 | 95.0 | 9.3 | |
| 2 | 40 | 41.6 | 2.7 | 104.0 | 6.6 | 39.5 | 2.9 | 98.8 | 7.4 |
| 160 | 176.5 | 9.0 | 110.3 | 5.1 | 171.6 | 15.9 | 107.3 | 9.3 | |
| 1280 | 1398.5 | 23.7 | 109.3 | 1.7 | 1417.7 | 58.2 | 110.8 | 4.1 | |
| 3 | 40 | 44.5 | 1.1 | 111.3 | 2.5 | 42.3 | 2.5 | 105.9 | 5.9 |
| 160 | 175.4 | 8.6 | 109.7 | 4.9 | 172.7 | 15.6 | 107.9 | 9.0 | |
| 1280 | 1302.4 | 21.0 | 101.8 | 1.6 | 1379.3 | 106.8 | 107.8 | 7.7 | |
| 4 | 40 | 42.7 | 1.2 | 106.9 | 2.9 | 40.6 | 1.4 | 101.6 | 5.9 |
| 160 | 164.9 | 7.5 | 103.1 | 4.5 | 167.2 | 14.8 | 104.5 | 8.8 | |
| 1280 | 1286.8 | 22.0 | 100.5 | 1.7 | 1376.6 | 121.8 | 107.5 | 8.8 | |
| 5 | 40 | 42.9 | 1.0 | 107.2 | 2.4 | 41.4 | 1.8 | 103.4 | 4.3 |
| 160 | 162.4 | 9.2 | 101.5 | 5.7 | 165.1 | 15.1 | 103.2 | 9.1 | |
| 1280 | 1288.7 | 19.3 | 100.7 | 1.5 | 1373.5 | 116.3 | 107.3 | 8.5 | |
| 6 | 40 | 43.1 | 1.4 | 107.7 | 3.2 | 41.1 | 2.5 | 102.6 | 6.0 |
| 160 | 156.4 | 7.3 | 97.8 | 4.6 | 163.4 | 16.8 | 102.1 | 10.3 | |
| 1280 | 1229.8 | 36.4 | 96.1 | 3.0 | 1343.1 | 146.3 | 104.9 | 10.9 | |
| 7 | 40 | 44.1 | 2.1 | 110.2 | 4.6 | 42.7 | 2.0 | 106.7 | 4.7 |
| 160 | 161.7 | 7.2 | 101.1 | 4.5 | 166.6 | 15.6 | 104.2 | 9.4 | |
| 1280 | 1290.1 | 20.1 | 100.8 | 1.6 | 1378.7 | 118.9 | 107.7 | 8.6 | |
| 8 | 40 | 40.3 | 3.5 | 100.7 | 8.6 | 43.2 | 3.9 | 108.0 | 9.0 |
| 160 | 155.9 | 6.6 | 97.5 | 4.3 | 158.6 | 15.4 | 99.2 | 9.7 | |
| 1280 | 1257.7 | 17.8 | 98.3 | 1.4 | 1342.0 | 122.1 | 104.8 | 9.1 | |
| 9 | 40 | 42.4 | 6.7 | 106.0 | 15.9 | 41.8 | 4.6 | 104.4 | 10.9 |
| 160 | 162.1 | 4.7 | 101.3 | 2.9 | 166.3 | 14.6 | 103.9 | 8.8 | |
| 1280 | 1284.1 | 33.1 | 100.3 | 2.6 | 1382.9 | 135.2 | 108.0 | 9.8 | |
| 10 | 40 | 36.0 | 4.3 | 90.0 | 13.2 | 35.4 | 5.4 | 88.4 | 11.3 |
| 160 | 170.6 | 9.7 | 106.6 | 5.7 | 165.7 | 17.2 | 103.6 | 10.4 | |
| 1280 | 1411.6 | 69.5 | 110.2 | 4.6 | 1460.5 | 100.7 | 114.1 | 6.9 | |
Conclusions
Using a series of plasma samples of drugs with different polarities, we conducted a multi-aspect comparison of two online extraction systems. From the results, the online TFC extraction system showed better matrix removal effects. Thus, it may be a more appropriate option for detectors sensitive to matrix interference, such as mass spectrometry. The comparison of retention ability and peak analysis revealed that the online SPE extraction system had significant advantages in retaining more polar compounds and in separation efficiency, as well as in peak shape. These advantages helped improve the signals of drugs and the limit of quantification. Therefore, the online SPE extraction system was more suitable for the DAD detector, whose sensitivity was worse than that of mass spectrum. Finally, we established an online SPE-HPLC-DAD method for simultaneous quantitation of ten β-amino alcohols and performed method validation. Compared to mass spectrum, the DAD detector was easier to use and had a wider quantitative linear range than mass spectrum.21 In conclusion, our comparison of the two online pretreatment systems provides researchers a reference to choose the appropriate method based on the analyte polarity and detector used. The bioanalytical method for simultaneous determination of ten β-amino alcohols may provide a solution for therapeutic drug monitoring.Conflicts of interest
There are no conflicts to declare.Acknowledgements
This work was supported by the National Basic Research Program of China (973 program, Grant No. 2013CB911104, 2013CB911100), the National Natural Science Foundation of China (Grant No. 21672115, 21572116), the “111” Project of the Ministry of Education of China (Project No. B06005), and the Natural Science Foundation of Tianjin (Project No. 17JCYBJC28800).References
- J. He, W.-b. Li and C.-j. Ruan, Acta Pharmacol. Sin., 2013, 34, 140–141 Search PubMed.
- A. Mustafa and C. Turner, Anal. Chim. Acta, 2011, 703, 8–18 CrossRef CAS PubMed.
- S. C. Cobzac and S. Gocan, J. Liq. Chromatogr. Relat. Technol., 2011, 34, 1157–1267 CrossRef CAS.
- W. Xie, C. M. Chavez-Eng, W. Fang, M. L. Constanzer, B. K. Matuszewski, W. M. Mullett and J. Pawliszyn, J. Chromatogr. B: Anal. Technol. Biomed. Life Sci., 2011, 879, 1457–1466 CrossRef CAS PubMed.
- H. Ktaoka and K. Saito, J. Pharm. Biomed. Anal., 2011, 54, 926–950 CrossRef PubMed.
- S. Saha, L. C. Chen, M. K. Mandal and K. Hiraoka, J. Am. Soc. Mass Spectrom., 2013, 24, 341–347 CrossRef CAS PubMed.
- S. Saha, M. K. Mandal, L. C. Chen, S. Ninomiya, Y. Shida and K. Hiraoka, Mass Spectrosc., 2013, 2, S0008 Search PubMed.
- S. Saha, M. K. Mandal, H. Nonami and K. Hiraoka, Anal. Chim. Acta, 2014, 839, 1–7 CrossRef CAS PubMed.
- L. Liu, K. N. Liu, Y. B. Wen, H. W. Zhang, Y. X. Lu and Z. Yin, J. Chromatogr. B: Anal. Technol. Biomed. Life Sci., 2012, 893, 21–28 Search PubMed.
- Z. León, A. Chisvert, A. Balaguer and A. Salvador, Anal. Chim. Acta, 2010, 664, 178–184 CrossRef PubMed.
- J. R. Griffiths, S. Perkins, Y. Connolly, L. Zhang, M. Holland, V. Barattini, L. Pereira, A. Edge, H. Ritchie and D. L. Smith, J. Chromatogr. A, 2012, 1232, 276–280 CrossRef CAS PubMed.
- J. M. Zhang, W. S. Lin, X. N. Li, N. Yu, X. M. Ling, G. Fu, R. T. Li and J. R. Cui, J. Sep. Sci., 2012, 35, 721–725 CrossRef CAS PubMed.
- C. Chassaing, H. Stafford, J. Luckwell, A. Wright and A. Edgington, Chromatographia, 2005, 62, 17–24 CAS.
- D. Zimmer, V. Pickard, W. Czembor and C. Muller, J. Chromatogr. A, 1999, 854, 23–35 CrossRef CAS PubMed.
- L. Couchman, Biomed. Chromatogr., 2012, 26, 892–905 CAS.
- H. M. Quinn and J. J. Takarewski, Int. Pat., WO97/16724, 1997.
- P. J. Rudewicz, Bioanalysis, 2011, 3, 1663–1671 CrossRef CAS PubMed.
- D. Molins-Delgado, M. D. M. Olmo-Campos, G. Valeta-Juan, V. Pleguezuelos-Hernandez, D. Barcelo and M. S. Diaz-Cruz, Environ. Res., 2018, 161, 532–539 CrossRef CAS PubMed.
- M. Lopez-Garcia, R. Romero-Gonzalez, M. Lacasana and A. Garrido Frenich, J. Pharm. Biomed. Anal., 2017, 146, 378–386 CrossRef CAS PubMed.
- H. D. Shin, J. H. Suh, J. Kim, H.-D. Cho, S. D. Lee, K. S. Han, Y. Wang and S. B. Han, J. Pharm. Biomed. Anal., 2017, 145, 46–51 CrossRef CAS PubMed.
- L. Liu, Y. B. Wen, K. N. Liu, L. Sun, Y. X. Lu and Z. Yin, RSC Adv., 2014, 4, 19629–19639 RSC.
- M. Wang, Y.-B. Wen, K. N. Liu, G. Si, L. Liu, Z. Yin and Y. X. Lu, Chin. J. Anal. Chem., 2014, 42, 1729–1733 CAS.
- Chinese Pharmacopoeia CommissionChinese Pharmacopoeua (two), 2010, appendix V, pp. 29–31 Search PubMed.
- B. K. Matuszewski, M. L. Constanzer and C. M. Chavez-Eng, Anal. Chem., 2003, 75, 3019–3030 CrossRef CAS PubMed.
- https://www.fda.gov/downloads/Drugs/GuidanceComplianceRegulatoryInformation/Guidances/UCM070107.pdf.
Footnote |
| † Electronic supplementary information (ESI) available. See DOI: 10.1039/c7ra13276j |
| This journal is © The Royal Society of Chemistry 2018 |

