
 Open Access Article
 This Open Access Article is licensed under a
 Creative Commons Attribution 3.0 Unported Licence
Stability and electronic structure of hydrogen vacancies in ADP: hybrid DFT with vdW correction
Tingting Sui,
Yafei Lian,
Mingxia Xu,
Lisong Zhang,
Yanlu Li *,
Xian Zhao and
Xun Sun*
*,
Xian Zhao and
Xun Sun*
State Key Laboratory of Crystal Materials, Shandong University, Jinan 250100, China. E-mail: liyanlu@sdu.edu.cn; sunxun@sdu.edu.cn
First published on 12th February 2018
Abstract
The formation energies, charge transition levels, and electronic structures of positively charged, neutral, and negatively charged hydrogen vacancies in the NH4H2PO4 (ADP) crystal are investigated in the framework of density functional theory with local and hybrid exchange–correlation functionals. The inclusion of nonlocal exchange opens the ADP fundamental band gap by nearly 1 eV and well reproduces the experimental value. The van der Waals (vdW) interaction is found to have a major influence on the energetics of charged hydrogen vacancies in ADP. The calculated relative stability of  and
and  with vdW interaction could well explain the break point on the measured conductivity curve of the ADP crystal in the high temperature region. On the other hand, a missing H atom in the (H2PO4)− group is found to be more energetically preferable than NH4+. It could capture a hole carrier to form a molecular-type polaron with its adjacent two O atoms, and be responsible for the optical absorption under irradiation by a high-intensity laser beam.
1. Introduction
The ammonium dihydrogen phosphate (NH4H2PO4, ADP) crystal is one of the promising materials exploited in nonlinear optical and electro-optic fields, which has been widely used in high power laser systems, realizing second, third and fourth harmonic generation.1–4 As compared to its analogue potassium dihydrogen phosphate (KH2PO4, KDP), ADP exhibits a higher laser damage threshold (LDT) and larger nonlinear optical (NLO) coefficient than KDP, and can thus be treated as a promising alternative material to break the present KDP monopoly of Inertial Confinement Fusion (ICF) applications.Much experimental work has been reported on the crystal growth, morphology, structure analysis and the optical performance of ADP crystals.5–13 For example, the morphology of tetragonal bipyramid for ADP and its nature crystal structure have been defined by Xu Dongli et al.14 Moreover, Zhao et al. studied the crystallization mechanism of ADP, which was regarded as the process related to bond formation and breaking, connecting structure, growth morphology and microscopic chemical bonds.15 With in situ ATR-IR spectroscopy, the hydrogen bonding of NH4+ and (H2PO4)− groups during ADP crystallization as well as the difference with that in its aqueous solution were reported recently.16 In 2016, series of ADP crystals have been grown under different experimental conditions and all the crystals were found to exhibit higher LDT than KDP.4 On the other hand, some theoretical work have also been done regarding to the chemical bonding, crystal structure, and physical properties of ADP crystals under ideal environment. For instance, the morphology of ADP crystals were modelled based on the calculation of chemical bond strength and the interaction between crystal surfaces.17,18 The density functional theory (DFT) calculation was carried out to present the microscopic mechanism of antiferroelectricity in ADP crystal.19
It is noted that the LDT of ADP could be reduced due to the existence of intrinsic point defects in the crystal. Many experimental efforts have been made to detect the defects in the crystal. In Murphy's research, there is an inflection point on the conductivity curve between the low and high temperature areas, which can be used to characterize the formation energy and diffusion of the defect.20 As Pollock didn't find such inflection point, he proposed that the defect formation and diffusion is a process in ADP crystal.21 Later, Harris proved that the proton vacancy in NH4+ contributes to the electric conduction of ADP.22 Rath further illustrated the impact of impurity and hydrogen vacancy on the conductivity and dielectric loss of doped ADP crystals.23 Also, Abdel-Kader regarded the inflection point as the relative rotary movement of phosphate group with its surrounding hydrogen proton.24 Therefore, hydrogen vacancy plays a key role in the physical properties of ADP such as electrical conductivity, dielectric loss, etc. Furthermore, the hydrogen vacancy could introduce impurity absorption that will reduce the optical quality of the crystal. It could also trap electron or hole carriers to bring out the change of electronic and optical properties. However, the influence of hydrogen vacancy defect on the physical properties of ADP crystals is still in dispute in experiment. The related theoretical studies have not been reported yet. Studying the structure and properties of hydrogen vacancy defect in ADP could help us to understand the microcosmic mechanism of defect induced conductivity and optical damage.
In this paper, we investigated the relative stability and electronic structures of charged hydrogen vacancy defects in ADP crystal by using hybrid DFT. The influence of supercell size, the electron exchange and correlation functional, and van der Waals (vdW) interaction on the defect formation energies of charged hydrogen vacancies are carefully examined in order to guarantee the accuracy of calculation results. Hybrid DFT was used to obtain more reliable description of defect formation energies, defect levels, and the localization of the electron distribution than (semi)local generalized gradient approximation (GGA) functional in wide-band-gap semiconductors25–30 by introducing some amount of exact exchange from Hartree–Fock theory in the electron exchange and correlation functional. The vdW interaction is found to be very important in describing the formation energies and defect levels for ADP crystal.
2. Computational method
The Vienna Ab Initio Simulation Package (VASP)31,32 based on the first-principles and the projector-augmented-wave (PAW) potential is implemented in the present calculation. Thereby the N 2s22p3, H 1s1, P 3s23p3, and O 2s22p4 states are treated as valence electrons. The general gradient approximation (GGA) of Perdew Burke and Ernzerhof (PBE)33 is employed to optimize the crystal structure with the force convergence criterion of 0.01 eV Å−1. The energetics and electronic structures are calculated by the screened-exchange hybrid density functional of Heyd, Scuseria, and Ernzerhof HSE06 (ref. 34 and 35). In this approach, the long-range exchange potential and the correlation potential are calculated with PBE functional, while the short-range exchange potential is calculated by mixing a fraction of nonlocal Hartree–Fock exchange with PBE. The screening length and mixing parameter are fixed at 10 Å and 0.25 respectively. To confirm the convergence of the calculations, the dependence of the total energy on the k-point set mesh37 and cutoff energy of bulk ADP is investigated with PBE and HSE06 respectively.36 According to the convergence test, the cutoff energy is set to 400 eV for both PBE and HSE06 calculations, and the k-point sets are chosen to 4 × 4 × 4 and 2 × 2 × 2 for PBE and HSE06 calculations respectively. Another two types of hybrid functionals HSE03 (ref. 38) and PBE0 (ref. 39 and 40) are also used to test the performance of hybrid functionals on the defect formation energy and the electronic properties. The supercell containing 48 atoms are used to construct the defect models. All the atoms and the lattice constants are fully relaxed by using the conjugate gradient techniques. DFT/vdW-WF2 method41–43 is used to consider the hydrogen bond interaction in the whole system. The tetragonal supercell with four NH4H2PO4 units (48 atoms) is used to model hydrogen vacancy defects in the crystal with defect density of 2.08 atom%. An electron is removed or added to the neutral system of hydrogen vacancy in order to model the positively
  and negatively
  charged hydrogen vacancy structure. The charged systems are also fully relaxed. The lattice vectors are refined as A = (ai + aj), B = (ai − aj), C = ck with the lattice constants of conventional unit cell a = b = 7.50 Å, and c = 7.55 Å.44,45
The defect formation energies Ef of defect X with charge state q dependent on the Fermi level position is defined as46–48
 | (1) |
| Functionals | The chemical potential of H (eV) |
|---|---|
| PBE | −3.46 |
| HSE06 | −3.82 |
| HSE03 | −3.82 |
| PBE0 | −3.95 |
| PBE + vdW | −3.34 |
| HSE06 + vdW | −3.82 |
The thermodynamic transition levels ε(q1/q2) is defined as the Fermi-level position for which the formation energies of charge states q1 and q2 are equal:46,49
 | (2) |
3. Results and discussion
3.1 The structure of hydrogen vacancies in ADP
We construct the hydrogen vacancy (VH) model by removing one hydrogen atom from the ADP supercell with 48 atoms. Firstly, we compare accuracy of considered electron exchange–correlation functionals on the crystal structure prediction by comparing the calculated the lattice constants of a, b, and c of ADP with experimental data.50,51 We then plot the corresponding mean absolute error (in %) in Fig. 1. We can see that HSE03 and PBE0 functionals show larger errors than PBE and HSE06 functionals for both a and c lattice parameters. PBE and HSE06 functionals show the similar extent on the prediction of lattice parameters. Therefore, we choose PBE functional to optimize the lattice constant and atomic position in order to save the computational cost. The optimized lattice constants by PBE are a = b = 7.32 Å and c = 7.42 Å with deviation of 2.40% and 1.72% with respect to the experimental values of a = b = 7.50 Å and c = 7.55 Å.44,45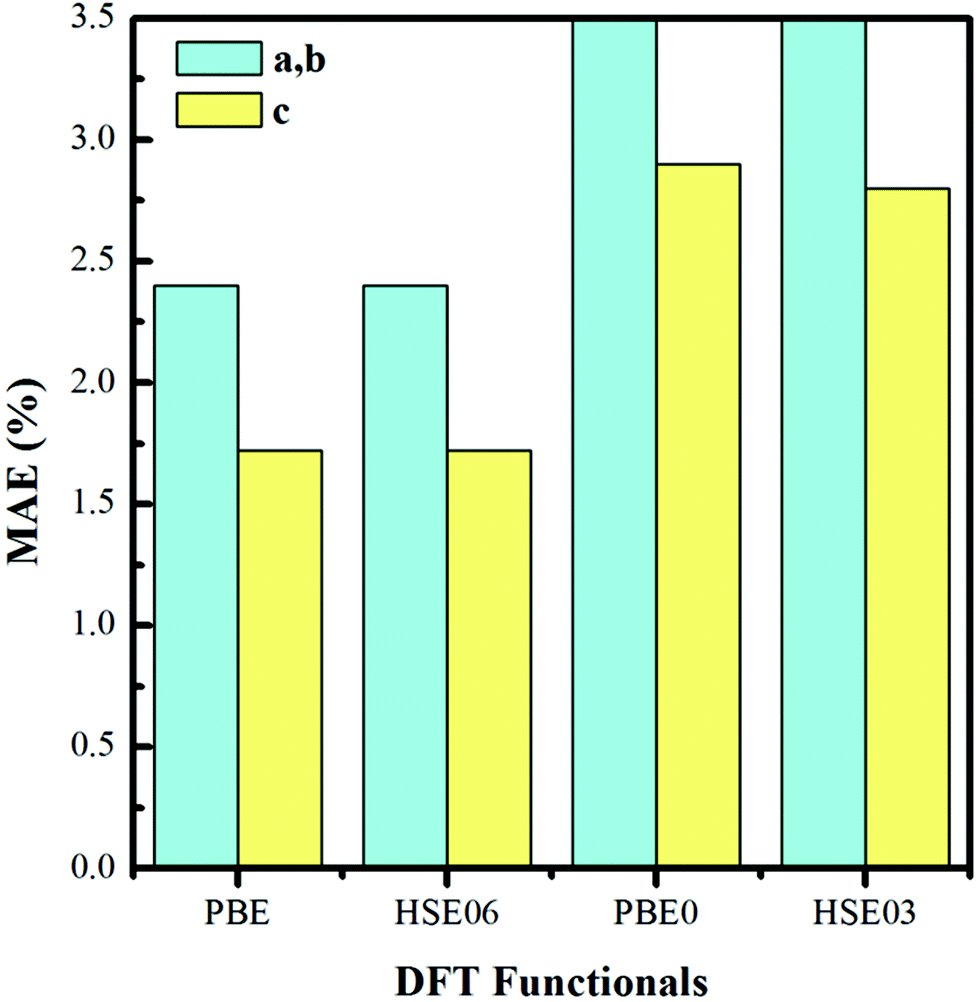 | ||
| Fig. 1 Mean absolute error (in %) on the optimized lattice constants of bulk ADP as compared with the experimental values. | ||
Fig. 2(a) shows the ADP single crystal grown by the temperature reduction method, and its corresponding crystal structure is shown in Fig. 2(b). The ADP crystal structure is tetragonal with I![[4 with combining macron]](https://www.rsc.org/images/entities/char_0034_0304.gif) 2d space group. It is seen from Fig. 2(b) that each NH4+ group is connected with six (H2PO4)− groups via covalent bond of N–H–O, while each (H2PO4)− group bonds with four (H2PO4)− groups by the P–O–H⋯O hydrogen bond.19 Therefore, there are two kinds of H atoms in the ADP crystal – H1 in the (H2PO4)− group with the fractional coordinate (0.750, 0.350, 0.375) and H2 in the NH4+ group with the fractional coordinate (0.500, 0.411, 0.937), as labelled in Fig. 2(c) and (d). It is found that VH1 leads to small amount of lattice relaxation whereas VH2 defect causes large atomic distortion regarding to the change of atomic location, bonding length, bonding angle and symmetry of NH4+ group. In order to accurately obtain the relative stability of VH1 and VH2, we compare the calculated defect formation energies (DFEs) of neutral VH1 and VH2 with different functionals and listed in Table 2. It is seen that although the absolute values of DFEs of VH1 and VH2 varies for different functionals, the DFE of VH1 is always lower than that of VH2 indicating that VH1 is energetically preferable to form in ADP crystal. The easier missing of H1 atom is mainly due to the weak hydrogen bond interaction. Therefore, we studied the charged VH defects based on the VH1 model. The model of positively charged
2d space group. It is seen from Fig. 2(b) that each NH4+ group is connected with six (H2PO4)− groups via covalent bond of N–H–O, while each (H2PO4)− group bonds with four (H2PO4)− groups by the P–O–H⋯O hydrogen bond.19 Therefore, there are two kinds of H atoms in the ADP crystal – H1 in the (H2PO4)− group with the fractional coordinate (0.750, 0.350, 0.375) and H2 in the NH4+ group with the fractional coordinate (0.500, 0.411, 0.937), as labelled in Fig. 2(c) and (d). It is found that VH1 leads to small amount of lattice relaxation whereas VH2 defect causes large atomic distortion regarding to the change of atomic location, bonding length, bonding angle and symmetry of NH4+ group. In order to accurately obtain the relative stability of VH1 and VH2, we compare the calculated defect formation energies (DFEs) of neutral VH1 and VH2 with different functionals and listed in Table 2. It is seen that although the absolute values of DFEs of VH1 and VH2 varies for different functionals, the DFE of VH1 is always lower than that of VH2 indicating that VH1 is energetically preferable to form in ADP crystal. The easier missing of H1 atom is mainly due to the weak hydrogen bond interaction. Therefore, we studied the charged VH defects based on the VH1 model. The model of positively charged  is constructed by removing one electron from the neutral VH system, and that of negatively charged
  is constructed by adding one electron to the neutral VH system. The optimized structures are shown in Fig. 2(e) and (f). It is seen that the distance of O1 and O2 adjacent to the
  is dramatically shortened by 37.70% from 2.387 to 1.488 Å (Table 3) as compared to the case of neutral VH defect due to the capture of hole, showing strong interaction of O1 and O2. In this case, the distance of O1–O2 is similar to the bond length of 1.49 Å for the neutral peroxyl bridge in vitreous silicon dioxide.52,53 The movement of O toward
  defect leads to the elongation of P–O bond by 9.08%. On the contrary, the capture of an electron carrier by VH leads to the elongation of the O1–O2 distance by 20.74% (from 2.387 to 2.882 Å) due to the Coulomb repulsion of captured electron with the electrons around O1 and O2, indicating a much weak interaction of O1 and O2. The outward movement of O regarding to
  only leads to the slight shortening of P–O bond by 2.01%, showing small influence on the PO43− group.
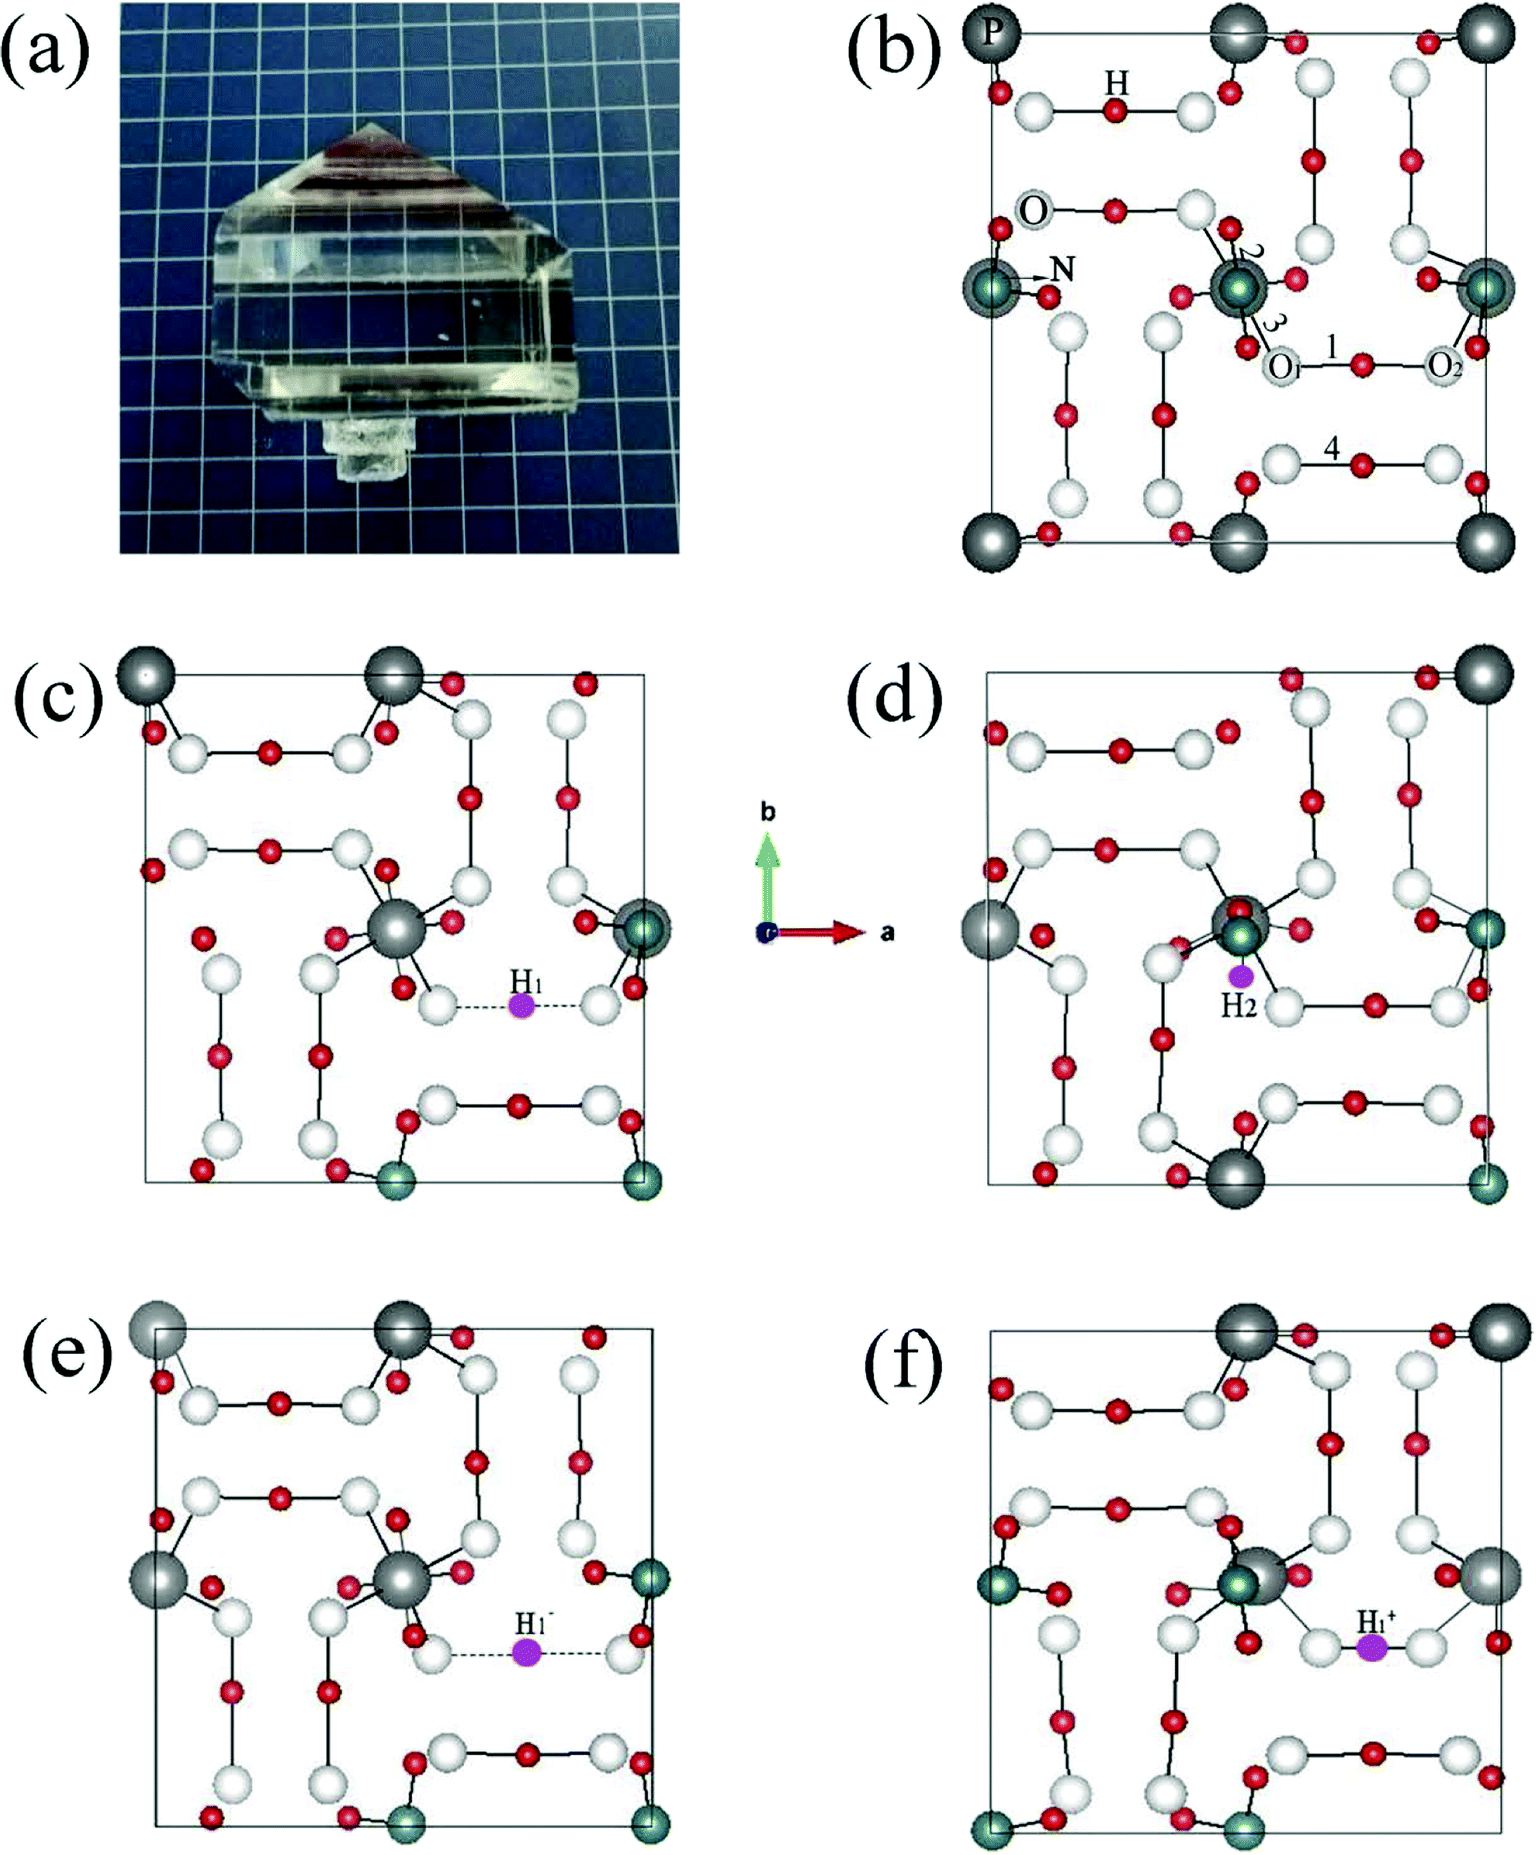 | ||
| Fig. 2 ADP crystal grown with the temperature reduction method (a), top-view of the crystal structures of pristine ADP (b), ADP with neutral H1 (c) and H2 (d) vacancies, as well as H1 vacancies with −1 (e) and +1 (f) charge states. The vacancies are indicated in the small rose red balls. | ||
| Functionals | Defect formation energies Ef (eV) | |
|---|---|---|
| VH1 | VH2 | |
| PBE | 3.06 | 3.44 |
| HSE06 | 4.56 | 4.70 |
| PBE0 | 4.37 | 4.45 |
| HSE03 | 3.94 | 4.19 |
| Bonds/distance | Pristine ADP | VH1 | VH2 |
|
|
|---|---|---|---|---|---|
| 1 | 1.200 | — | 1.343 | — | — |
| 2 | 1.039 | 1.038 | — | 1.006 | 1.035 |
| 3 | 1.551 | 1.542 | 1.528 | 1.501 | 1.682 |
| 4 | 1.200 | 1.201 | 1128 | 1.207 | 1.195 |
| O1–O2 | 2.401 | 2.387 | 2.437 | 2.882 | 1.488 |


3.2 Relative stability of hydrogen vacancies in ADP
We investigate the relative stability of hydrogen vacancies in ADP crystal by calculating the defect formation energies dependent with the Fermi level and the charge transition levels. At the beginning, we examine the influence of calculation model and parameters on the accuracy of defect formation energies of charged point defects by taking as an example. The charged defects always introduce finite-size error that arise from the electrostatic interaction between charged defects in neighboring cell images and the structural strain introduced by the defect due to the limited size of the supercell within periodic boundary condition. We therefore first compare the defect formation energies of
  calculated in 48-atom and 384-atom supercells within PBE functional, as shown in Table 4. It is seen that the calculated defect formation energies of
  in 384-atom supercell is only 0.04 eV lower than that in 48-atom supercell, indicating extremely slow energy change with the increase of supercell size until to infinite limit. Therefore, the finite-size error to the defect formation energies of charged VH could be neglected, and the smaller supercells (48 atoms) are used to investigate the energetic and electronic properties of VH in ADP crystal in order to save the computational cost. Second, we consider the influence of vdW interaction on the defect formation energy of
  . The inclusion of vdW interaction by DFT/vdW-WF2 method has been proved to obtain more accurate description of the molecule–surface interaction and the system with hydrogen bond interaction.54–59 Here we compare the calculated defect formation energies of
  with and without vdW correction within PBE functional, as shown in Table 4. It is seen that the vdW correction could reduce the defect formation energy of
  by 0.24 eV, which is one order of magnitudes larger than the error of finite-size effect. Such energy difference may lead to the different result of the relative stability of charged VH in ADP crystal, and the vdW correction should thus be considered in the following calculations. Finally, we consider the effect of screened exchange potential by comparing the calculated defect formation energies of
  by PBE and HSE06. From the calculation results shown in Table 4 we can see that the HSE06 functional that mixing 25% nonlocal Hartree–Fock exchange with PBE could largely enhance the defect formation energy of
  by 3.35 eV. It is one order of magnitudes larger than the correction of vdW interaction, and should not be neglected. As HSE06 has been proved to better describe the defect formation energy, electron localization, and defect levels than GGA, HSE06 functional is used in the following calculations.60,61 Overall, the energetics and electronic structures of VH are calculated within HSE06 hybrid functional with vdW correction by using tetragonal ADP supercells containing 48 atoms after carefully parameter examination.
| Parameters | Defect formation energies Ef (eV) |
|---|---|
| VH1, HSE06, 48 atoms | 4.56 |
| VH2, HSE06, 48 atoms | 4.70 |
 , PBE, 384 atoms , PBE, 384 atoms |
3.16 − EF |
 , PBE, 48 atoms , PBE, 48 atoms |
3.12 − EF |
 , PBE + vdW, 48 atoms , PBE + vdW, 48 atoms |
2.88 − EF |
 , HSE06 + vdW, 48 atoms , HSE06 + vdW, 48 atoms |
4.33 − EF |
The calculated defect formation energies of  ,
,  , and
, and  with and without vdW correction are compared in Fig. 3. We found that the vdW interaction play a key role in the calculation of defect formation energies and charge transition levels. For example, the vdW correction largely shifts the charge transition level ε(+/−) toward the valence band maximum (VBM) from 2.93 eV to 1.12 eV. We could get different conclusions according to this result: without the consideration of vdW interaction, the positively charged hydrogen vacancy
  is the most stable defect in majority of ADP crystals, and the negatively charged hydrogen vacancy
  only exists in near-stoichiometric crystal; whereas
  is more stable than
  when the Fermi level moves up to 1.12 eV if the vdW interaction is considered. The calculation results with vdW interaction are for sure more accurate than those without the vdW interaction. We thus only discuss the calculation results with vdW interaction. It is seen that
  is more stable than
  and
and  when the Fermi level lies near the VBM while
  is energetically preferable when the Fermi level lies higher than 1.12 eV. As in ADP crystals, H atoms are much easier to be missed than N, P, and O atoms to form VH defects, the Fermi level could lies below the middle of the electronic band gap of ADP. Therefore, in this region,
  and
and  are all the possible defects in practical ADP crystals. The results demonstrate that the neutral
  is instable in the ADP crystal, which is similar to the case in SiO2.62 The instability of the neutral
  defect indicates that the hydrogen vacancies in majority of ADP crystals prefer to trap hole or electron carriers. There are two extreme situations: when the defect concentration of hydrogen vacancies is high, VH defects prefer to capture hole carriers and act as acceptor centers; if the grown ADP crystal is with good quality (very small concentration of VH), these hydrogen vacancies mainly prefer to capture electron carriers and act as donor centers. If the situation is in between, part of VH may capture holes and the rest captures electrons which results in the spatial charge separation in ADP crystals. These results may give a reasonable explanation regarding to the experimentally observed inflection point in the conductivity curve from the aspect of defect behavior.63 At the low temperature region, the concentration of hydrogen vacancies is very low, and the amount of the electron carriers in the crystals is thus also small. In this case,
  is energetically preferable and therefore, the neutral hydrogen vacancy defects prefer to capture electrons to form stable
  defects. It further reduces the concentration of electron carriers, and mainly contributes to the low conductivity of ADP crystal. With the increase of temperature, more hydrogen atoms could escape from their original lattice sites due to the thermal vibration, leaving a large amount of hydrogen vacancies in the lattice. On the one hand, it will largely increase the concentration of electron carriers in the crystal. On the other hand, with the increase of hydrogen vacancy concentration, a large part of the vacancy defects prefer to capture hole carriers instead of electron carriers to form stable
  defects, which leaves much more electrons in the crystal, leading to the sharp increase of the conductivity of the ADP crystal. The well explanation of the measured conductivity phenomenon further proved the importance of considering the vdW interaction in ADP calculations.
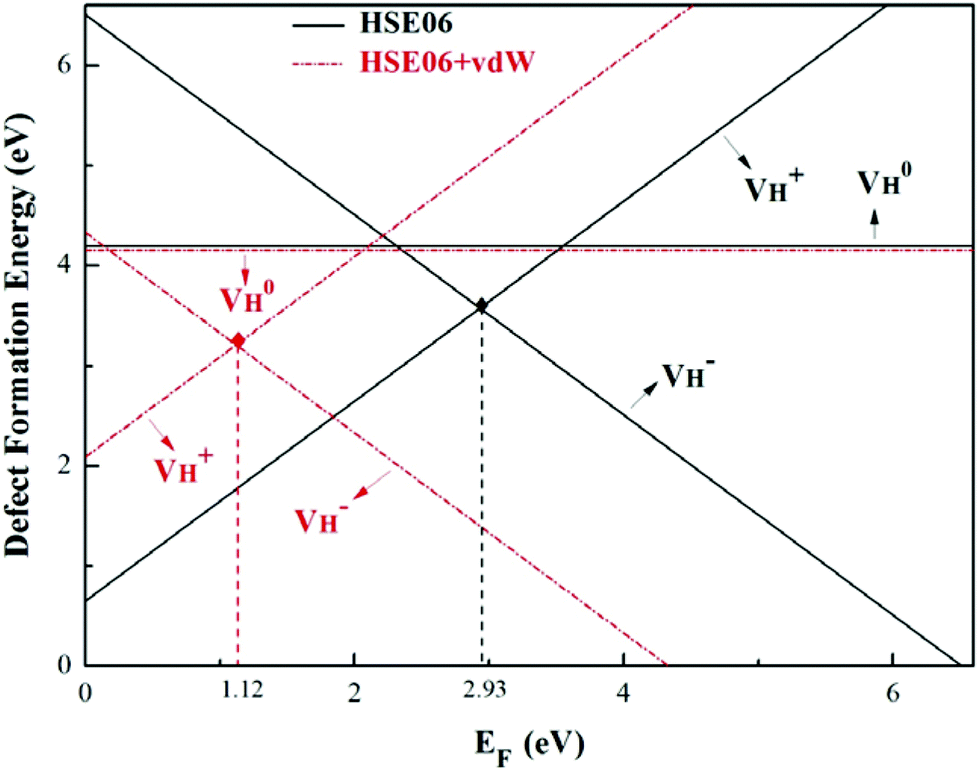 | ||
| Fig. 3 Defect formation energies of VH with positive, neutral, and negative charge states as a function of the Fermi level for HSE06 and HSE06 + vdW methods. The range of Fermi energy corresponds to the calculated fundamental band gap of 6.76 eV for pristine ADP crystal. | ||
3.3 Electronic structure of hydrogen vacancies in ADP
In order to better understand the electron/hole trapping behaviors and the defect induced impurity states in the band gap of ADP crystal, we calculated the density of states of stable hydrogen vacancies and the electron distributions around the hydrogen vacancy defects in ADP crystal. First, we compare the calculated electronic band gaps of ADP by different functionals. As shown in Table 5, HSE06 functional shows the best description of band gap of ADP crystal (6.76 eV) as compared to the experiment value 6.96 eV,64 indicating that HSE06 could well reproduce the electronic properties such as density of states, electron distribution of this system. The local PBE functional could underestimate the band gap as usual, and the PBE0 functional is proved to overestimate the band gap compared with HSE06, which has been reported in the literature.50,51 The HSE03 functional shows fewer consistence with experiment than HSE06. Also, we found that the consideration of vdW correction could not change the calculated band gap of ADP, showing little influence on the electronic structures of ADP crystal.| Functionals | The band gap (eV) |
|---|---|
| Experimental | 6.96 |
| PBE | 5.97 |
| HSE06 | 6.76 |
| PBE0 | 7.79 |
| HSE03 | 6.51 |
The calculated partial density of states (PDOS) of neutral, positively and negatively charged hydrogen vacancies as compared to those of pristine ADP crystal are shown in Fig. 4. It is seen that the VBM of pristine ADP is mainly derived from O 2p states while the conduction band minimum (CBM) comes from the mixing of H 1s, O 2p, and P 3p states. The formation of a neutral  defect introduces a half-occupied defect state at about 0.5 eV above the VBM in the band gap (Fig. 4b). This defect state is derived from O 2p states of its neighboring O atoms (Fig. 5a), which is similar to the results of electronic properties calculations for hydrogen vacancy in silica.62 It could introduce weak optical absorption just near the absorption edge of pristine ADP crystal that comes from the electron transition from the defect state to the CBM and may hardly be recognized.
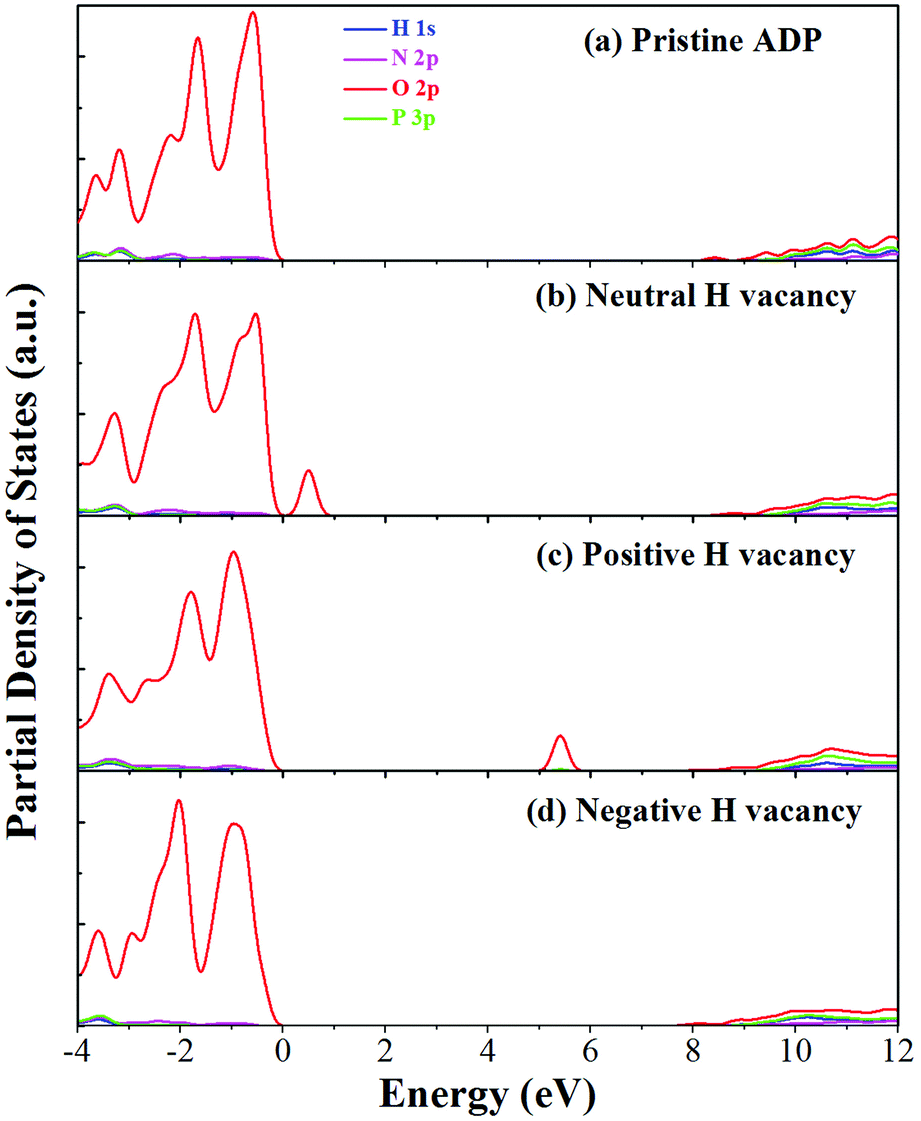 | ||
| Fig. 4 PDOS of H, N, O, and P in pristine ADP (a) and crystal with neutral (b), positively (c) and (d) negatively charged hydrogen vacancies. | ||
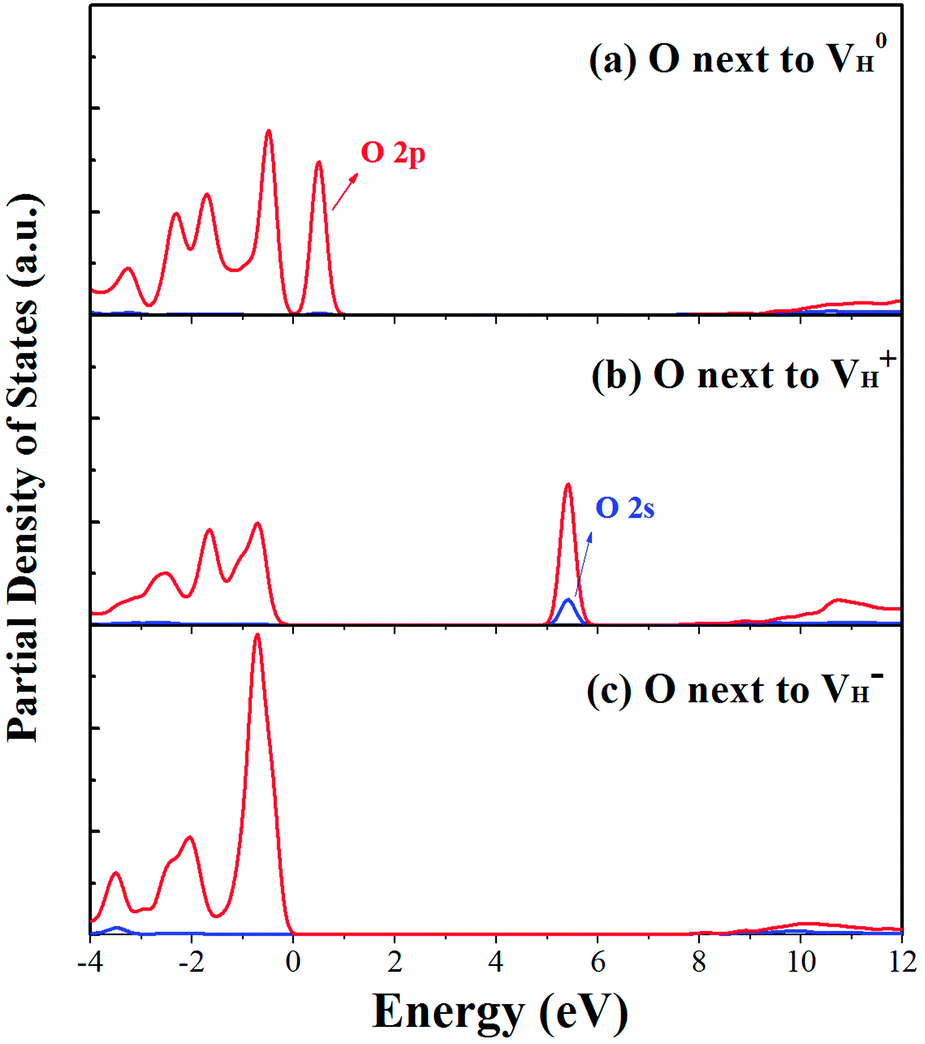 | ||
| Fig. 5 PDOS of the O atoms adjacent to the neutral (a), positive (b) and negative (c) H vacancies. | ||
When the neutral VH captures one hole to form  defect, the defect state in the band gap shifts toward CBM by 4.7 eV and the band gap is reduced to 5.2 eV. This defect leads to the stronger coupling interaction of its adjacent O atoms, and finally forms O–O peroxyl bridge which is similar to the phenomenon of the positive hydrogen vacancy in KDP and the oxygen atom in a peroxyl bridge in silica.52,65 Finally, the hydrogen vacancy could capture a hole with its two adjacent O atoms to form a molecular-type polaron. The contributions of the adjacent O atoms and the other adjacent atoms have been plotted in Fig. 5b and 6 respectively. We can see that the defect state of
  comes from the mixing of 2s and 2p states of its two neighboring O atoms that could also be confirmed from the charge density difference plot in Fig. 7a. In the above discussion, we found that the P–O bond is stretched and the PO43− group also moves toward the
  due to the formation of O–O peroxyl bridge. Therefore, there is also a small amount of contribution of P 3p state on the
  defect state in the band gap (Fig. 6). The VBM is mainly from the 2p states of the adjacent O atoms.
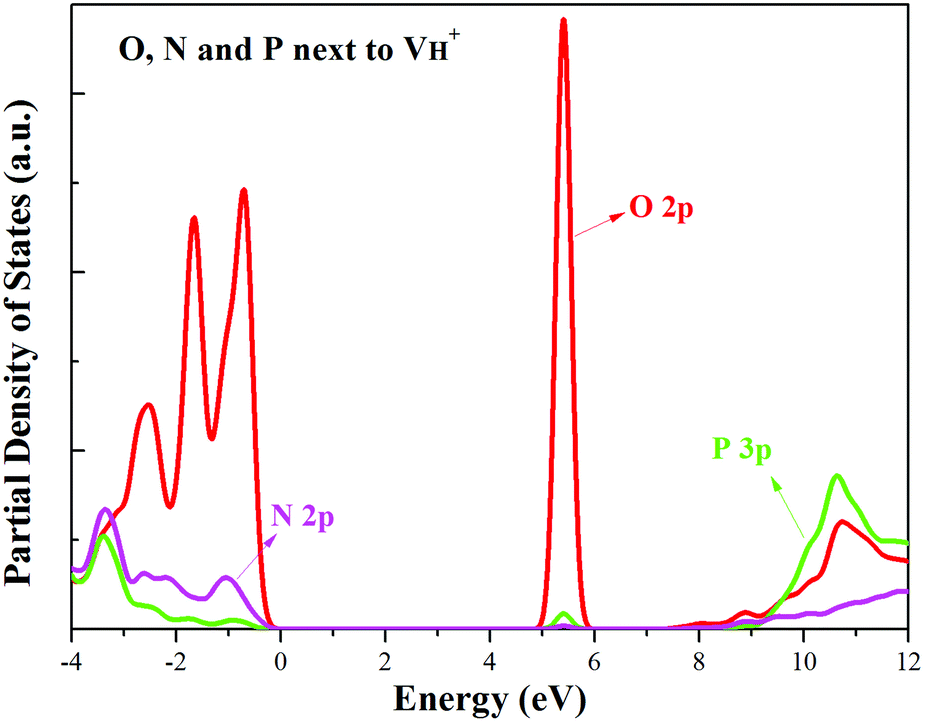 | ||
| Fig. 6 PDOS of the O, N and P atoms adjacent to the positive H vacancy. | ||
 | ||
Fig. 7 The charge density difference contour maps for  and and  . The regions from blue to red correspond to the electron density from 0 to 0.17 e Å−3. . The regions from blue to red correspond to the electron density from 0 to 0.17 e Å−3. | ||
Another case is that the neutral VH defect captures one electron to form  defect. In this case, the isolated defect state in the band gap is full-occupied and downshifted to the valence band. At the same time, the valence bands are slightly upshifted due to the Coulomb repulsion of electrons. Therefore, the band gap of
  defect is reduced to 6.27 eV, and the contribution of adjacent O 2p states to the VBM becomes much stronger (Fig. 5c). As compared to the
  defect, the interaction between O1 and O2 becomes much weaker, while that of P and O becomes stronger. It could not introduce any new optical absorption for this defect.
By analyzing the electronic structures of the hydrogen vacancies, we get that only the positive charged hydrogen vacancy  is stable and could introduce additional optical absorption with respect to the intrinsic optical absorption. According to the calculation results, the new optical absorption introduced by
  could appear at about 260 nm. The meaning of the stability of
  is that when the defect concentration is high, the additional optical absorption would be strengthened and easily detected by experimental measurement.66 They could also induce the precursor to absorb the laser energy, leading to the material damage and thus decreasing the laser damage threshold of ADP. Therefore, the concentration of positively charged hydrogen vacancy defects is suggested to be largely reduced during the growth of the crystal. In our experiment, we also observe the optical absorption at 355 nm (3.49 eV) that has been detected in many other experiments, such as ref. 3. It is not expected to come from the intrinsic H vacancy as the calculated transition energy is not consistent with the measured absorption energy (more than 1 eV difference). As we have tested the validity of local PBE functional and many types of hybrid functionals on the description of crystal structure and electronic properties of ADP crystal, the large energy difference of 1 eV could not be from the calculation error. We infer that the optical absorption at 355 nm could come from the extrinsic impurity centers in ADP crystal, which should be intensively investigated later.
4. Conclusions
In conclusion, the density functional theory with (semi)local GGA and hybrid HSE06 exchange–correlation functionals were carried out to investigate the structures, relative stability, and electronic structures of the neutral and charged hydrogen vacancies in ADP crystals. The influence of supercell size, van der Waals interaction, and the screened exchange potential on the defect formation energies of charged hydrogen vacancies is carefully examined firstly. The calculation results show that the van der Waals interaction and the screened exchange potential have major effect on the calculation accuracy of both energetics and electronic structures, and thus should be considered. By comparing the defect formation energies of neutral VH in (H2PO4)− and NH4+ groups, we found that the H atom in the (H2PO4)− group is easier to be missed to form VH defect. However, the neutral VH is unstable in the ADP crystals. It could capture a hole carrier to form its positive charge state or capture an electron to form its negative charge state in majority of ADP crystals. For the defect, the hole is trapped around the two O atoms adjacent to the hydrogen vacancy to form a molecular-type polaron. We infer that the transition of
  to
to  with the increase of temperature may be the dominant reason for the break point of the conductivity of ADP crystal in the high temperature region. On the other hand,
  defect introduces a deep defect state in the middle of band gap. It could act as an optical absorption center in experiment and lead to the special optical absorption phenomenon and optical damage under irradiation by high-intensity laser beam.
Conflicts of interest
There are no conflicts to declare.Acknowledgements
Thanks to the support of Shandong University and Institute of Crystal Materials Shandong University. This work was supported by the National Natural Science Foundation of China (Grant No. 51323002 and 51402173); and the Ministry of Education (Grant No. 625010360).References
- L. N. Rashkovich, KDP-family single crystals, Published under the Adam Hilger imprint by IOP Publishing Ltd, 1991 Search PubMed.
- D. N. Nikogosyan, Nonlinear optical crystals: a complete survey, Springer, Cork, Ireland, 2001 Search PubMed.
- S. H. Ji, F. Wang, L. L. Zhu, X. G. Xu, Z. Wang and X. Sun, Noncritical phase-matching fourth harmonic generation of a 1053-nm laser in an ADP crystal, Sci. Rep., 2013, 3, 1605 CrossRef PubMed.
- Y. F. Lian, L. L. Zhu, T. T. Sui, G. W. Yu, L. S. Zhang, H. L. Zhou, M. X. Xu and X. Sun, The rapid growth of ADP single crystal, CrystEngComm, 2016, 18, 7530–7536 RSC.
- P. Bennema, Analysis of crystal growth models for slightly supersaturated solutions, J. Cryst. Growth, 1967, 1, 278–286 CrossRef CAS.
- R. J. Davey and J. W. Mullin, Growth of the {101} faces of ammonium dihydrogen phosphate crystals in the presence of ionic species, J. Cryst. Growth, 1974, 23, 89–94 CrossRef CAS.
- R. J. Davey and J. W. Mullin, The effect of supersaturation on growth features on the {100} faces of ammonium dihydrogen phosphate crystals, J. Cryst. Growth, 1975, 29, 45–48 CrossRef CAS.
- C. Belouet, E. Dunia and J. F. Petroff, X-ray topographic study of defects in KH2PO4 single crystals and their relation with impurity segregation, J. Cryst. Growth, 1974, 23, 243–252 CrossRef CAS.
- S. E. Božin and B. Žižić, Dependence of the linear growth rate of individual ammonium dihydrogen phosphate microcrystals on temperature, J. Cryst. Growth, 1981, 52, 820–823 CrossRef.
- R. J. Davey, R. I. Ristić and B. Žižić, The role of dislocations in the growth of ammonium dihydrogen phosphate crystals from aqueous solutions, J. Cryst. Growth, 1979, 47, 1–4 CrossRef CAS.
- F. Lefaucheux, M. C. Robert and E. Manghi, A comparison between gel grown and solution grown crystals—case of ADP and KDP, J. Cryst. Growth, 1982, 56, 141–150 CrossRef CAS.
- P. V. Dhanaraj, G. Bhagavannarayana and N. P. Rajesh, Effect of amino acid additives on crystal growth parameters and properties of ammonium dihydrogen orthophosphate crystals, Mater. Chem. Phys., 2008, 112, 490–495 CrossRef CAS.
- R. I. Ristic and J. N. Sherwood, The growth rate variation of the (100) faces of ADP crystals in the presence of manganese ions, J. Phys. D: Appl. Phys., 1991, 24, 171 CrossRef CAS.
- D. L. Xu and D. F. Xue, Chemical bond analysis of the crystal growth of KDP and ADP, J. Cryst. Growth, 2006, 286, 108–113 CrossRef CAS.
- X. Zhao, C. T. Sun, Y. F. Si, M. N. Liu and D. F. Xue, Crystallization behaviors of ferroelectric and piezoelectric materials, Mod. Phys. Lett. B, 2009, 23, 3809–3815 CrossRef CAS.
- C. T. Sun and D. F. Xue, Hydrogen bonding nature during ADP crystallization, J. Mol. Struct., 2014, 1059, 338–342 CrossRef CAS.
- D. L. Xu, D. F. Xue and H. Ratajczak, Morphology and structure studies of KDP and ADP crystallites in the water and ethanol solutions, J. Mol. Struct., 2005, 740, 37–45 CrossRef CAS.
- D. L. Xu and D. F. Xue, Chemical bond analysis of the crystal growth of KDP and ADP, J. Cryst. Growth, 2006, 286, 108–113 CrossRef CAS.
- J. Lasave, S. Koval, N. S. Dalal and R. L. Migoni, Origin of antiferroelectricity in NH4H2PO4 from first principles, Phys. Rev. Lett., 2007, 98, 267601 CrossRef CAS PubMed.
- E. J. Murphy, Conduction in Single Crystals of Ammonium Dihydrogen Phosphate, J. Appl. Phys., 1964, 35, 2609–2614 CrossRef CAS.
- J. M. Pollock and M. Sharan, Conduction and diffusion in crystals containing hydrogen bonds. II. ammonium dihydrogen phosphate, J. Chem. Phys., 1969, 51, 3604–3607 CrossRef CAS.
- L. B. Harris and G. J. Vella, Direct current conduction in ammonium and potassium dihydrogen phosphate, J. Chem. Phys., 1973, 58, 4550–4557 CrossRef CAS.
- J. K. Rath and S. Radhakrishna, Electrical conductivity and dielectric loss studies of MoO42−-doped NH4H2PO4 single crystals, J. Mater. Sci. Lett., 1987, 6, 929–931 CrossRef CAS.
- A. Abdel-Kader, Electrical conductivity of ammonium dihydrogen phosphate crystals with regard to crystal structure and thermal analysis, J. Mater. Sci.: Mater. Electron., 1991, 2, 7–10 CrossRef CAS.
- F. Oba, A. Togo, I. Tanaka, J. Paier and G. Kresse, Defect energetics in ZnO: a hybrid Hartree-Fock density functional study, Phys. Rev. B: Condens. Matter Mater. Phys., 2008, 77, 245202 CrossRef.
- P. Deák, B. Aradi, T. Frauenheim, E. Janzén and A. Gali, Accurate defect levels obtained from the HSE06 range-separated hybrid functional, Phys. Rev. B: Condens. Matter Mater. Phys., 2010, 81, 153203 CrossRef.
- J. L. Lyons, A. Janotti and C. G. Van de Walle, Shallow versus deep nature of Mg acceptors in nitride semiconductors, Phys. Rev. Lett., 2012, 108, 156403 CrossRef PubMed.
- J. Paier, M. Marsman, K. Hummer, G. Kresse, I. C. Gerber and J. G. Ángyán, Screened hybrid density functionals applied to solids, J. Chem. Phys., 2006, 124, 154709 CrossRef CAS PubMed.
- P. Ágoston, K. Albe, R. M. Nieminen and M. J. Puska, Intrinsic n-type behavior in transparent conducting oxides: a comparative hybrid-functional study of In2O3, SnO2, and ZnO, Phys. Rev. Lett., 2009, 103, 245501 CrossRef PubMed.
- T. Shimada, T. Ueda, J. Wang and T. Kitamura, Hybrid Hartree-Fock density functional study of charged point defects in ferroelectric PbTiO3, Phys. Rev. B: Condens. Matter Mater. Phys., 2013, 87, 174111 CrossRef.
- G. Kresse and J. Furthmüller, Efficiency of ab initio total energy calculations for metals and semiconductors using a plane-wave basis set, Comput. Mater. Sci., 1996, 9, 15–50 CrossRef.
- G. Kresse and J. Furthmüller, Efficient iterative schemes for ab initio total-energy calculations using a plane-wave basis set, Phys. Rev. B: Condens. Matter Mater. Phys., 1996, 54, 11169 CrossRef CAS.
- J. P. Perdew, K. Burke and M. Ernzerhof, Generalized gradient approximation made simple, Phys. Rev. Lett., 1996, 77, 3865 CrossRef CAS PubMed.
- J. Heyd, G. E. Scuseria and M. Ernzerhof, Hybrid functionals based on a screened Coulomb potential, J. Chem. Phys., 2003, 118, 8207–8215 CrossRef CAS.
- A. V. Krukau, O. A. Vydrov, A. F. Izmaylov and G. E. Scuseria, Influence of the exchange screening parameter on the performance of screened hybrid functional, J. Chem. Phys., 2006, 125, 224106 CrossRef PubMed.
- J. Sun, H. T. Wang, J. He and Y. J. Tian, Ab initio investigations of optical properties of the high-pressure phases of ZnO, Phys. Rev. B: Condens. Matter Mater. Phys., 2005, 71, 125132 CrossRef.
- H. J. Monkhorst and J. D. Pack, Special points for Brillouin-zone integrations, Phys. Rev. B: Solid State, 1976, 13, 188 CrossRef.
- J. Paier, M. Marsman, K. Hummer, G. Kresse, I. C. Gerber and J. G. Ángyán, Screened hybrid density functionals applied to solids, J. Chem. Phys., 2006, 124, 154709 CrossRef CAS PubMed.
- J. Heyd, G. E. Scuseria and M. Ernzerhof, Hybrid functionals based on a screened Coulomb potential, J. Chem. Phys., 2003, 118, 8207–8215 CrossRef CAS.
- C. Adamo and V. Barone, Toward reliable density functional methods without adjustable parameters: the PBE0 model, J. Chem. Phys., 1999, 110, 6158 CrossRef CAS.
- P. L. Silvestrelli, van der Waals interactions in DFT made easy by Wannier functions, Phys. Rev. Lett., 2008, 100, 053002 CrossRef PubMed.
- P. L. Silvestrelli, van der Waals interactions in density functional theory using Wannier functions, J. Phys. Chem. A, 2009, 113, 5224–5234 CrossRef CAS PubMed.
- L. Andrinopoulos, N. D. M. Hine and A. A. Mostofi, Calculating dispersion interactions using maximally localized Wannier functions, J. Chem. Phys., 2011, 135, 154105 CrossRef PubMed.
- Z. D. Li, X. J. Huang, D. X. Wu and K. M. Xiong, Large crystal growth and measurement of electro-optical coefficients of ADP, J. Cryst. Growth, 2001, 222, 524–527 CrossRef CAS.
- X. E. Ren, D. L. Xu and D. F. Xue, Crystal growth of KDP, ADP, and KADP, J. Cryst. Growth, 2008, 310, 2005–2009 CrossRef CAS.
- C. G. Van de Walle and J. Neugebauer, First-principles calculations for defects and impurities: applications to III-nitrides, J. Appl. Phys., 2004, 95, 3851–3879 CrossRef CAS.
- A. F. Kohan, G. Ceder, D. Morgan and C. G. Van de Walle, First-principles study of native point defects in ZnO, Phys. Rev. B: Condens. Matter Mater. Phys., 2000, 61, 15019 CrossRef CAS.
- J. He, R. K. Behera, M. W. Finnis, X. Li, E. C. Dickey, S. R. Phillpot and S. B. Sinnott, Prediction of high-temperature point defect formation in TiO2 from combined ab initio and thermodynamic calculations, Acta Mater., 2007, 55, 4325–4337 CrossRef CAS.
- H. X. Xu, D. Lee, J. He, S. B. Sinnott, V. Gopalan, V. Dierolf and S. R. Phillpot, Stability of intrinsic defects and defect clusters in LiNbO3 from density functional theory calculations, Phys. Rev. B: Condens. Matter Mater. Phys., 2008, 78, 174103 CrossRef.
- J. Zaffran and M. Caspary Toroker, Benchmarking density functional theory based methods to model NiOOH material properties: Hubbard and van der Waals corrections vs. hybrid functional, J. Chem. Theory Comput., 2016, 12, 3807–3812 CrossRef CAS PubMed.
- T. Le Bahers, M. Rérat and P. Sautet, Semiconductors used in photovoltaic and photocatalytic devices: assessing fundamental properties from DFT, J. Phys. Chem. C, 2014, 118, 5997–6008 Search PubMed.
- E. P. O'Reilly and J. Robertson, Theory of defects in vitreous silicon dioxide, Phys. Rev. B: Condens. Matter Mater. Phys., 1983, 27, 3780 CrossRef.
- Y. G. Jin and K. J. Chang, Mechanism for the enhanced diffusion of charged oxygen ions in SiO2, Phys. Rev. Lett., 2001, 86, 1793 CrossRef CAS PubMed.
- A. Ambrosetti and P. L. Silvestrelli, Adsorption of rare-gas atoms and water on graphite and graphene by van der Waals-corrected density functional theory, J. Phys. Chem. C, 2011, 115, 3695–3702 CAS.
- P. L. Silvestrelli and A. Ambrosetti, Inclusion of screening effects in the van der Waals corrected DFT simulation of adsorption processes on metal surfaces, Phys. Rev. B: Condens. Matter Mater. Phys., 2013, 87, 075401 CrossRef.
- P. L. Silvestrelli and A. Ambrosetti, van der Waals corrected DFT simulation of adsorption processes on transition-metal surfaces: Xe and graphene on Ni (111), Phys. Rev. B: Condens. Matter Mater. Phys., 2015, 91, 195405 CrossRef.
- P. L. Silvestrelli, van der Waals interactions in density functional theory by combining the quantum harmonic oscillator-model with localized Wannier functions, J. Chem. Phys., 2013, 139, 054106 CrossRef PubMed.
- A. Ambrosetti and P. L. Silvestrelli, van der Waals interactions in density functional theory using Wannier functions: improved C6 and C3 coefficients by a different approach, Phys. Rev. B: Condens. Matter Mater. Phys., 2012, 85, 073101 CrossRef.
- S. D. Chakarova-Käck, E. Schröder, B. I. Lundqvist and D. C. Langreth, Application of van der Waals density functional to an extended system: adsorption of benzene and naphthalene on graphite, Phys. Rev. Lett., 2006, 96, 146107 CrossRef PubMed.
- Y. L. Li, W. G. Schmidt and S. Sanna, Intrinsic LiNbO3 point defects from hybrid density functional calculations, Phys. Rev. B: Condens. Matter Mater. Phys., 2014, 89, 094111 CrossRef.
- Y. L. Li, S. Sanna and W. G. Schmidt, Modeling intrinsic defects in LiNbO3 within the Slater-Janak transition state model, J. Chem. Phys., 2014, 140, 234113 CrossRef PubMed.
- A. Yokozawa and Y. Miyamoto, First-principles calculations for charged states of hydrogen atoms in SiO2, Phys. Rev. B: Condens. Matter Mater. Phys., 1997, 55, 13783 CrossRef CAS.
- L. L. Zhu, B. A. Liu, L. S. Zhang, Q. H. Zhang, Z. P. Wang and X. Sun, Phase matching characteristics of deuterated ammonium dihydrogen phosphate crystals, Chin. Opt. Lett., 2015, 13, 041601 CrossRef.
- W. L. Smith, KDP and ADP transmission in the vacuum ultraviolet, Appl. Opt., 1977, 16, 1798 CrossRef CAS PubMed.
- C. S. Liu, Q. Zhang, N. Kioussis and S. G. Demos, Electronic structure calculations of intrinsic and extrinsic hydrogen point defects in KH2PO4, Phys. Rev. B: Condens. Matter Mater. Phys., 2003, 68, 224107 CrossRef.
- A. Dhar and A. Mansingh, Optical properties of reduced lithium niobate single crystals, J. Appl. Phys., 1990, 68, 5804–5809 CrossRef CAS.
| This journal is © The Royal Society of Chemistry 2018 |