DOI:
10.1039/C7RA13094E
(Paper)
RSC Adv., 2018,
8, 9697-9706
Insights into the mechanism of concomitant nucleation of form II and ethanol solvate of spironolactone in cooling crystallization†
Received
6th December 2017
, Accepted 23rd February 2018
First published on 7th March 2018
Abstract
The concomitant crystallization of spironolactone form II and its ethanol solvate was investigated in ethanol by means of process analytical techniques, such as particle vision and measurement (PVM), focused beam reflectance measurement (FBRM) and Raman spectroscopy. The concomitant crystals were characterized by optical microscopy, powder X-ray diffraction, differential scanning calorimetry and thermogravimetric analysis. Analysis results of primary nucleation kinetics based on the experimental data of the induction time show that the ethanol solvate is the kinetically favored form with a lower interfacial energy, a higher nucleation rate and a smaller radius of the critical nucleus, compared with form II. At a high supersaturation, the crystallization process is dominated by kinetic factors and only the ethanol solvate is obtained. Whereas, at a low supersaturation, only form II crystallizes out owing to its thermodynamic priority. At a moderate supersaturation, concomitant crystals are found as a result of their nearly equal nucleation rates. In summary, the real cause for concomitant crystallization of form II and ethanol solvate of spironolactone is their simultaneous nucleation.
1. Introduction
The phenomenon of concomitant crystallization, which refers to the simultaneous formation of two different polymorphs of a material in the same environment, has attracted much attention, especially in the pharmaceutical industry.1–5 The concomitant crystallization of an active pharmaceutical ingredient (API) causes the same crystal batch to have inconsistent physicochemical properties, such as a diffuse melting point and different shapes and solubilities, which lead to dramatic effects in bioavailability, stability and manufacturability.6–10 Therefore, controlling the formation of concomitant crystals is crucial. Studies on the underlying mechanism of concomitant crystallization can provide the theoretical basis for controlling the whole crystallization process to obtain the pure form, meanwhile, they can also provide more information compared with single phase crystallization, such as structures, nucleation and growth mechanisms.11
Many APIs can be crystallized in different solid-state forms during solution crystallization, including polymorphs and solvates. Solvates, sometimes called pseudopolymorphs, are the solvent molecules entering into the crystal lattice of the drug molecules.12,13 When drug substances are obtained from the solvent, either only one kind of polymorph or solvate can be obtained, or mixed different solvates and non-solvated polymorphs can appear, depending on the stoichiometry of solute and solvent molecules.14,15 In general, there are three possible types of concomitant crystallization: (i) the concomitant crystallization of non-solvated polymorphs; (ii) the concomitant crystallization of solvates; and (iii) the concomitant crystallization of a solvate and non-solvated polymorphs. So far, most researchers have devoted their efforts to investigate the concomitant crystallization of type (i) and (ii). Du et al.16 studied the concomitant polymorphism of prasugrel hydrochloride, and found that at a certain supersaturation, because of the relatively slow nucleation rate, form I lost its thermodynamic priority and the kinetic factor dominated the crystallization process; then form I simultaneously crystallized with form II which was kinetically favored. Das et al.17 noticed that the crystallization of hexakis(4-cyanophenyloxy)benzene from a mixture of two different solvents produces two different solvates concomitantly. Bhattacharya et al.18 reported that crystallization of 2,4,6-triethyl-1,3,5-tris(phenoxymethyl)-benzene from tetrachloromethane and tetrahydrofuran resulted in the concomitant formation of two solvates in each case, whereas crystallization from ethyl acetate resulted in the formation of a guest-free form along with an ethyl acetate solvate of the host. As for the concomitant crystallization of type (iii), only very few studies are reported in literature. Although Wang et al.19 reported the simultaneous crystallization of cefuroxime acid and its acetonitrile solvate, which proved the existence of concomitant crystallization of the solvate and non-solvent polymorph experimentally, the formation mechanism of concomitant crystallization of the solvate and non-solvent crystalline form was still unclear.
The aim of this work is to investigate the underlying mechanism of concomitant crystallization. Spironolactone (SPI, CAS Registry No. 52-01-7, Fig. 1), a potassium-sparing diuretic used in the treatment of refractory oedema, cirrhosis of the liver and nephrotic syndrome, was chosen as the model compound.20,21 Two polymorphs (form I and form II) and eight solvates (methanol, ethanol, acetonitrile, ethyl acetate, 1-propanol, 2-propanol, benzene, and water) of SPI have been reported.22–24 The concomitant crystallization of SPI form II and its ethanol solvate during cooling crystallization was investigated in the present work. This work included three detailed objectives: (1) determining the thermodynamic domains of the concomitant crystallization of SPI form II and its ethanol solvate, (2) confirming the thermodynamic stability and solubility of these two forms, and (3) deriving the kinetic factors from on-line crystallization measurements. A combination of analytical techniques such as optical microscopy, powder X-ray diffraction (PXRD), differential scanning calorimetry (DSC), and thermogravimetric analysis (TGA) were applied to identify the concomitant polymorphism. Raman spectroscopy, particle vision and measurement (PVM) and focused beam reflectance measurement (FBRM) were used in situ to monitor the cooling crystallization of SPI. The results obtained in this work will be important for understanding the mechanism of concomitant crystallization between a solvate and non-solvent polymorph, and designing robust crystallization processes for the pure forms.
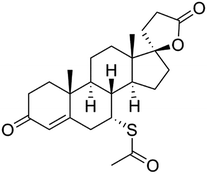 |
| | Fig. 1 Molecular structure of spironolactone. | |
2. Experimental
2.1 Materials
SPI (mass purity ≥ 99.8%) was supplied by Tianjin Jinjin Pharmaceutical Company of China and was used without further treatment. Analytical-grade ethanol (mass purity ≥ 99.8%) was purchased from Tianjin Yuanli Chemical Company of China.
2.2 Characterization of concomitant crystals
PXRD patterns were obtained using a Rigaku D/max-2500 X-ray powder diffractometer (Rigaku Co., Japan) at 40 kV and 100 mA with Cu Kα radiation (λ = 1.541845 Å). The measurements were carried out in a 2θ range of 2–30° at 298.15 K with a scanning rate of 8° step per s. The crystal morphologies were observed by an Olympus BX51 optical microscope with a magnification of 100×. DSC 1/500 (Mettler Toledo, Co., Switzerland) was operated under a nitrogen atmosphere and the temperature range was from 298.15 K to 503.15 K at a heating rate of 10 K min−1. TGA was carried out on a Mettler-Toledo model TGA 1/SF thermogravimetric analysis system (Mettler-Toledo, Switzerland) from 298.15 K to 503.15 K at a heating rate of 10 K min−1. Raman spectroscopy was carried out using a Raman RXN2 system (Kaiser Optical Systems, Inc., USA), and was applied to measure in situ the different crystal forms in the suspension. The FBRM system (Model M313.15K0LF) coupled with iC FBRM software from Mettler Toledo was employed to detect the induction time based on the profile of the total counts with time in the solution with a 10 s duration.
2.3 In situ measurements of cooling crystallization of SPI
Raman spectroscopy and PVM were applied in situ to monitor the cooling crystallization process of SPI. Solutions were prepared by dissolving 2.4–3.5 g of SPI (a mixture of form I and form II) in 30.0 g ethanol, which were maintained at about 333.15 K for 2 h to ensure that all particles were dissolved and that no detectable nucleation occurred during the filtration step. Following complete dissolution, the solutions at different concentrations were filtered through a preheated 0.2 μm syringe filter, transferred into a jacketed vessel, and then crash cooled to 313.15 K and 318.15 K, respectively. The solutions were kept under an agitation speed of 200 rpm. The crystals were isolated from the suspension quickly after nucleation to avoid potential polymorphic transformation, and were then dried and identified using optical microscopy, PXRD, DSC and TGA.
2.4 Solubility measurement
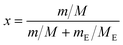
The solubility data of SPI form II and its ethanol solvate in ethanol was determined using a dynamic method over a range of temperatures from 308.15 K to 323.15 K, which was similar to the method described in the literature.25 A jacketed glass vessel (50 mL) with a magnetic stirrer was used to measure the solubility. The temperature of the solution was controlled by a refrigerated circulator (type CF41, Julabo, Germany) and verified by a mercury-in-glass thermometer with an uncertainty of ±0.05 K. The solute and the solvent were weighed with an electronic analytical balance (type AB204, Mettler Toledo, Switzerland) with an uncertainty of ±0.0001 g. The dissolution process of SPI was monitored by passing laser light through the vessel. At the beginning of the experiment, a predetermined amount of form II or the ethanol solvate of SPI was gradually added into a certain amount of ethanol, and the solution was stirred at constant temperature. The laser intensity reached its maximum when the solute dissolved completely. Then, a known amount of solute (1.0–5.0 mg) was added into the vessel repeatedly until the laser intensity could not return to the maximum. The amount of solute which resulted in the laser intensity decreasing 10% from the maximum was less than 1.0 mg. The total amount of SPI forms consumed was labelled the solubility under the given temperature. To ensure the accuracy of the solubility point, each experiment was repeated three times and the average value was used to calculate the solubility. The solubility could be measured by calculating the mass of the dissolved solute and the mass of the solvent used. The mole fraction solubility of the solute (x) in solution was calculated as follows:| |
 | (1) |
where m and mE are the mass of form II or the mass of the ethanol solvate of SPI and the mass of ethanol, respectively. M and ME are the molecular mass of form II or the molecular mass of the ethanol solvate of SPI and the molecular mass of ethanol, respectively.
2.5 Induction time measurements
The induction time was measured at the supersaturation ratios (S = c/c*) in the range of 1.1–2.0 at two different temperatures (313.15 K and 318.15 K). The supersaturated solutions of SPI were stirred for 30 min at a temperature which was 20 K above the equilibrium temperature to ensure complete dissolution and then fast cooled to the set temperature to obtain the required level of supersaturation. The solution was stirred at experimental temperature until nucleation was detected in situ by FBRM. The induction time, tind, refers to the time that elapsed after the creation of the target supersaturation in solution until a new phase was detected, which is the experimentally accessible quantity. Three experiments were carried out for each condition to ensure the accuracy. PXRD and optical microscopy were used to determine the polymorphic state of the crystals.
3. Theory basis
Crystallization is a process involving phase conversion, which generates a new separate solid phase. The existence of the phase boundary is associated with an activated energy barrier which must be offset in the nucleation process by the overall loss of free energy.5 The change in the free energy in this process is the sum of the surface free energy, ΔGs, and the volume free energy, ΔGv, which can be expressed by the following eqn (2):
For non-spherical crystals, ΔG can be written as:
| | |
ΔG = 4fsγr2 + 8fvr3ΔGv
| (3) |
where
fs and
fv are the surface and volume shape factors, respectively, Δ
Gv is the free energy per unit volume,
r is the radius of the crystals, and
γ is the interfacial free energy.
26 The values of
fs and
fv (Table S2
†) are estimated from optical microscope images of the crystals.
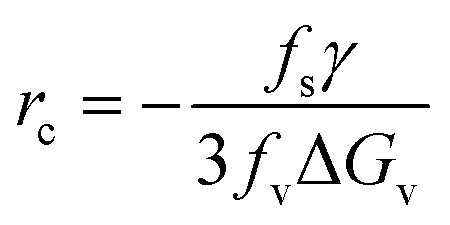
According to the kinetic theory of nucleation which was recognized in 1939 by Volmer, energy barriers are relevant to the radius of a crystal nucleus.27 The critical size is the assembly of molecules which must be stabilized in order for further growth to occur. So the critical size of the nuclei can be obtained by setting d(ΔG)/dr = 0, which can be written as follows:
| |
 | (4) |
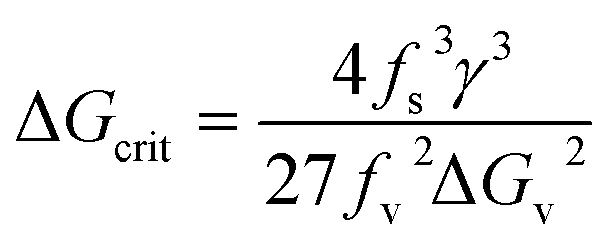
Then the critical free energy becomes
| |
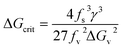 | (5) |
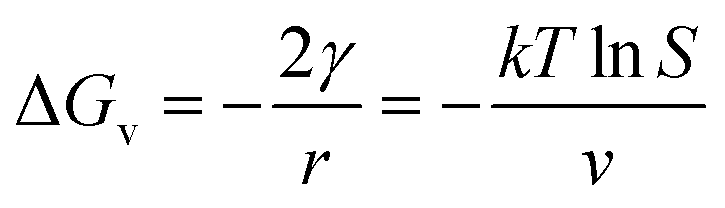
and the basic Gibbs–Thomson relationship28 for a non-electrolyte may be written as
| |
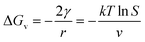 | (6) |
where
k is the Boltzmann constant,
T is the absolute temperature,
ν is the molecular volume and
S is the supersaturation.
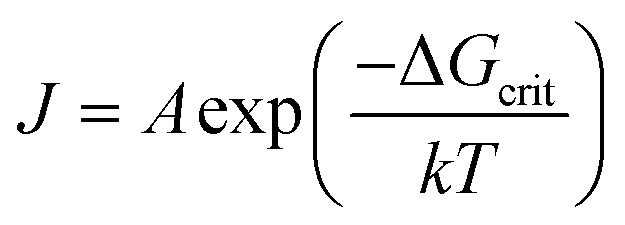
According to the Arrhenius equation,29,30 the nucleation rate (J) can be given as follows:
| |
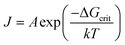 | (7) |
From eqn (4), (5) and (7), the nucleation rate equation can be written as:
| |
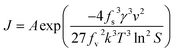 | (8) |
where
A is the pre-exponential factor which has different expressions due to the model used for describing the kinetics association. The expression for
A was proposed as follows:
31,32| |
 | (9) |
where
Dsl is the diffusion coefficient of the solute in the solvent,
dm is the molecular diameter, and
C is the solution concentration.
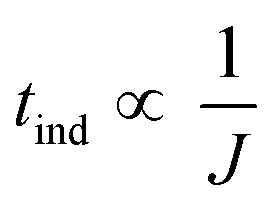
As proposed by Kashchiev et al.33 the measured induction time allows for a connection to be made between nucleation theory and experimental investigation. The induction time is inversely proportional to the nucleation rate and can only be justified when the data relate to true homogeneous nucleation and the nucleation time is much greater than the growth time.
| |
 | (10) |
Thus, eqn (8) can be rewritten as:
| |
 | (11) |
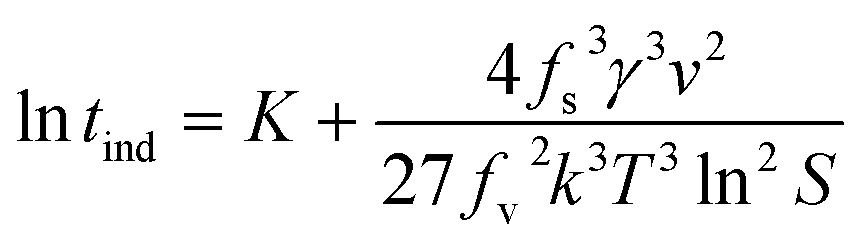
From eqn (8), ln![[thin space (1/6-em)]](https://www.rsc.org/images/entities/char_2009.gif) tind and 1/(lnS)2 have a linear relationship, and the slope is
tind and 1/(lnS)2 have a linear relationship, and the slope is
| |
 | (12) |
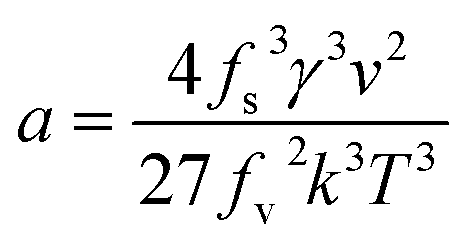
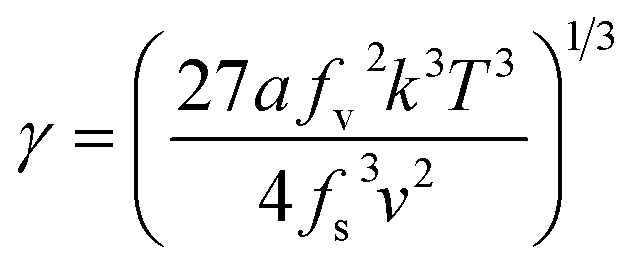
Therefore, the interfacial energy can be obtained from the slope,
| |
 | (13) |
For a dimorphic system, the crystallizability of the solute from solution can be represented by the interfacial energy and critical size of the nuclei. Furthermore, the nucleation rate of different forms will affect the form of the product.
4. Results and discussion
4.1 Identification and characterization of concomitant crystals
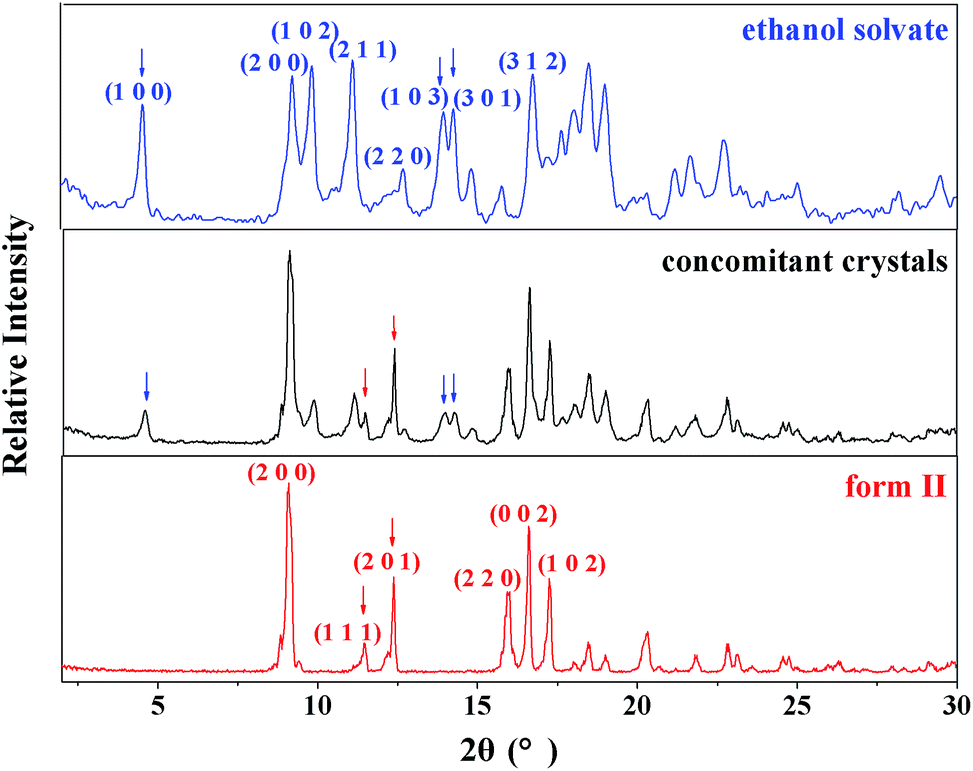
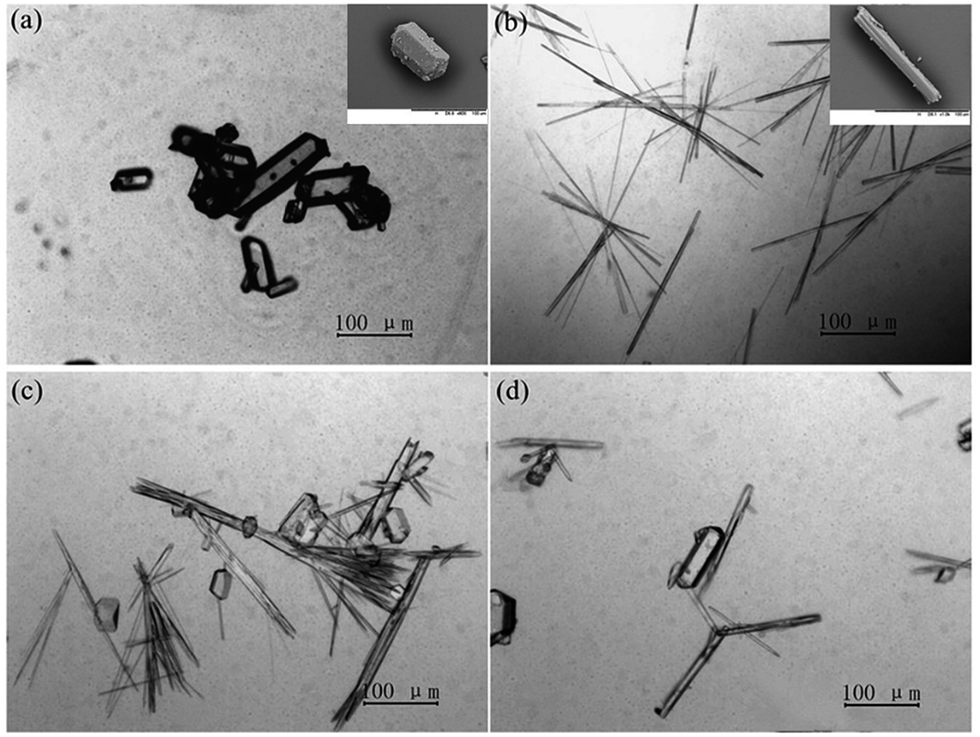
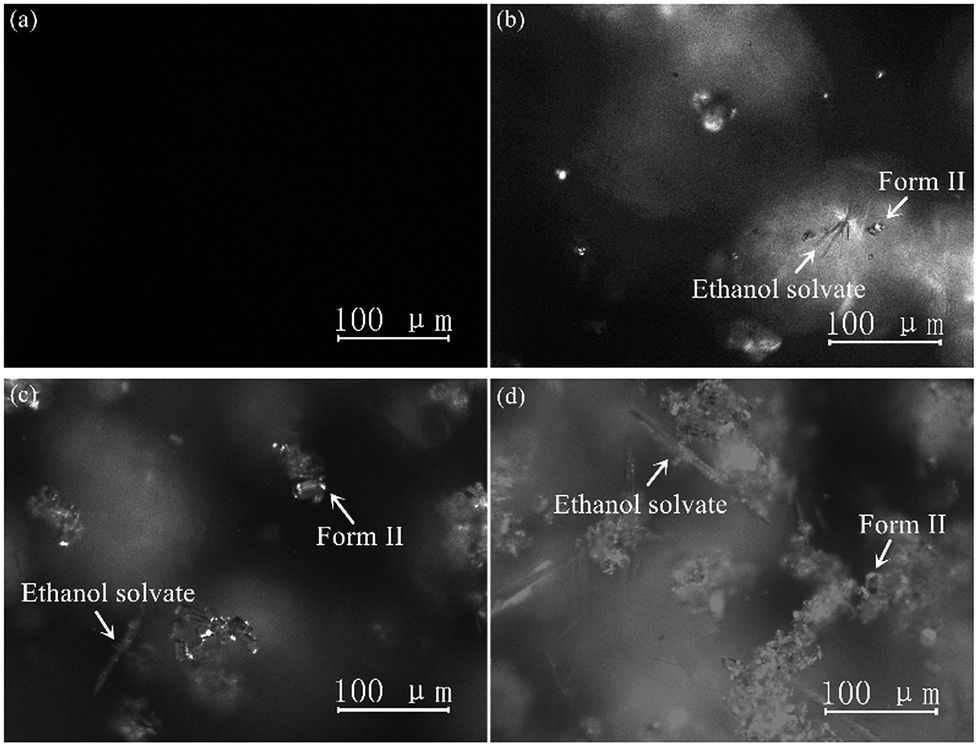
The PXRD patterns of SPI pure form II and its ethanol solvate are shown in Fig. 2, which coincide with the data reported in the literature.22 SPI form II exhibits a rich spectrum with the main diffraction peaks at 2θ = 9.24°, 11.46°, 12.39°, 16.00°, 16.66° and 17.32° corresponding to the (200), (111), (201), (220), (002) and (102) crystal planes, and (111) and (201) can be chosen as the characteristic planes. The diffraction peaks at 2θ = 4.53°, 9.86°, 13.98° and 14.28° correspond to the (100), (102), (103) and (301) crystal planes, which are the characteristic peaks of the ethanol solvate. The PXRD pattern of the obtained product from cooling crystallization clearly contains characteristic peaks at 4.53°, 11.46° and 14.28°, which indicates that both SPI form II and its ethanol solvate were produced. The concomitant crystals of SPI form II and its ethanol solvate can also be verified by the morphology measurement. As shown in Fig. 3, the crystal morphologies of form II and the ethanol solvate of SPI are different under an optical microscope. The habit of form II is a transparent prism, while that of the ethanol solvate is a needle, and the obtained product was observed to have two different habits at the same time, and contains the crystals of form II and the ethanol solvate.
 |
| | Fig. 2 Powder X-ray diffraction (PXRD) spectra of both forms and the concomitant crystals. | |
 |
| | Fig. 3 Crystal habits of (a) form II and (b) ethanol solvate and (c) and (d) concomitant crystals of forms II and the ethanol solvate of SPI. | |
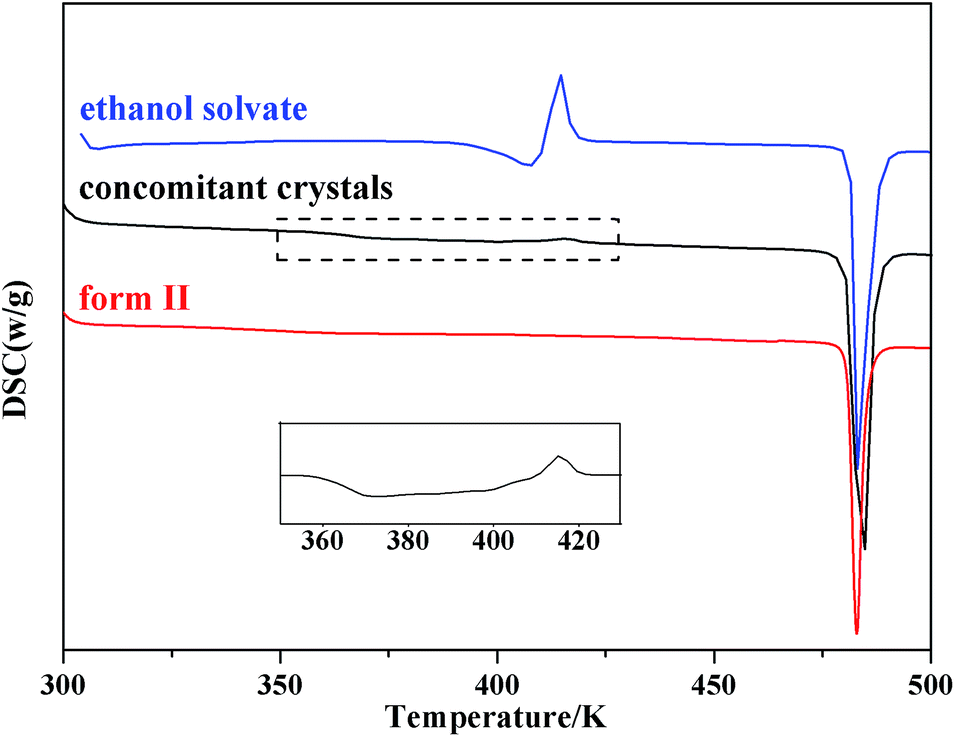
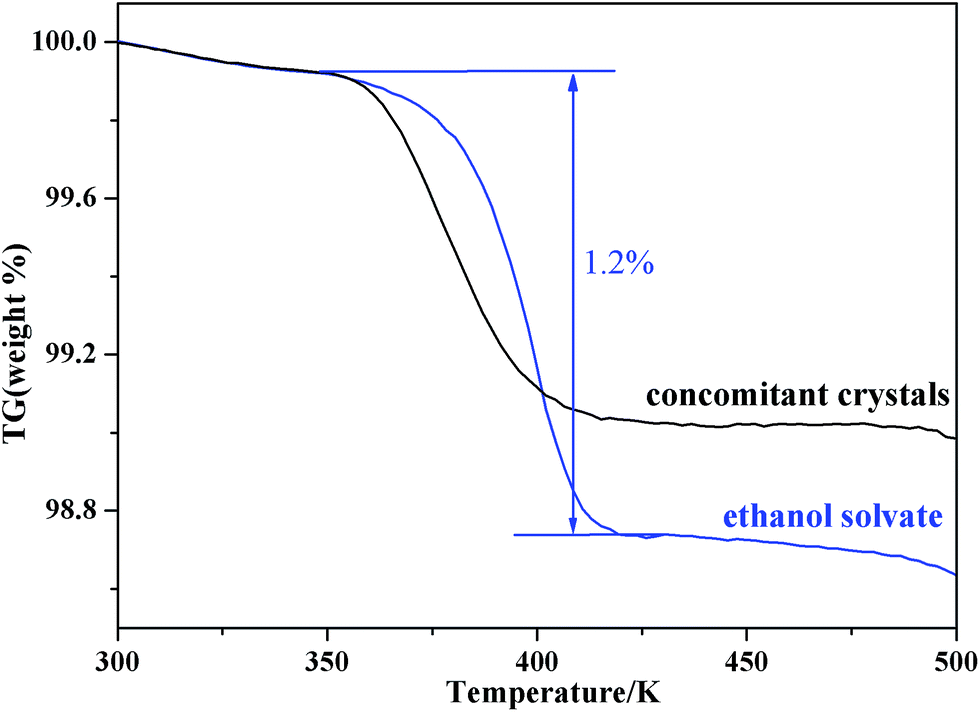
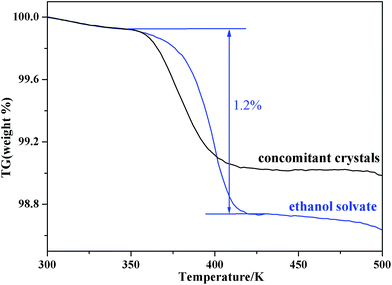
DSC thermograms of the two pure forms and the concomitant crystals are shown in Fig. 4. Both form II and the ethanol solvate have an endothermic peak at 482.7 K, which is consistent with the melting point of form II. Meanwhile, the DSC thermogram of the ethanol solvate exhibits an endotherm–exotherm doublet (407.5 K and 414.7 K, respectively), which corresponds to the fact that the ethanol solvate first desolvates and then transforms into form II, and the transformation is exothermic. The TGA thermogram (Fig. 5) of the ethanol solvate shows a stage of solvent loss at 350.1 K, and the weight loss is about 1.2%, which is consistent with that in literature.33 Beckstead and Neville found by elemental microanalyses that ethanol solvate was mono-solvated, and it only partially lost the solvent at the desolvated temperature before the onset of melting.34,35 For the concomitant crystals, a wide desolvation endotherm peak and a small transformation exothermic peak were observed in the DSC thermogram. The existence of form II in the concomitant crystals might act as a form of seeding and induce the process of desolvation and transformation. Thus, concomitant crystals could begin to desolvate and transform at lower temperatures compared with the pure ethanol solvate, which is also verified by the TGA thermogram. Meanwhile, the endotherm peak and exotherm peak are offset partially, which leads to the inconspicuous doublet.
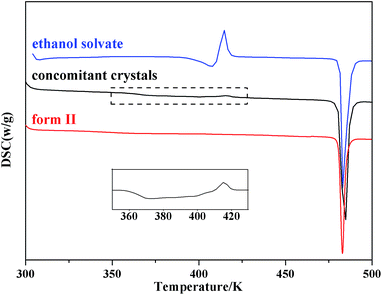 |
| | Fig. 4 DSC thermograms of both forms and the concomitant crystals. | |
 |
| | Fig. 5 TGA thermograms of the ethanol solvate and the concomitant crystals. | |
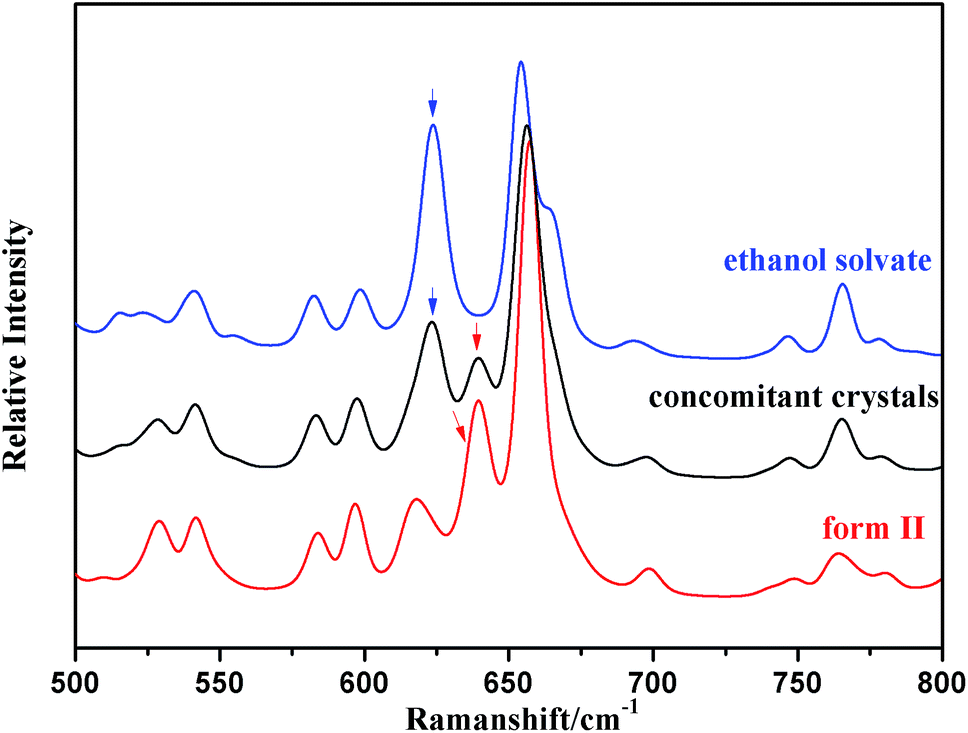
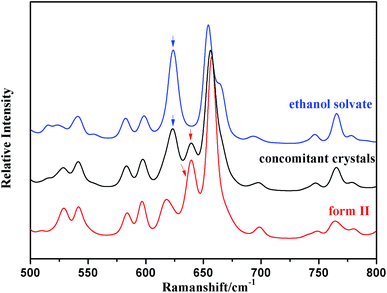
Raman spectra of solid-state pure form II and the ethanol solvate were respectively recorded and are shown in Fig. 6. The Raman spectra of these two forms present clear differences in the Raman shift range of 600–650 cm−1, which belongs to the region of the C–S bond vibration. Form II of SPI has a unique peak at 641 cm−1, while the characteristic peak of the ethanol solvate is shown at 625 cm−1, which may be due to the different molecular conformations of form II and the ethanol solvate.22 The mixture of SPI form II and its ethanol solvate was identified successfully by Raman spectroscopy, which was therefore applied in situ to monitor the crystallization process.
 |
| | Fig. 6 Raman spectra for both forms and the concomitant crystals of SPI. | |
4.2 In situ measurement of SPI cooling crystallization
According to Ostwald’s rule, the metastable form is prone to transform into the stable form. In order to determine whether the concomitant crystals are the result of primary nucleation or of incomplete transformation of the metastable form, cooling crystallization experiments were monitored in situ by Raman spectroscopy and PVM.
The profile of the crystal size and the morphology with time in concomitant crystallization could be clearly observed with in situ PVM. As shown in Fig. 7, four frames from a sequence of microscopic images recorded every 10 s illustrate the appearance and growth of the different forms. The solution was clear without solids, when the system was maintained within the induction period. Then form II and the ethanol solvate were observed at the same time, indicating that these two forms nucleate simultaneously. It is shown in Fig. 7d that the crystals of both these two forms grow concomitantly and no polymorphic transformation was detected within the investigated time range.
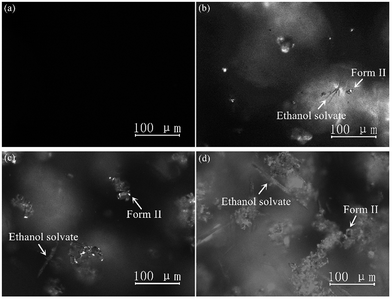 |
| | Fig. 7 Photos of real time nucleation by PVM: (a) 0 min, (b) 150 min, (c) 170 min, and (d) 200 min. | |
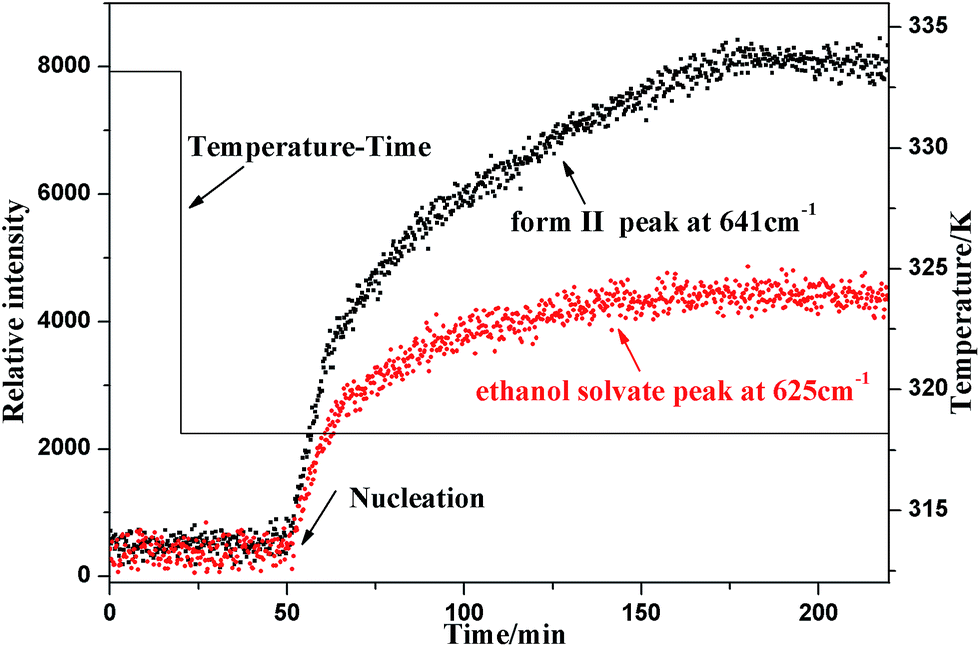
The real time results of Raman spectroscopy are plotted in Fig. 8, from which it can be seen that the characteristic peaks of form II and the ethanol solvate grew simultaneously from the very point when the solution started to nucleate, verifying that SPI form II and its ethanol solvate appeared concomitantly. Then the Raman intensities of both form II and the ethanol solvate characteristic peaks reached a maximum and remained constant.
 |
| | Fig. 8 Real time change of the characteristic Raman spectra peaks of form II and the ethanol solvate during cooling crystallization. | |
From the results of both on-line PVM and Raman spectroscopy, it can be concluded that the occurrence of form II and the ethanol solvate is a primary nucleation process and not a polymorphic transformation. Thus, simultaneous nucleation of both forms should be the real reason for the concomitant polymorphism.
4.3 Solubility of SPI form II and its ethanol solvate
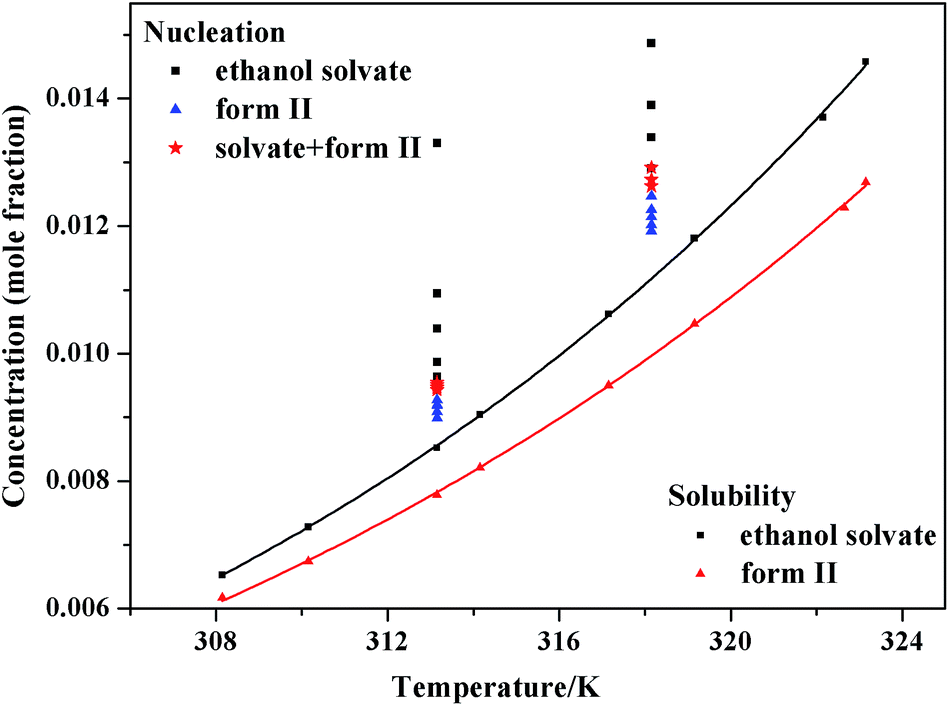
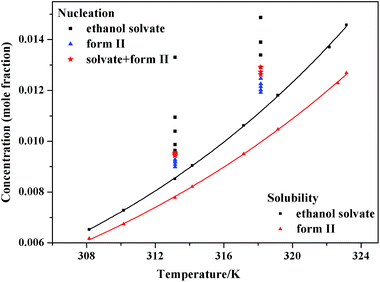
The relationship between the experimental solubility and the temperature of SPI form II and its ethanol solvate of SPI is graphically shown in Fig. 9, from which it can be seen that the solubility of these two forms increases with increasing temperature. The solubility of ethanol solvate is higher than that of form II in the temperature range of 308.15–323.15 K, indicating that the ethanol solvate is the metastable form, and form II is the stable form at the investigated temperatures.
 |
| | Fig. 9 Polymorphic nucleation results with concentration relative to solubility. | |
To better understand the trend of the solubility, the experimental values of the solubility are correlated with the modified Apelblat equation.36 The obtained model parameters and the coefficient of determination (R2) are given in Table 1, from which it can be seen that the values of R2 are higher than 0.99 for both these two forms, so the modified Apelblat equation can give correlation results with satisfactory accuracy.
| |
 | (14) |
where
x is the mole fraction solubility of spironolactone form II or the ethanol solvate,
A,
B and
C are the equation parameters, and
T is the absolute temperature.
Table 1 Parameters and coefficients of determination of the modified Apelblat equation for the solubility of form II and the ethanol solvate of SPI
| Parameters |
A |
B |
C |
R2 |
| Form II |
−85.738 |
−318.100 |
14.252 |
0.999 |
| Ethanol solvate |
−95.517 |
−278.834 |
15.948 |
0.999 |
4.4 Nucleation kinetics of SPI form II and the ethanol solvate
The pathway of polymorph nucleation depends on supersaturation of the initial solution. In order to understand the influence of supersaturation on the polymorphism of SPI, fast cooling crystallizations with varied supersaturation ratios were designed. The relationship between the forms of obtained product and the initial concentration of the solution at 313.15 K and 318.15 K in the cooling crystallization experiment is shown in Fig. 9. It can clearly be seen that only form II was obtained when the concentration was below 0.0094 at 313.15 K. The ethanol solvate was obtained alone when the concentration of the solution was above 0.0097, and the concomitant crystals of form II and the ethanol solvate were observed when the concentration was between 0.0094 and 0.0097 at 313.15 K. Both the needle-like and transparent prism morphologies were observed in the optical microscope images shown in Fig. 2. When the concentration was between 0.0124 and 0.0129, concomitant crystals could also be observed at 318.15 K. The occurrence of a similar phenomenon has been reported for other compounds such as eflucimibe and prasugrel hydrochloride.14,32 Considering only thermodynamic factors, the stable form II should always be obtained in the system. However, according to Ostwald’s rule, the metastable ethanol solvate is the kinetically favored form and should crystallize first. When the supersaturation is high enough, kinetic factors will dominate the crystallization process, and the ethanol solvate may be obtained preferentially. Thus, it is conceivable that when the subtle interplay between the kinetic and thermodynamic factors reaches a balanced state in the crystallization process, concomitant crystals might be observed at the intermediate supersaturations.
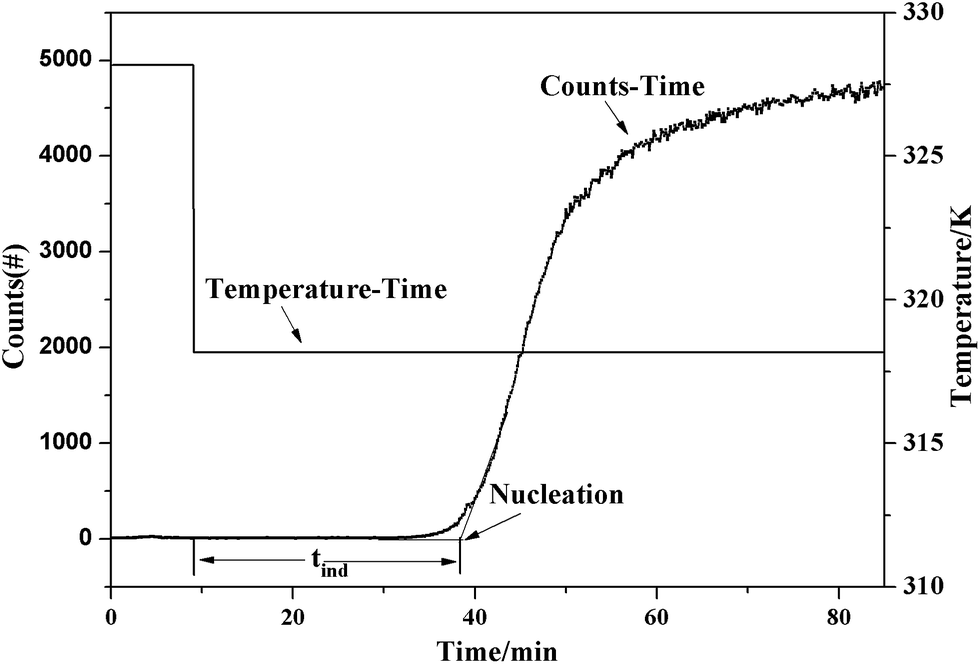
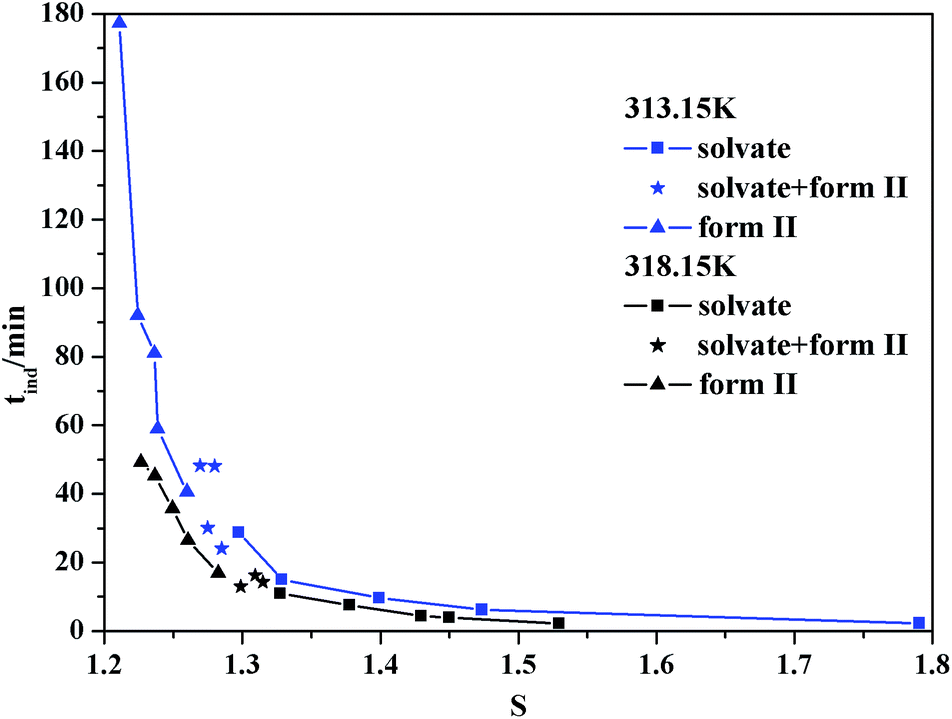
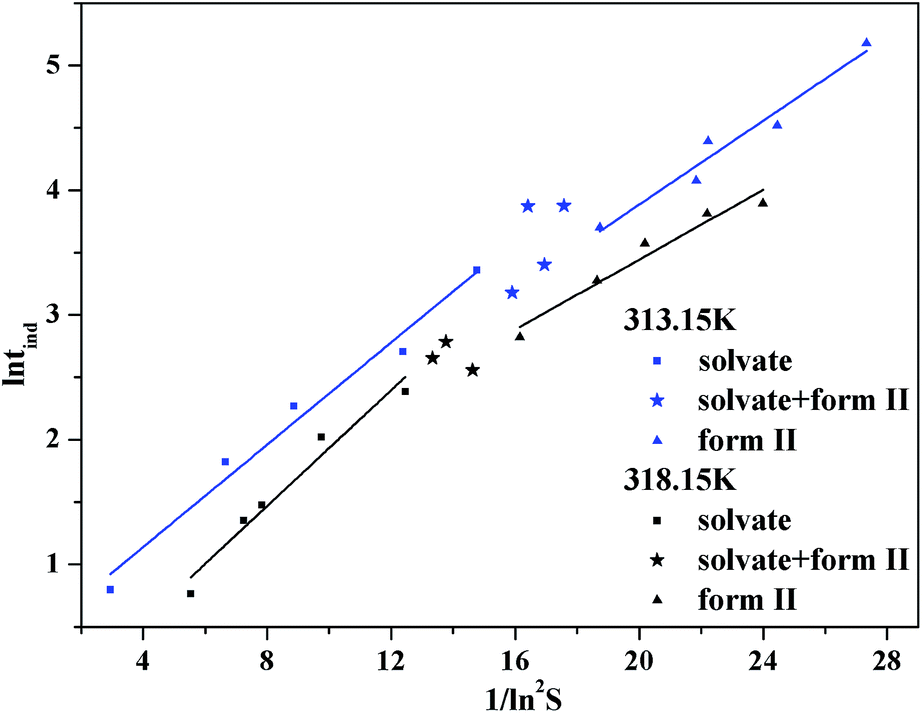
To further understand the effect of kinetic factors on concomitant crystallization, nucleation kinetics were investigated in detail. Induction time, recorded by FBRM, is shown in Fig. 10. The result is a plot of counts versus time from where tind was determined by drawing regression lines through the two distinct linear regions and regarding the intersection point as the value. The profile of the induction period with supersaturation at 313.15 K and 318.15 K is shown in Fig. 11. In this study, the induction period is fitted to find different possible mechanisms that are responsible for the loss of the metastability. The results show that the best agreement (according to the square coefficient) is obtained for the mononuclear mechanism in Table 2. Thus, the induction time is governed only by the rate of primary nucleation, and it can be simplified to eqn (10), which is shown in the ESI.† To further analyze the nucleation process, the plot of ln(tind) versus 1/(ln2S) according to eqn (11) is shown in Fig. 12. There are two distinct nucleation regions with different slopes. The straight line, established at lower supersaturation with a lower slope, indicates the nucleation of form II, while at high supersaturation with a higher slope, the ethanol solvate nucleated. Therefore, the two straight lines in Fig. 12 are the primary nucleation of the two different forms of SPI.
 |
| | Fig. 10 Induction time measurement with FBRM at 318.15 K, S = 1.25. | |
 |
| | Fig. 11 Dependence of the induction time on the supersaturation ratio and the nature of the polymorph that nucleated at 313.15 and 318.15 K. | |
Table 2 Results of regression analysis of F(S) versus 1/ln2(S) and the related possible values of ν for ethanol solvate (with m = 1) and form II (with m = 3)
| Growth mechanism |
v |
F(S) |
R2 (ethanol solvate) |
R2 (form II) |
| 40 °C |
45 °C |
40 °C |
45 °C |
| No growth |
|
ln(Stind) |
0.983 |
0.983 |
0.957 |
0.953 |
| Normal growth |
1 |
ln{S1/n[(S − 1)](n−1)/ntind} |
0.980 |
0.958 |
0.922 |
0.800 |
| Spiral growth |
1 |
ln{S1/n[(S − 1)2](n−1)/ntind} |
0.965 |
0.951 |
0.906 |
0.769 |
| Diffusion controlled growth |
1/2 |
ln{S1/n[(S − 1)](n−1)/ntind} |
0.981 |
0.960 |
0.924 |
0.804 |
| 2D nucleation mediated growth |
1 |
ln[(S − 1)2(n−1)/3nS(n+2)/3ntind] |
0.967 |
0.965 |
0.937 |
0.933 |
 |
| | Fig. 12 The plot of lntind versus 1/(ln2S) of SPI solutions at 313.15 and 318.15 K. | |
The value of interfacial energy can serve as an indicator of the ability of the solute to crystallize from solution spontaneously, and the higher the value is, the more difficult it is for the solute to crystallize, and the value can be calculated from the slopes of the straight lines in the two regions of supersaturation at 313.15 K and 318.15 K, respectively. The results between 0.916 and 1.976 mJ m−2 are listed in Table 3, and are similar to those studied on other poorly water soluble substances.32,37 The interfacial energies of these two forms at the same temperature are different. Using eqn (4) and the value of the interfacial energy, the radius of the critical nucleus can be derived. It can be seen that when the critical size is lower, the activation energy barrier for nucleation is lower. The radius of the critical nucleus ranges from 2.16 to 7.6 Å at experimental supersaturation and is shown in Fig. 13. As the interfacial energy and the critical size of the stable form II are higher than those for the ethanol solvate, nucleation of the ethanol solvate will be easier and should be the kinetically favored form. Thus, concomitant crystallization might be possible when both kinetics and thermodynamics dominate the crystallization process.
Table 3 Interfacial energy γ (mJ m−2) for form II and the ethanol solvate
| |
313.15 K |
318.15 K |
| Form II |
1.976 |
1.894 |
| Ethanol solvate |
0.916 |
0.945 |
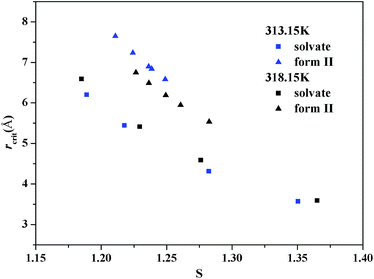 |
| | Fig. 13 Dependence of the radius of the critical nucleus on the supersaturation ratio at 313.15 and 318.15 K. | |
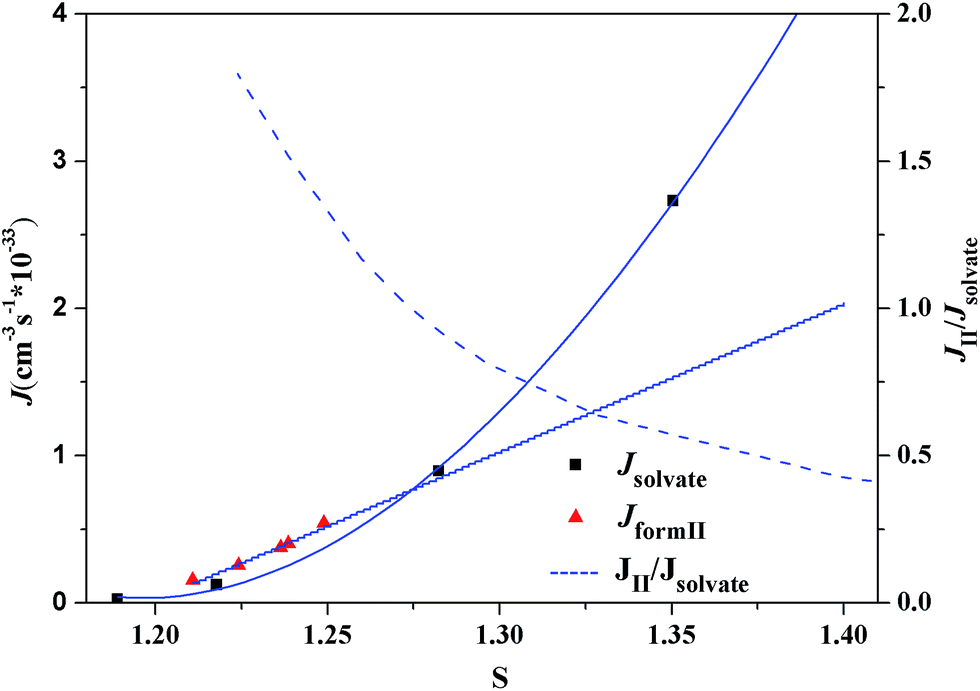
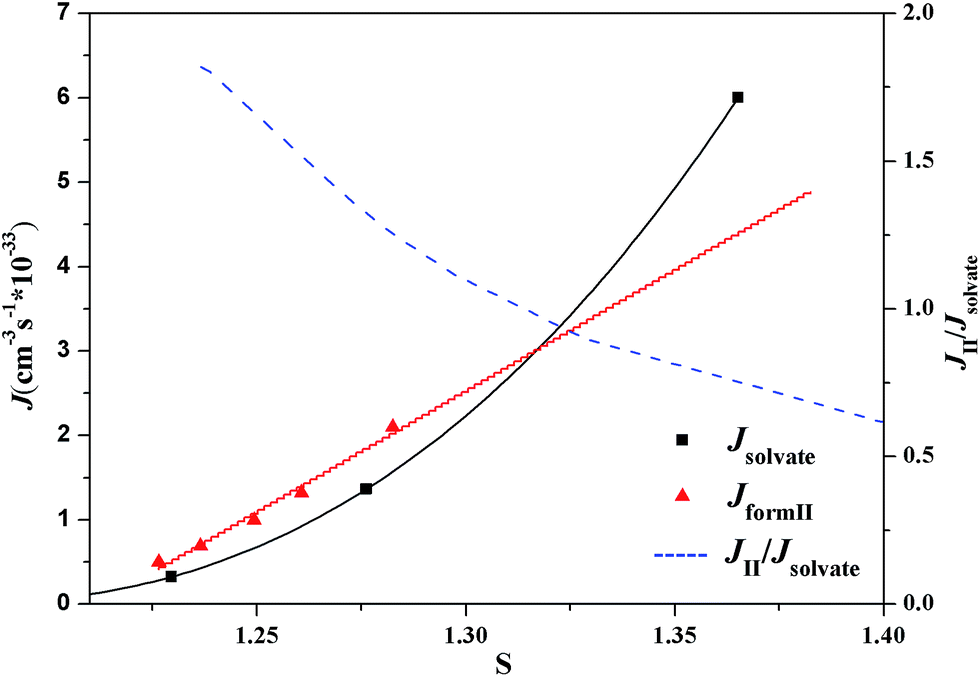
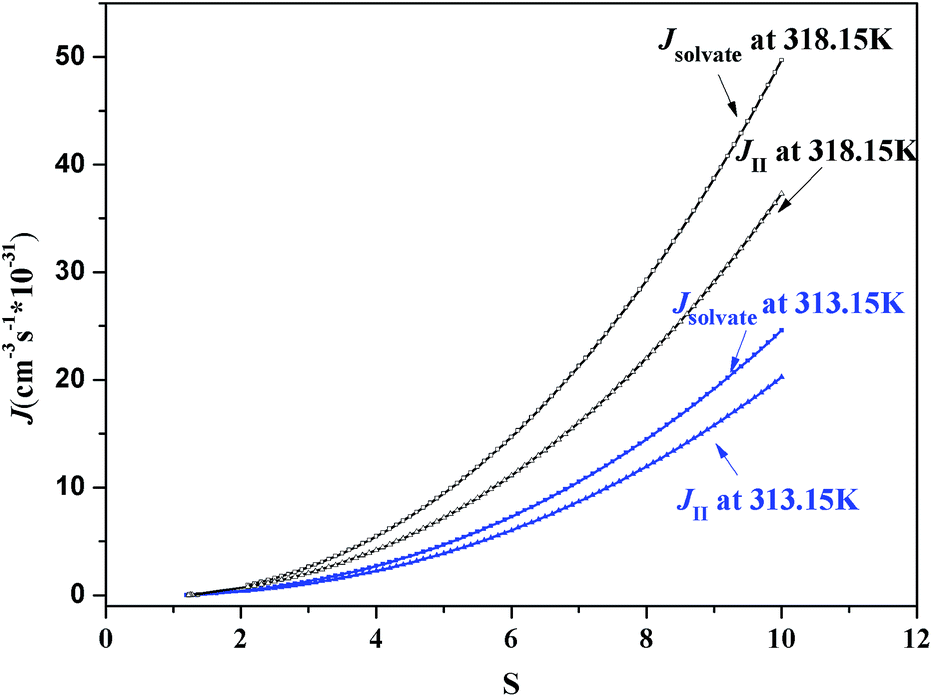
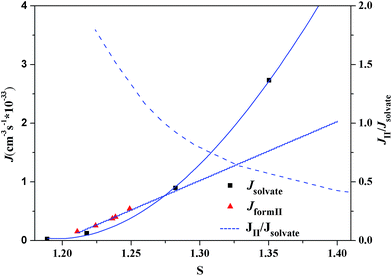
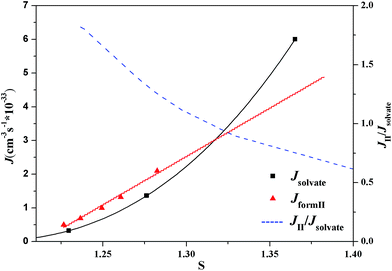
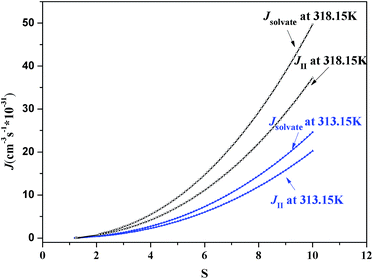
According to the classical nucleation theory, the nucleation rates of form II and the ethanol solvate of SPI can be calculated using eqn (8). At different crystallization temperatures, the evolutions of the nucleation rate and the nucleation ratio (Jform II/Jsolvate) of these two forms are shown in Fig. 14 and 15, respectively. From the two figures, it is possible to predict the appearance of each form theoretically and explain the occurrence of concomitant polymorphism. It can be seen that at lower supersaturation (S < 1.27) only form II was observed at 313.15 K due to the fact that form II is the stable form considering the thermodynamics. When the nucleation rates of the stable form II and the metastable form are equal at S = 1.27, their appearance probabilities would be nearly the same, leading to concomitant polymorphism. Kinetic factors will dominate the crystallization process with the increase of supersaturation. At S > 1.27, the nucleation of ethanol solvate is faster compared to that of form II, as shown in Fig. 16, so only the ethanol solvate crystallizes. A similar result can also be obtained at 318.15 K. When S = 1.32, these two forms have nearly the same nucleation rate, resulting in their simultaneous appearance.
 |
| | Fig. 14 Dependence of the nucleation rates and the nucleation rate ratio of SPI polymorphs at 313.15 K as a function of the supersaturation degree. | |
 |
| | Fig. 15 Dependence of the nucleation rates and the nucleation rate ratio of SPI polymorphs at 318.15 K as a function of the supersaturation degree. | |
 |
| | Fig. 16 Dependence of relative nucleation rates of SPI polymorphs at 313.15 and 318.15 K as a function of the supersaturation ratio. | |
It can also be seen from Fig. 11 that concomitant crystals will be observed at a higher supersaturation when the temperature increases. This might be explained by the change in interfacial energy. The interfacial energy of the stable form II decreases as the temperature increases, indicating an easier nucleation process, while that of the metastable ethanol solvate is reversed. More experiments have been performed for further study. Around S > 1.2, only the ethanol solvate can be obtained at 303.15 K. Meanwhile, at S < 1.4, only form II crystallized at 323.15 K. Although the nucleation rate of the ethanol solvate increased, the change in interfacial energy may have a greater impact on the crystallization process. Thus, it can be concluded that stable form II is easier to crystallize while the metastable ethanol solvent is more difficult to be obtained when the temperature is increased.
5. Conclusions
The concomitant crystallization of SPI form II and its ethanol solvate during fast cooling crystallization in ethanol was studied in detail by on-line analytical techniques, including Raman spectroscopy, FBRM and PVM. It was found that the above two crystalline forms nucleated simultaneously within a certain supersaturation range. Although form II is the thermodynamically stable form, the results calculated from the induction time data showed that ethanol solvate is the kinetically favored form with lower interfacial energy and a smaller critical nucleus. Thus, the subtle interplay between the thermodynamic and kinetic factors of the crystallization process determines the appearance of concomitant nucleation of these two forms. At a high supersaturation, only the ethanol solvate is obtained because the nucleation rate of ethanol solvate is greater than that of form II. Contrarily, at a low supersaturation, the crystallization process is dominated by the thermodynamic factors and only the stable form II crystallizes out. Nevertheless, concomitant crystals of these two forms occur at a moderate supersaturation due to their nearly equal nucleation rates. The results presented in this work will provide a guide to control the formation of a target form product of spironolactone during the cooling crystallization process.
Conflicts of interest
There are no conflicts to declare
Acknowledgements
The authors are grateful for the financial support of the National Natural Science Foundation of China (No. 21506162), the Tianjin Municipal Natural Science Foundation (No. 16JCZDJC32700), and the Major National Scientific Instrument Development Project (No. 21527812).
References
- J. Bernstein, R. J. Davey and J. O. Henck, Angew. Chem., Int. Ed., 1999, 38, 3440–3461 CrossRef PubMed.
- R. Chang, Q. Fu, P. Yu, L. Wang, Y. Li, W. Du, C. Chang and A. Zeng, RSC Adv., 2016, 6, 85063–85073 RSC.
- F. Wöhler and J. Liebig, Ann. Pharm., 1832, 3, 249–282 CrossRef.
- P. Munshi, K. N. Venugopala, B. S. Jayashree and T. N. Guru Row, Cryst. Growth Des., 2004, 4, 1105–1107 CAS.
- J. Horst, H. Kramer and P. Jansens, Cryst. Growth Des., 2002, 2, 351–356 Search PubMed.
- A. J. Cruz-Cabeza and J. Bernstein, Chem. Rev., 2014, 114, 2170–2191 CrossRef CAS PubMed.
- G. R. Desiraju, J. Am. Chem. Soc., 2013, 135, 9952–9967 CrossRef CAS PubMed.
- L. Zhou, Q. Yin, X. Zhang, S. Du, H. Hao and B. Hou, RSC Adv., 2016, 6, 51037–51045 RSC.
- X. Xiong, Q. Du, X. Zeng, J. He, H. Yang and H. Li, RSC Adv., 2017, 7, 23279–23286 RSC.
- S. Jiang, J. H. ter Horst and P. J. Jansens, Cryst. Growth Des., 2007, 8, 37–43 Search PubMed.
- R. Hilfiker, Polymorphism in the Pharmaceutical Industry, Wiley-VCH, Weinheim, 2006, pp. 1–3 Search PubMed.
- J. Horst, H. Kramer and P. Jansens, Cryst. Growth Des., 2002, 2, 351–356 Search PubMed.
- L. Y. Zhu, L. Wang, Z. Sha, Y. Wang and L. Yang, Cryst. Growth Des., 2017, 17, 4582–4595 CAS.
- S. S. El-Dalsh, A. A. El-Sayed, A. A. Badawi, F. I. Khattab and A. Fouli, Drug Dev. Ind. Pharm., 2008, 9, 877–894 CrossRef.
- Z. Shi, Z. Wang, T. Zhang, L. Dang and H. Wei, RSC Adv., 2015, 5, 98050–98056 RSC.
- W. Du, Q. Yin, Y. Bao, C. Xie, B. Hou, H. Hao and W. Chen, Ind. Eng. Chem. Res., 2013, 52, 16182–16189 CrossRef CAS.
- D. Das and L. J. Barbour, Chem. Commun., 2008, 41, 5110–5112 RSC.
- S. Bhattacharya and B. K. Saha, Cryst. Growth Des., 2013, 13, 606–613 CAS.
- G. Wang, Y. Wang, Y. Ma, H. Hao, H. Wang and J. Zhang, Ind. Eng. Chem. Res., 2014, 53, 14028–14035 CrossRef CAS.
- K. Katagiri, T. Kato, H. Masu, M. Tominaga and I. Azumaya, Cryst. Growth Des., 2009, 9, 1519–1524 CAS.
- J. Zhang, Y. Wang, G. Wang, H. Hao, H. Wang, Q. Luan and C. Jiang, J. Chem. Thermodyn., 2014, 79, 61–68 CrossRef CAS.
- C. Jiang, J. Yan, Y. Wang, J. Zhang, G. Wang, J. Yang and H. Hao, Ind. Eng. Chem. Res., 2015, 54, 11222–11229 CrossRef CAS.
- V. Agafonov, B. Legendre, N. Rodier, D. Wouessidjewe and J. M. Cense, J. Pharm. Sci., 1991, 80, 181–185 CrossRef CAS PubMed.
- N. Takata, R. Takano, H. Uekusa, Y. Hayashi and K. Terada, Cryst. Growth Des., 2010, 10, 2116–2122 CAS.
- Q. Chen, J. Wang and Y. Bao, Fluid Phase Equilib., 2012, 313, 182–189 CrossRef.
- A. Kuldipkumar, G. S. Kwon and G. G. Zhang, Cryst. Growth Des., 2007, 7, 234–242 CAS.
- D. Kashchiev, Nucleation: Basic Theory with Applications, Oxford, Butterworth, 2001 Search PubMed.
- H. J. Everett, PhD thesis, Iowa State University, 1976.
- M. Volmer, Kinetik der Phasenbildung, Theodor Steinkopff, Leipzig, 1939 Search PubMed.
- C. M. Roelands, J. H. ter Horst, H. J. Kramer and P. J. Jansens, Cryst. Growth Des., 2006, 6, 1380–1392 CAS.
- S. Teychené and B. Biscans, Cryst. Growth Des., 2008, 8, 1133–1139 Search PubMed.
- J. Liu, M. Svärd and Å. C. Rasmuson, Cryst. Growth Des., 2014, 14, 5521–5531 CAS.
- D. Kashchiev, D. Verdoes and G. M. van Rosmalen, J. Cryst. Growth, 1991, 110, 373–380 CrossRef.
- G. Neville, H. Beckstead and J. Cooney, Fresenius’ J. Anal. Chem., 1994, 349, 746 CrossRef CAS.
- H. D. Beckstead, G. A. Neville and H. F. Shurvell, Fresenius’ J. Anal. Chem., 1993, 345, 727–732 CrossRef CAS.
- A. Apelblat and E. Manzurola, J. Chem. Thermodyn., 1999, 31, 85–91 CrossRef CAS.
- R. A. Granberg, C. Ducreux, S. Gracin and Å. C. Rasmuson, Chem. Eng. Sci., 2001, 56, 2305–2313 CrossRef CAS.
Footnote |
| † Electronic supplementary information (ESI) available: Solubility and calculation of shape factors of these two forms are listed in Tables S1 and S2, respectively, and the simplification process of eqn (10). See DOI: 10.1039/c7ra13094e |
|
| This journal is © The Royal Society of Chemistry 2018 |
Click here to see how this site uses Cookies. View our privacy policy here. 
 Open Access Article
 This Open Access Article is licensed under a Creative Commons Attribution-Non Commercial 3.0 Unported Licence
 ac,
Lina Zhouac,
Xia Zhanga,
Chang Wanga,
Wei Du*b and
Ling Zhou*a
ac,
Lina Zhouac,
Xia Zhanga,
Chang Wanga,
Wei Du*b and
Ling Zhou*a