 Open Access Article
Creative Commons Attribution 3.0 Unported Licence
Feasibility of hard acid–base affinity for the pronounced adsorption capacity of manganese(II) using amino-functionalized graphene oxide
Anek Suddaia,
Prawit Nuengmatchaab,
Phitchan Sricharoena,
Nunticha Limchoowonga and
Saksit Chanthai *a
*a
aMaterials Chemistry Research Center, Department of Chemistry and Center of Excellence for Innovation in Chemistry, Faculty of Science, Khon Kaen University, Khon Kaen 40002, Thailand. E-mail: sakcha2@kku.ac.th
bNanomaterials Chemistry Research Unit, Department of Chemistry, Faculty of Science and Technology, Nakhon Si Thammarat Rajabhat University, Nakhon Si Thammarat 80280, Thailand
First published on 23rd January 2018
Abstract
The present study reveals the feasibility of using graphene oxide (GO) functionalized with 3-mercaptopropyl-trimethoxysilane (APTMS) for the removal of Mn(II) from aqueous solution. The APTMS bound on GO's surface was successfully confirmed by FTIR and EDX. For an optimal adsorption study, the effects of pH (pH 1–6), incubation time (5–80 min), temperature (30–60 °C) and initial concentration of Mn(II) (0.1–60 mg L−1) were investigated in association with Mn measurement by AAS. The optimum conditions for Mn(II) removal included a 20 mg L−1 initial concentration with 0.02 mg adsorbent at pH 5.5, and complete adsorption equilibrium was reached within 50 min. Their adsorption models are well described by both Langmuir and Freundlich isotherms. The maximum adsorption capacity of GO-NH2 for Mn(II) was 161.29 mg g−1, about 10 and 4 times higher than those of GP (16.45 mg g−1) and GO (41.67 mg g−1) according to their relevant functional groups. For the GO-NH2 adsorbent, the adsorption process of Mn(II) follows a pseudo-second-order kinetics model, indicating that the overall rate of Mn(II) uptake is controlled by external mass transfer at the initial stage of the adsorption. Later, the driving forces that control the adsorption rate are attributable to an intra-particle diffusion. A thermodynamic adsorption process reveals mainly an exothermic spontaneous reaction. Therefore, the present study provides an excellent adsorbent for Mn(II) from aqueous solution. This adsorbent can also potentially be used for wastewater treatment.
Introduction
Manganese (Mn) is an abundant element in the Earth's crust and its presence in drinking water is a result of leaching processes depending on rock types.1 Although, it is an essential nutrient element in living systems that is found most often in the +2 valence among various oxidation states, elevated levels of Mn content can result in toxic neurological effects.2 There are many neurotoxic effects that cause a series of symptoms, such as adynamia, reduced coordination, masklike face, gait changes, sleep disturbances, muscular pain, hallucinations, and mental irritability, finally leading to a manganese-induced Parkinson like disease, called manganism.3 Therefore, it is necessary to remove Mn ion contaminants from wastewater before release into the environment.Recently, numerous approaches have been studied for the development of effective technologies for pollutant removals.4–14 Several common wastewater treatments for Mn(II) have been studied, such as solvent extraction,15 biological aerated filter,16 precipitation,17 coagulation/flocculation,18 flotation,19 ion-exchange20 and adsorption.21 Of these above techniques, adsorption technique provides an attractive alternative one to other removal techniques because it is more economical and readily available.22 This technique relies on interactions between adsorbent and adsorbate. Thus, a key factor in the adsorption process is selective adsorbent with its intrinsic functional groups. Several adsorbents that have been studied for Mn removal include fly ash,21 manganese oxide coated zeolite,22 white rice husk ash,23 natural and modified zeolites,24 Pleurotus ostreatus nanoparticles,25 glycine modified chitosan resin26 and phosphine-functionalized electrospun poly(vinyl alcohol)/silica nanofibers.27 However, some of these adsorbents are still either low efficiency or low adsorption capacity, thus new adsorbents have been developed to maximize their adsorption property with higher capacity and selectivity.
Graphene oxide (GO) is an alternative choice of the carbon-based adsorbents due to various functional groups (carbonyl, hydroxyl and epoxide) on their surface providing anchor sites for metal ion complexation. Thus, there are many applications of GO for toxic metal adsorption such as Hg(II),28 U(VI),29 Pb(II),30 Cd(II),31 Cu(II) and Zn(II),32 Au(III), Pd(II) and Pt(IV).33 Moreover, GO can be modified with several ligands, making it a potential material as superb adsorbent for toxic metal ions removal such as 3-mercaptopropyl-trimethoxysilane,34 N-(trimethoxysilylpropyl) ethylenediaminetriacetic acid,35 polyallylamine,36 p-phenylenediamine,37 polyhedral oligomeric silsesquioxane,38 hexamethylene diamine,39 polybenzimidazole,40 2-amino-4,6-didodecylamino-1,3,5-triazine41 and other amino groups.42–44 Particularly, the amino group (–NH2) has high ability to adsorb both toxic metal ions and other pollutants. This unique characteristic reveals that the amino group has potential applications in the removal of pollutants from wastewater. Recently, many studies have tried to modify amino group on the surface of various materials for toxic pollutants removal and other applications such as mesoporous silica,45 silica,46 Fe3O4,47 mesoporous material SBA-16,48 multi-walled carbon nanotube,49 sawdust50 and Fe3O4@SiO2,51 indicating that the amino group is such high potential ligand for various applications.
In this study, the prepared GO was modified with 3-aminopropyl-trimethoxysilane (APTMS) to acquire the functionalized GO-NH2 and then applied to remove Mn(II) from aqueous solution. While there have been numerous papers reporting the fabrication of graphene-based adsorbents, there is no prior study on the synthesis of a GO-NH2 adsorbent and its performance in the removal of Mn(II) from aqueous solution. Hence, in the present research, it is the first time for a proof-of-concept study on the enhancement of adsorptive capacity of GO-NH2 via a batch technique. An evaluation of the potential use of the GO-NH2 for Mn(II) removal in a batch adsorption study was compared with its bare graphite (GP) and graphene oxide (GO). The effects of solution pH, incubation time and an initial concentration of Mn(II) were optimized in details. Both Langmuir and Freundlich isotherms were also investigated to fit their adsorption model for Mn(II) removal.
Experimental
Chemicals and instrument
Sodium nitrate, sulfuric acid, and hydrogen peroxide were purchased from Ajax FineChem Pty Ltd. Sodium acetate, acetic acid, potassium dihydrogen phosphate, di-potassium hydrogen phosphate anhydrous, ethanol, and methanol were purchased from QReC (New Zealand). Potassium permanganate and manganese chloride were purchased from Carlo Erba. Synthetic graphite power (<20 μm) and (3-aminopropyl)trimethoxysilane were purchased from Sigma-Aldrich. All chemicals were used without further purification in all experiments. Manganese was determined using atomic absorption spectrophotometer (AAS), Perkin Elmer Instrument AA Analyst 100 (U.S.A.).Preparation and characterization of GO and GO-NH2
Graphene oxide was prepared from graphite powder by using the optimum conditions of our previous work52 with the modified Hummers' method.53 In brief, 3.0 g of graphite powder and concentrated H2SO4 (300 mL) were mixed in a beaker at 0 °C with vigorous magnetic stirring for 30 min. Next, 3.0 g of NaNO3 was added portion-wise to the mixture and kept further stirring for 30 min. Then, a solid powder of KMnO4 was slowly added to the beaker and the mixture was kept below 15 °C. The mixture was stirred at 35 °C until its colour changed to brown, and then the mixture was diluted with 200 mL of deionized water was then slowly added to the mixture and stirred again for 30 min. After heating up to 80 °C for 6 h, 40 mL of 30% H2O2 was slowly added. The solution mixture was centrifuged and washed several times with deionized water until the pH of the filtrate reached neutral. Then, the lyophilized precipitates were obtained.To functionalize GO with APTMS, 200 mg of GO was added to round flask with 25 mL ethanol and dispersed through ultrasonication for 30 min. Then 4.5% w/v of APTMS was added and ultrasonicated next for 30 min. After that the mixture stirred at 65 °C for 12 h. The GO-NH2 product was centrifuged and washed with ethanol and oven-dried at 50 °C for 12 h. The obtained GO-NH2 was characterized by FTIR and EDX techniques.
Adsorption experiments
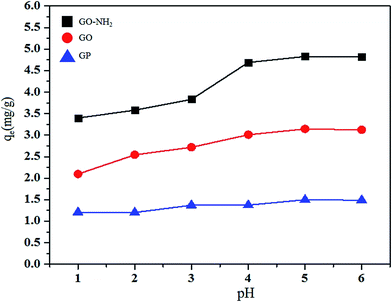
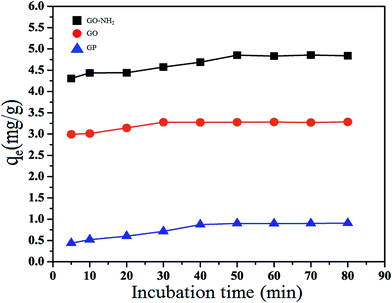
The effects of experimental parameters such as pH of solution (1–6), incubation time (0–80 min) and temperature (30–60 °C) on the adsorptive removal of Mn(II) ions were studied in a batch mode of operation for a specific period of Mn(II) concentration of 10 mg L−1. All adsorption experiments were conducted in 125 mL conical flask, adsorbent (0.02 g) was accurately weighed into a conical flask. Then, 25 mL of Mn(II) solution was added and the pH of the solution was adjusted and shaken by an orbital shaker at approximately 200 rpm at ambient temperature. After a period of shaking, the adsorbent was separated from the solution mixture by centrifugation for 5 min and Mn(II) in the supernatant solution was determined by AAS. All experiments were conducted in triplicate under the same conditions. The adsorption capacity (qe, mg g−1) of Mn(II) at an equilibrium state was determined as follows:| qe = V(C0 − Ce)/m | (1) |
Results and discussion
Characterization of adsorbents
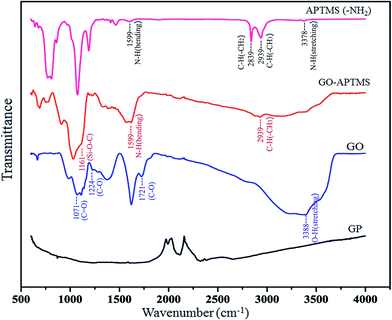
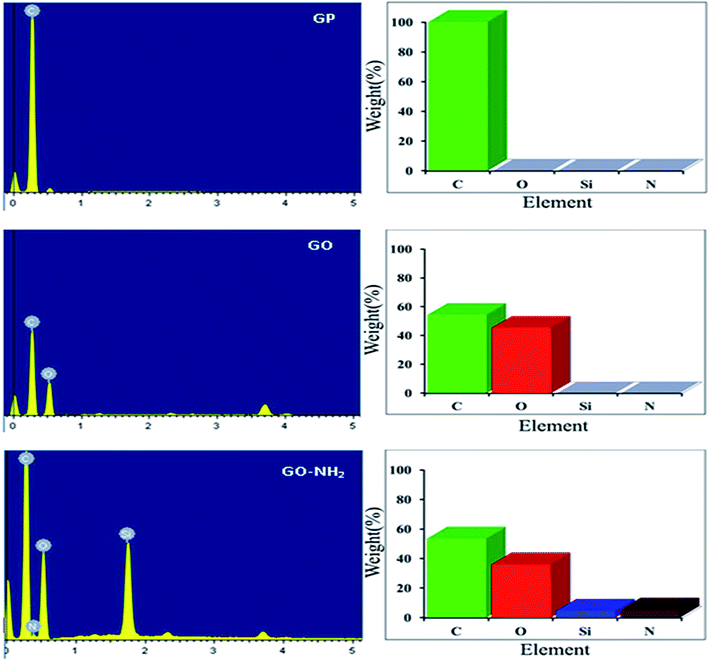
In this work, FTIR and EDX spectral data demonstrated the element contents and functional groups of the raw material and the functionalized GO-NH2. FTIR spectra of these adsorbents are shown in Fig. 1. It is evident that changes in the adsorption peaks of APTMS, GO-APTMS, GO and GP are differently observed. The peak at 3388 cm−1 is the stretching of –OH groups. Peaks for C–H stretching vibration of CH3 and CH2 groups appear at 2939 cm−1 and 2839 cm−1, respectively. The band at 1124 cm−1 is the stretching vibration of Si–O–C, confirming the formation of GO-APTMS. Moreover, it is noted in their spectra of APTMS and GO-SPTMS the stretching vibration of –NH2 group occurs at 1599 cm−1 which proves the existence of the functionalized NH2 groups on the GO surface.Furthermore, from EDX patterns in Fig. 2, it is shown that changes in the spectral data of GP, GO and GO-APTMS are also obviously different. The peaks of Si and N occur only in GO-APTMS, indicating that graphene oxide modified with amino is successfully obtained. This observation suggests that graphene oxide contains the NH2 group attached, which can be applied to selectively remove Mn(II) from aqueous solution.
Adsorption experiment
ΔG0 = −RT![[thin space (1/6-em)]](https://www.rsc.org/images/entities/char_2009.gif) ln ln![[thin space (1/6-em)]](https://www.rsc.org/images/entities/char_2009.gif) Kd Kd
| (2) |
| Kd = qe/Ce | (3) |
ln![[thin space (1/6-em)]](https://www.rsc.org/images/entities/char_2009.gif) Kd = −ΔH0/RT + ΔS0/R Kd = −ΔH0/RT + ΔS0/R
| (4) |
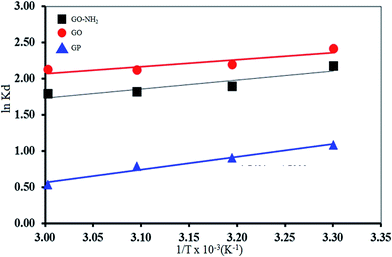
The values of ΔS0 and ΔH0 can be calculated from the slope and the intercept of the van't Hoff plot of ln![[thin space (1/6-em)]](https://www.rsc.org/images/entities/char_2009.gif) Kd versus 1/T (Fig. 6), respectively.
Kd versus 1/T (Fig. 6), respectively.
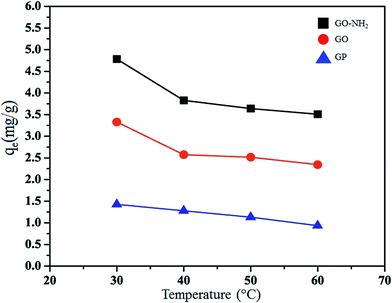
Table 1 shows the obtained thermodynamic parameters of GP, GO and GO-NH2. It was found that negative ΔG0 of all adsorbents indicates the spontaneity of the ongoing adsorption process.58 Negative value of ΔS0 indicates a tendency to lower disorder at the solid–solution interface during the adsorption.59 In addition, the negative ΔH0 indicates that the Mn(II) adsorption using GP, GO and GO-NH2 are the exothermic nature, the low values of ΔH0 give clearly evidence that the interactions between Mn(II) and its adsorbent were rather weak.60,61
| Adsorbent | ΔH0 (kJ mol−1) | ΔS0 (kJ mol−1 K−1) | ΔG0 (kJ mol−1) | R2 | |||
|---|---|---|---|---|---|---|---|
| 303 K | 313 K | 323 K | 333 K | ||||
| GP | −14.71 | −39.41 | −20.14 | −20.33 | −20.67 | −20.62 | 0.9731 |
| GO | −8.08 | −7.03 | −23.69 | −23.30 | −24.17 | −25.01 | 0.8040 |
| GO-NH2 | −10.45 | −16.97 | −22.87 | −22.91 | −23.43 | −24.07 | 0.8431 |
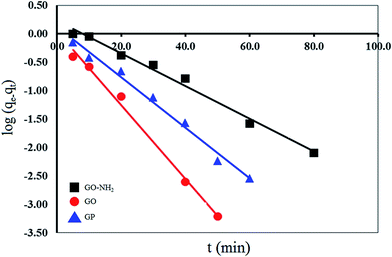
The pseudo first-order equation describes adsorption in solid–liquid systems based on the sorption capacity of solids. It has been proposed that only one ion of the metal is sorbed onto one sorption site on the adsorbent surface. The linear form of the pseudo first-order models can be written by the following eqn (5):
log(qe − qt) = log![[thin space (1/6-em)]](https://www.rsc.org/images/entities/char_2009.gif) qe − (k1/2.303)t qe − (k1/2.303)t
| (5) |
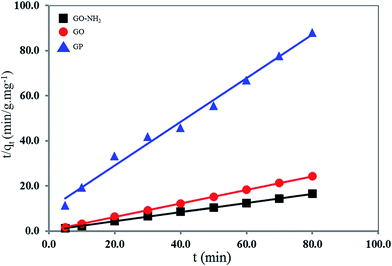
The pseudo second-order rate expression has been applied for analyzing chemi-sorption kinetics from liquid solutions. From the assumption of this model, only one ion of the metal is sorbed onto two sorption sites on the adsorbent surface. The linear form of the pseudo second-order models can be written by the following eqn (6):
| t/qt = (1/k2q22) + (t/q2) | (6) |
The kinetic parameters for the Mn(II) adsorption of GO at 303 K were calculated from eqn (5) and (6) as shown in Table 2. It is found that the pseudo-first order kinetic model is applicable for only the adsorption of Mn(II) by GP, because its calculated maximum adsorption capacity (q1 = 1.32 mg g−1) and the experimental adsorption capacity (qe,exp = 0.90 mg g−1) are close. On the other hand, the adsorption of Mn(II) by GO and GO-NH2 fitted well with the pseudo-second-order kinetic model. The q2 value of GO and GO-NH2 are 3.33 and 4.94 mg g−1 and the linear correlation coefficient (R2) of 0.9999 and 0.9995 are high. Moreover, both of the calculated (3.33 for GO and 4.94 mg g−1 for GO-NH2) and the experimental (qe,exp; 3.28 mg g−1 for GO and 4.85 mg g−1 for GO-NH2) values are close to each other.
| Adsorbent | qe,exp (mg g−1) | Pseudo-first order | Pseudo-second order | ||||
|---|---|---|---|---|---|---|---|
| q1 (mg g−1) | K1 (min) | R2 | q2 (mg g−1) | K2 (g mg−1 min−1) | R2 | ||
| GP | 0.90 | 1.32 | 0.10 | 0.9882 | 0.10 | 9.74 | 0.9902 |
| GO | 3.28 | 1.09 | 0.15 | 0.9936 | 3.33 | 0.38 | 0.9999 |
| GO-NH2 | 4.85 | 1.69 | 0.07 | 0.9888 | 4.94 | 0.13 | 0.9995 |
In order to gain insight into both the mechanism and rate controlling step affecting the kinetics of adsorption, the Weber's intra-particle diffusion model was applied to the kinetic experiment. The kinetic results were analyzed by the intra-particle diffusion model to elucidate the diffusion mechanism. The intra-particle diffusion model is expressed as following eqn (7):
| qt = kpt1/2 + C | (7) |
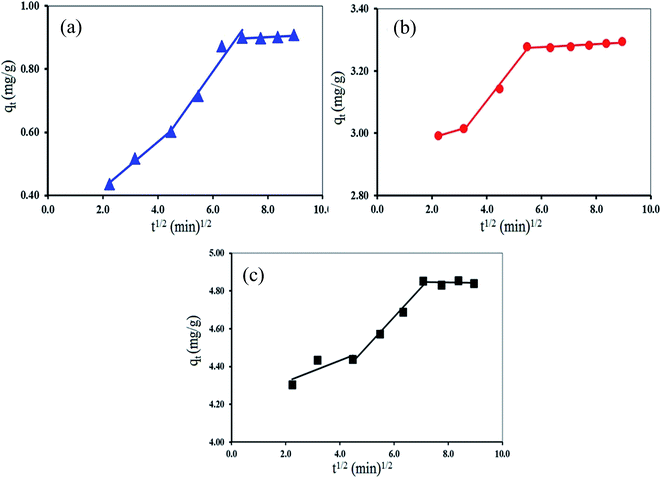 | ||
| Fig. 9 Intra-particle diffusion kinetic model of Mn(II) adsorption using (a) GP, (b) GO and (c) GO-NH2. | ||
Fig. 9 shows the intra-particle diffusion for Mn(II) adsorption using GP, GO and GO-NH2 used as adsorbents. The trend of the adsorption process is defined as three phases occurring during the adsorption process. The first portion is a transport of the Mn(II) ions from the bulk solution onto the external surface of adsorbent by diffusion through the boundary layer. The second one is the diffusion of the Mn(II) ions from the external surface into the pores of the adsorbents. The last one is the final equilibrium stage, where Mn(II) ions were adsorbed on the active sites on the internal surface of the pore, and the intra-particle diffusion plot starts slowing down due to the solute concentration getting lower in the solution.63 The surface adsorption was predominantly occurred within 60, 30 and 50 min contact time for GP, GO and GO-NH2, respectively. Thereafter, the diffusion route became the rate-limiting step. The intra-particle diffusion rate constant kp (mg g−1 min−1/2) was evaluated from the slope of the second linear part of the plotting of qt versus t1/2 (Table 3). As the plot did not pass through the origin, the intra-particle diffusion was not the only rate-limiting step. Thus, there were three processes on controlling the adsorption rate but only one was the rate limiting in any particular time range. In addition, the intercept of the plot indicates the boundary layer effect. The value of C was highest for GO-NH2, resulting in more surface adsorption of the Mn(II). Therefore, both surface adsorption and intra-particle diffusion mechanisms were simultaneously cooperated in the adsorption behaviors.
| Adsorbent | Parameter | ||
|---|---|---|---|
| Kp (mg g−1 min−1/2) | C (mg g−1) | R2 | |
| GP | 0.12 | 0.06 | 0.9589 |
| GO | 0.11 | 2.65 | 0.9915 |
| GO-NH2 | 0.16 | 3.73 | 0.9852 |
| Ce/qe = Ce/qm + 1/qmKL | (8) |
The Freundlich adsorption isotherm is used to describe the adsorption characteristics for the heterogeneous surface. These data often fit the empirical eqn (9) proposed by Freundlich:
log![[thin space (1/6-em)]](https://www.rsc.org/images/entities/char_2009.gif) qe = log qe = log![[thin space (1/6-em)]](https://www.rsc.org/images/entities/char_2009.gif) KF + (1/n)log KF + (1/n)log![[thin space (1/6-em)]](https://www.rsc.org/images/entities/char_2009.gif) Ce Ce
| (9) |
![[thin space (1/6-em)]](https://www.rsc.org/images/entities/char_2009.gif) qe versus log
qe versus log![[thin space (1/6-em)]](https://www.rsc.org/images/entities/char_2009.gif) Ce.
Ce.
The constant KF is an approximate indicator of adsorption capacity, while 1/n is a function of the strength of adsorption in the adsorption process. If n = 1, then the partition between the two phases is independent of the concentration. If the value of 1/n is below one, it indicates a normal adsorption. On the other hand, 1/n being above one indicates cooperative adsorption. However, KF and n are the characteristic factors of the sorbent–sorbate system, which must be determined by data fitting. Specifically, the linear least-square method and the linearly transformed equations have been widely applied to correlate sorption data where 1/n is a heterogeneity parameter; the smaller the 1/n, the greater the expected heterogeneity. This expression reduces to a linear adsorption isotherm when 1/n = 1.57
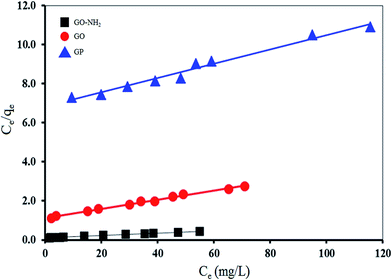
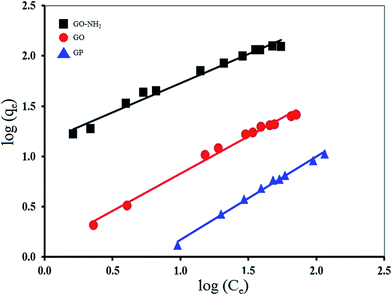
Fig. 10 and 11 show the fitting plots of Langmuir adsorption and Freundlich adsorption of Mn(II) onto GP, GO and GO-NH2. The constant values obtained from both Langmuir and Freundlich adsorption isotherms and their correlation coefficients (R2) were calculated and are summarized in Table 4.
| Adsorbent | Langmuir Isotherm | Freundlich Isotherm | ||||
|---|---|---|---|---|---|---|
| qmax (mg g−1) | KL | R2 | KF | 1/n | R2 | |
| GP | 16.45 | 0.0102 | 0.8730 | 0.122 | 1.0412 | 0.9435 |
| GO | 41.67 | 0.0213 | 0.9765 | 2.992 | 0.8773 | 0.8773 |
| GO-NH2 | 161.29 | 0.0643 | 0.9854 | 2.632 | 1.2176 | 0.9006 |
From the results, it can be concluded that for GP adsorbent, Freundlich isotherm (R2 > 0.94) fitted the experimental results better than Langmuir isotherm (R2 > 0.87). It corresponds to the greater heterogeneity of the adsorbent surface. On the other hand, for GO and GO-NH2 adsorbents, Langmuir isotherm (R2 > 0.98) fitted the experimental results better than Freundlich isotherm (R2 > 0.88). It corresponds to the homogenous adsorbent surface. The Mn(II) ions were taken place only at specific sites of the GO and GO-NH2 adsorbents, which is valid for monolayer sorption onto a surface. The maximum values of adsorption capacity were 16.45, 41.67 and 161.29 mg g−1 for GP, GO and GO-NH2, respectively. For comparison, the maximum adsorption capacities of Mn(II) using other adsorbents are presented in Table 5. It is evident that GO-NH2 possesses high adsorption capacity for Mn(II) removal from aqueous solution compared with the other carbon-based adsorbents.
Conclusion
The present study reveals the feasibility of using graphene oxide (GO) functionalized with 3-mercaptopropyl-trimethoxysilane for removal of Mn(II) from aqueous solution. FTIR and EDX were used to successfully confirm the amino-functionalized GO. Their adsorption behaviors are well described by Langmuir and Freundlich isotherm models. The maximum adsorption capacity of GO-NH2 for Mn(II) was 161.29 mg g−1. The adsorption process of Mn(II) follows the pseudo-second-order kinetics model, indicating that the overall rate of Mn(II) uptake is controlled by external mass transfer at the initial stage of adsorption. In addition, the driving forces that control the adsorption rate later are attributable to intra-particle diffusion. Thermodynamic study of the adsorption process revealed that it was mainly an exothermic spontaneous reaction. Therefore, the present study provides an excellent adsorbent for Mn(II) ions from aqueous solution. This adsorbent can also potentially be used for wastewater treatment.Conflicts of interest
The authors have declared no conflict of interest.Acknowledgements
This research was financially supported by Materials Chemistry Research Center, Department of Chemistry and Center of Excellence for Innovation in Chemistry (PERCH-CIC), Faculty of Science, Khon Kaen University, Thailand, and the Ministry of Science and Technology, Bangkok, Thailand.References
- H. Li, Z. Zhang, S. Tang, Y. Li and Y. Zhang, Ultrason. Sonochem., 2008, 15, 339–343 CrossRef CAS PubMed.
- S. Laki, A. Arabi Shamsabadi, S. S. Madaeni and M. Niroomanesh, RSC Adv., 2015, 5, 84195–84206 RSC.
- P. Dusek, P. M. Roos, T. Litwin, S. A. Schneider, T. P. Flaten and J. Aaseth, J. Trace Elem. Med. Biol., 2015, 31, 193–203 CAS.
- T. Saleh and V. Gupta, Environ. Sci. Pollut. Res., 2012, 19, 1224–1228 CrossRef CAS PubMed.
- A. Mittal, J. Mittal, A. Malviya and V. K. Gupta, J. Colloid Interface Sci., 2010, 344, 497–507 CrossRef CAS PubMed.
- A. Mittal, J. Mittal, A. Malviya and V. K. Gupta, J. Colloid Interface Sci., 2009, 340, 16–26 CrossRef CAS PubMed.
- A. Mittal, D. Kaur, A. Malviya, J. Mittal and V. K. Gupta, J. Colloid Interface Sci., 2009, 337, 345–354 CrossRef CAS PubMed.
- V. K. Gupta and A. Nayak, Chem. Eng. J., 2012, 180, 81–90 CrossRef CAS.
- V. K. Gupta, A. Mittal, D. Jhare and J. Mittal, RSC Adv., 2012, 2, 8381–8389 RSC.
- V. K. Gupta, I. Ali, T. A. Saleh, A. Nayak and S. Agarwal, RSC Adv., 2012, 2, 6380–6388 RSC.
- A. Asfaram, M. Ghaedi, S. Agarwal, I. Tyagi and V. Kumar Gupta, RSC Adv., 2015, 5, 18438–18450 RSC.
- A. K. Jain, V. K. Gupta, A. Bhatnagar and A. Suhas, Sep. Sci. Technol., 2003, 38, 463–481 CrossRef CAS.
- V. K. Gupta, R. Jain, A. Nayak, S. Agarwal and M. Shrivastava, Mater. Sci. Eng., C, 2011, 31, 1062–1067 CrossRef CAS.
- V. K. Gupta, S. Agarwal and T. A. Saleh, J. Hazard. Mater., 2011, 185, 17–23 CrossRef CAS PubMed.
- R. K. Mishra, P. C. Rout, K. Sarangi and K. C. Nathsarma, Trans. Nonferrous Met. Soc. China, 2016, 26, 301–309 CrossRef CAS.
- H. Abu Hasan, S. R. Sheikh Abdullah, S. K. Kamarudin and N. Tan Kofli, Process Saf. Environ. Prot., 2013, 91, 415–422 CrossRef CAS.
- A. M. Silva, E. C. Cunha, F. D. R. Silva and V. A. Leão, J. Cleaner Prod., 2012, 29–30, 11–19 CrossRef CAS.
- L. Charerntanyarak, Water Sci. Technol., 1999, 39, 135–138 CAS.
- L. Stoica, M. Dinculescu and C. G. Plapcianu, Water Res., 1998, 32, 3021–3030 CrossRef CAS.
- O. N. Kononova, G. L. Bryuzgina, O. V. Apchitaeva and Y. S. Kononov, Arabian J. Chem., 2015 DOI:10.1016/j.arabjc.2015.05.021.
- Y. C. Sharma, Uma, S. N. Singh, Paras and F. Gode, Chem. Eng. J., 2007, 132, 319–323 CrossRef CAS.
- S. R. Taffarel and J. Rubio, Miner. Eng., 2010, 23, 1131–1138 CrossRef CAS.
- M. P. Tavlieva, S. D. Genieva, V. G. Georgieva and L. T. Vlaev, J. Mol. Liq., 2015, 211, 938–947 CrossRef CAS.
- A. Ates and G. Akgül, Powder Technol., 2016, 287, 285–291 CrossRef CAS.
- L. Ma, Y. Peng, B. Wu, D. Lei and H. Xu, Chem. Eng. J., 2013, 225, 59–67 CrossRef CAS.
- K. Z. Al-Wakeel, H. Abd El Monem and M. M. H. Khalil, J. Environ. Chem. Eng., 2015, 3, 179–186 CrossRef CAS.
- M. S. Islam, M. S. Rahaman and J. H. Yeum, Colloids Surf., A, 2015, 484, 9–18 CrossRef CAS.
- P. Nuengmatcha, R. Mahachai and S. Chanthai, Asian J. Chem., 2014, 26, S85–S88 CrossRef.
- G. Zhao, T. Wen, X. Yang, S. Yang, J. Liao, J. Hu, D. Shao and X. Wang, Dalton Trans., 2012, 41, 6182–6188 RSC.
- G. Zhao, X. Ren, X. Gao, X. Tan, J. Li, C. Chen, Y. Huang and X. Wang, Dalton Trans., 2011, 40, 10945–10952 RSC.
- G. Zhao, J. Li, X. Ren, C. Chen and X. Wang, Environ. Sci. Technol., 2011, 45, 10454–10462 CrossRef CAS PubMed.
- R. Sitko, E. Turek, B. Zawisza, E. Malicka, E. Talik, J. Heimann, A. Gagor, B. Feist and R. Wrzalik, Dalton Trans., 2013, 42, 5682–5689 RSC.
- L. Liu, S. Liu, Q. Zhang, C. Li, C. Bao, X. Liu and P. Xiao, J. Chem. Eng. Data, 2013, 58, 209–216 CrossRef CAS.
- P. Nuengmatcha, R. Mahachai and S. Chanthai, Asian J. Chem., 2015, 27, 4167–4170 CrossRef CAS.
- C. J. Madadrang, H. Y. Kim, G. Gao, N. Wang, J. Zhu, H. Feng, M. Gorring, M. L. Kasner and S. Hou, ACS Appl. Mater. Interfaces, 2012, 4, 1186–1193 CAS.
- S. Park, D. A. Dikin, S. T. Nguyen and R. S. Ruoff, J. Phys. Chem. C, 2009, 113, 15801–15804 CAS.
- F. Fang, L. Kong, J. Huang, S. Wu, K. Zhang, X. Wang, B. Sun, Z. Jin, J. Wang, X.-J. Huang and J. Liu, J. Hazard. Mater., 2014, 270, 1–10 CrossRef CAS PubMed.
- Y. Xue, Y. Liu, F. Lu, J. Qu, H. Chen and L. Dai, J. Phys. Chem. Lett., 2012, 3, 1607–1612 CrossRef CAS PubMed.
- S. H. Ryu, J. H. Sin and A. M. Shanmugharaj, Eur. Polym. J., 2014, 52, 88–97 CrossRef CAS.
- Y. Wang, Z. Shi, J. Fang, H. Xu and J. Yin, Carbon, 2011, 49, 1199–1207 CrossRef CAS.
- X.-Z. Tang, W. Li, Z.-Z. Yu, M. A. Rafiee, J. Rafiee, F. Yavari and N. Koratkar, Carbon, 2011, 49, 1258–1265 CrossRef CAS.
- W. Zhang, J. Ma, D. Gao, Y. Zhou, C. Li, J. Zha and J. Zhang, Prog. Org. Coat., 2016, 94, 9–17 CrossRef CAS.
- L. Chen, D. Zhao, S. Chen, X. Wang and C. Chen, J. Colloid Interface Sci., 2016, 472, 99–107 CrossRef CAS PubMed.
- C. Wang, Y. Lan, W. Yu, X. Li, Y. Qian and H. Liu, Appl. Surf. Sci., 2016, 362, 11–19 CrossRef CAS.
- M. Ghorbani, S. M. Nowee, N. Ramezanian and F. Raji, Hydrometallurgy, 2016, 161, 117–126 CrossRef CAS.
- Y. Pei, C. Xiao, T.-W. Goh, Q. Zhang, S. Goes, W. Sun and W. Huang, Surf. Sci., 2016, 648, 299–306 CrossRef CAS.
- J. Ou, M. Mei and X. Xu, J. Solid State Chem., 2016, 238, 182–188 CrossRef CAS.
- Z. Bian, X. Meng, M. Tao, Y. Lv and Z. Xin, J. Mol. Catal. A: Chem., 2016, 417, 184–191 CrossRef CAS.
- Z. Rahimi, A. A. L. Zinatizadeh and S. Zinadini, J. Ind. Eng. Chem., 2015, 29, 366–374 CrossRef CAS.
- L. Hao, T. Zheng, J. Jiang, G. Zhang and P. Wang, Chem. Eng. J., 2016, 292, 163–173 CrossRef CAS.
- S. Bao, L. Tang, K. Li, P. Ning, J. Peng, H. Guo, T. Zhu and Y. Liu, J. Colloid Interface Sci., 2016, 462, 235–242 CrossRef CAS PubMed.
- P. Nuengmatcha, R. Mahachai and S. Chanthai, Asian J. Chem., 2014, 26, 1321–1323 CrossRef CAS.
- W. S. Hummers and R. E. Offeman, J. Am. Chem. Soc., 1958, 80, 1339 CrossRef CAS.
- D. K. Mondal, B. K. Nandi and M. K. Purkait, J. Environ. Chem. Eng., 2013, 1, 891–898 CrossRef CAS.
- A. Omri and M. Benzina, Alexandria Eng. J., 2012, 51, 343–350 CrossRef CAS.
- S. Netpradit, P. Thiravetyan and S. Towprayoon, Water Res., 2003, 37, 763–772 CrossRef CAS PubMed.
- P. L. Prabha, S. A. F. Rani, T. Ramachandramoorthy and B. Jayalakshmi, World J. Pharm. Pharm. Sci., 2015, 4, 714–723 CAS.
- A. Mittal, V. Thakur and V. Gajbe, Environ. Sci. Pollut. Res., 2013, 20, 260–267 CrossRef CAS PubMed.
- M. Hadavifar, N. Bahramifar, H. Younesi and Q. Li, Chem. Eng. J., 2014, 237, 217–228 CrossRef CAS.
- G. Vijayakumar, R. Tamilarasan and M. Dharmendirakumar, J. Mater. Environ. Sci., 2012, 3, 157–170 CAS.
- P. Saha, S. Chowdhury, S. Gupta and I. Kumar, Chem. Eng. J., 2010, 165, 874–882 CrossRef CAS.
- V. Vadivelan and K. V. Kumar, J. Colloid Interface Sci., 2005, 286, 90–100 CrossRef CAS PubMed.
- H. Tang, W. Zhou and L. Zhang, J. Hazard. Mater., 2012, 209–210, 218–225 CrossRef CAS PubMed.
- O. Abollino, M. Aceto, M. Malandrino, C. Sarzanini and E. Mentasti, Water Res., 2003, 37, 1619–1627 CrossRef CAS PubMed.
- A. Bin Jusoh, W. H. Cheng, W. M. Low, A. Nora'aini and M. J. Megat Mohd Noor, Desalination, 2005, 182, 347–353 CrossRef CAS.
- A. A. Kroik, O. N. Shramko and N. V. Belous, Sewage cleaning with applying of natural sorbents, Chem. Technol. Water, 1999, 21(3), 310 CAS.
- A. Üçer, A. Uyanik and Ş. F. Aygün, Sep. Purif. Technol., 2006, 47, 113–118 CrossRef.
- K. A. Emmanuel and A. Veerabhadra Rao, Rasayan J. Chem., 2008, 1(4), 840–852 CAS.
| This journal is © The Royal Society of Chemistry 2018 |

