
 Open Access Article
 This Open Access Article is licensed under a Creative Commons Attribution-Non Commercial 3.0 Unported Licence
Synthesis of alloyed Zn1–xMnxS nanowires with completely controlled compositions and tunable bandgaps†
Jing Cai *a,
Sheng Wanga,
Kefu Zhua,
Yucheng Wu*a,
Lizhao Zhoua,
Yongliang Zhanga,
Qiang Wub,
Xizhang Wang*b and
Zheng Hub
*a,
Sheng Wanga,
Kefu Zhua,
Yucheng Wu*a,
Lizhao Zhoua,
Yongliang Zhanga,
Qiang Wub,
Xizhang Wang*b and
Zheng Hub
aSchool of Materials Science and Engineering, Anhui Provincial Key Laboratory of Advanced Functional Materials and Devices, Hefei University of Technology, Hefei 230009, P. R. China. E-mail: caijs@hfut.edu.cn; ycwu@hfut.edu.cn
bKey Laboratory of Mesoscopic Chemistry of MOE, School of Chemistry and Chemical Engineering, Nanjing University, Nanjing 210093, P. R. China. E-mail: wangxzh@nju.edu.cn
First published on 2nd January 2018
Abstract
This study reported the successful synthesis of Zn1–xMnxS nanowires with completely controlled compositions (0 ≤ x ≤ 1); the x values could be well controlled by tuning the feeding ratio of [(C4H9)2NCS2]2Zn to [(C4H9)2NCS2]2Mn precursors. The bandgaps of Zn1−xMnxS nanowires showed nonlinear bowing character versus the composition. This result provided an effective route for designing Mn-based ternary chalcogenide nanowires with specific bandgaps, which is significant for their better application in photonics and spintronics.
Introduction
Mn2+ doped semiconductor nanomaterials have attracted great attention in photonics and spintronics due to their unique optical and magnetic properties,1,2 such as orange photoluminescence emission3,4 and photo-induced magnetization.5 Many factors could affect their optical or magnetic properties, including the temperature,4,6 dopant location7,8 and composition/dopant concentration.4,9–15 As is well known, the composition is a key factor affecting the bandgaps of semiconductor nanomaterials,16–23 e.g. the ternary ZnxCd1−xS16–18, CdSxSe1−x19 and ZnSexTe1−x20 nanowires, all showed the tunable bandgaps versus the composition. Hence, the synthesis of composition completely controlled Mn-based ternary chalcogenide nanomaterials is significant to explore the relationship between their bandgaps and composition. Many methods have been employed to synthesize Mn2+ doped chalcogenide nanomaterials, such as the nucleation and growth doping methods9 as well as the ionic diffusion and exchange doping methods,13 however, it remains challenge for synthesizing composition completely controlled Mn-based ternary chalcogenide nanomaterials, especially for the one dimensional nanostructures such as Zn1−xMnxS nanowires.The solution-solid-solid (SSS) growth has shown great convenience in synthesis of various binary chalcogenide nanowires24–33 and even ternary ZnxCd1−xS16,18 nanowires with superionic conductors such as Ag2S, Ag2Se and Cu2−xS as catalysts. Previously, we have synthesized the ZnS nanowires16 and MnS nanowires25 via the SSS route using Ag2S nanoparticles as the catalysts, and the adopted precursors were metalorganic [(C4H9)2NCS2]2Zn and [(C4H9)2NCS2]2Mn, respectively. The two precursors are of similar structures, and their decomposing rates and conditions might be similar, thus co-decomposing [(C4H9)2NCS2]2Zn and [(C4H9)2NCS2]2Mn was probably very suitable for the synthesis of composition completely controlled Zn1−xMnxS nanowires.
Herein, by adopting the [(C4H9)2NCS2]2Zn and [(C4H9)2NCS2]2Mn precursors with different molar ratios, we successfully synthesized the ternary alloyed Zn1−xMnxS nanowires with tunable composition (0 ≤ x ≤ 1) through the Ag2S nanoparticle mediated growth. The composition, morphology and structure of the Zn1−xMnxS nanowires were determined by powder X-ray diffraction (XRD), high-resolution transmission electron microscopy (HRTEM), the inductively coupled plasma-mass spectrometry (ICP-MS), energy dispersive spectroscopy (EDS) and the electron paramagnetic resonance (EPR) analysis. The optical properties of the Zn1−xMnxS nanowires were investigated using the ultraviolet-visible (UV-Vis) and photoluminescence (PL) spectroscopies.
Experimental section
Materials
The used chemical reagents include AgNO3 (99%), Mn(NO3)2·4H2O (97.5%), Zn(NO3)2·6H2O (98%), 1-dodecanethiol (98%), 1-dodecylamine (CP), dibutylamine (99%), methanol (99.7%), ethanol (99.7%), carbon disulfide (AR), NaOH (96%), HNO3 (65–68%), cyclohexane (99.5%). These reagents were used as received without any further purification. And the deionized ultrapure water were collected from Milli-Q Advantage, Millipore.![[thin space (1/6-em)]](https://www.rsc.org/images/entities/char_2009.gif) :1, and the Ag2S nanoparticles suspension in cyclohexane with fixed amount, were all added into the flask. Then this mixture solution were stirred at 40 °C for 10 min by a magnetic stirrer. After that the flask were pumped, and quickly heated to 120 °C and kept there for 10 min. Following on, the products were carefully washed and centrifugalized with methanol and cyclohexane respectively for at least five times. Finally the solid products from the centrifuge were collected and dried for further characterization.
:1, and the Ag2S nanoparticles suspension in cyclohexane with fixed amount, were all added into the flask. Then this mixture solution were stirred at 40 °C for 10 min by a magnetic stirrer. After that the flask were pumped, and quickly heated to 120 °C and kept there for 10 min. Following on, the products were carefully washed and centrifugalized with methanol and cyclohexane respectively for at least five times. Finally the solid products from the centrifuge were collected and dried for further characterization.Results and discussions
The Ag2S nanoparticles were prepared similarly to our previous reports,16,25 the morphology and structure of the nanoparticles were characterized by (HR)TEM as shown in Fig. S1a–c.† The diameters of the Ag2S nanoparticles were uniform with the average size of ca. 12.6 ± 1.7 nm as shown by Fig. S1d.† All of these obtained Ag2S nanoparticles were stocked in cyclohexane for further use.In the preparation of ternary Zn1−xMnxS nanowires, the [(C4H9)2NCS2]2Zn and [(C4H9)2NCS2]2Mn precursors with specific molar fraction of Mn/(Mn + Zn) at 0%, 12.5%, 25%, 37.5%, 50%, 62.5%, 75%, 87.5% and 100% were respectively mixed with unchanged amount of Ag2S catalysts and the solvent of 1-dodecylamine and 1-dodecanethiol. Then after reaction, the nine products were collected and labelled as 1# to 9#, respectively. The XRD patterns of these samples have been shown in Fig. 1. It can be seen that the pattern of sample 1# coincided with the hexagonal ZnS phase (JCPDS: 36-1450), and that of sample 9# was consistent with the hexagonal γ-MnS phase (JCPDS: 40-1289). The diffraction peaks in 2–8# exhibited similar patterns to those of 1# (ZnS) and 9# (MnS). Meanwhile the corresponding single peak, such as the [110] peak, of the nine samples evolved progressively from the high 2θ angle towards the low 2θ angle from samples 1# to 9#, suggesting their increased lattice parameters (Table S1†). This result indicated that the samples 2–8# were composed of alloyed Zn1−xMnxS phase instead of phase-separated phases. And because the lattice constant of MnS is larger than that of ZnS, the increased lattice constants from 1–9# could be attributed to the increased Mn2+ concentration in the samples from 1–9#. Besides, the x values can be estimated following the eqn (1) based on the Vegard's law,34
 | (1) |
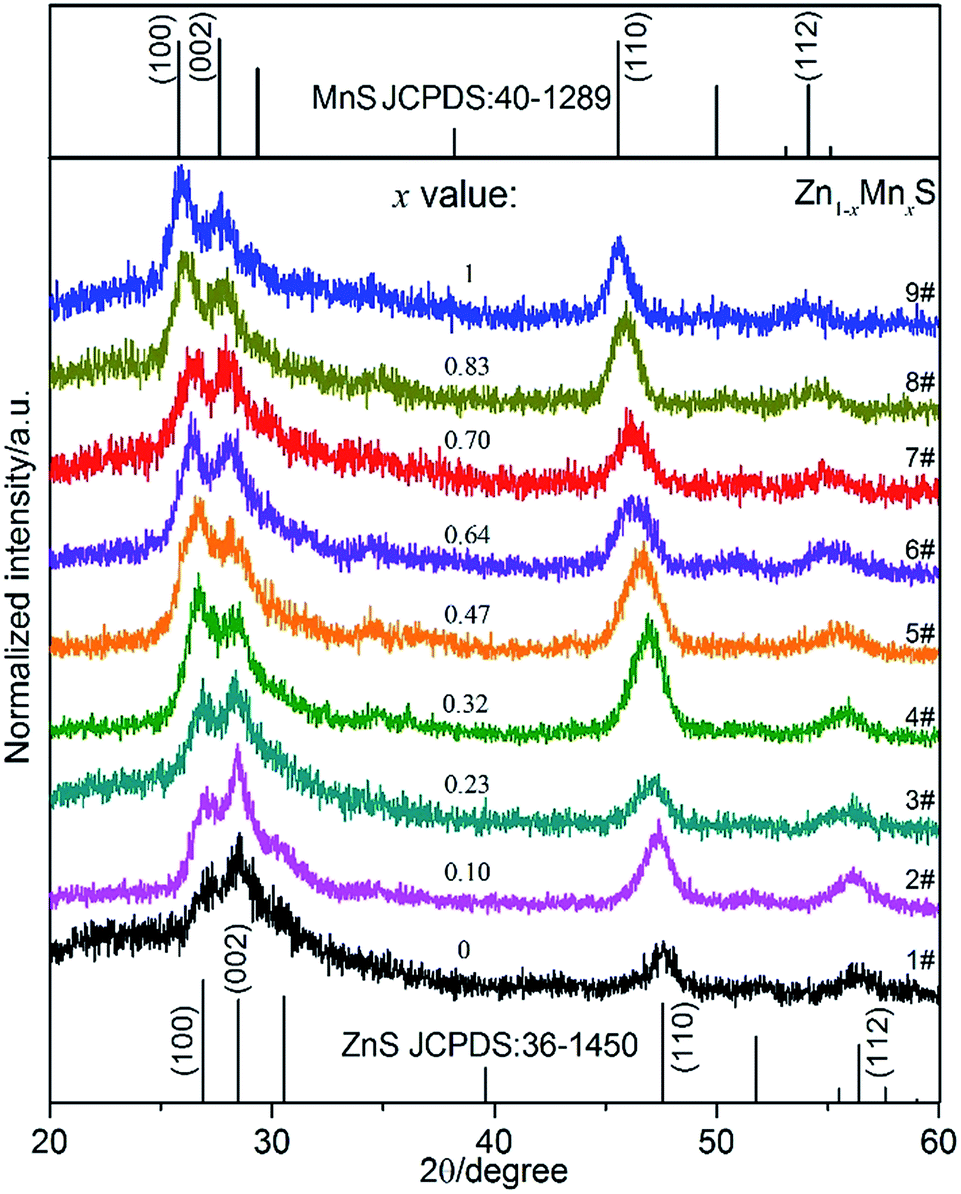 | ||
| Fig. 1 XRD patterns of the samples 1–9#. The standard ZnS pattern (JCPDS: 36-1450) and MnS pattern (JCPDS: 40-1289) were shown on the bottom and top, respectively. | ||
The morphologies of the samples 1, 3, 5, 7, 9# were characterized by the TEM microscopy as shown in Fig. S2,† 2a and b. It can be seen that the products were composed of matchstick-like heteronanostructures, which were constructed by a nanowire stem and a terminated nanoparticle. The average diameters of nanowires were ca. 6.5 ± 1.4 nm, 6.9 ± 1.0 nm, 6.9 ± 1.2 nm, 6.9 ± 1.3 nm, 6.7 ± 1.3 nm for samples 1, 3, 5, 7, 9#, respectively, without consideration of the terminated nanoparticles (Fig. S2†). The sample 5# was selected as the typical example for further analysis. EDS result (Fig. 2c) indicated that the Zn, Mn, Ag and S elements existed in the sample 5#, and the atomic ratio of elements Zn to Mn was 21.2:21.9 (inset of Fig. 2c), coincided well with Zn0.53Mn0.47S phase as indicated by the XRD analysis (Fig. 1). Fig. 2e, g and h showed that the measured interplanar distances of the nanowire was 3.38 Å coinciding well with the d100 spacing (3.373 Å) of Zn0.53Mn0.47S phase (Table S1†), and the growth direction of the nanowire was along [110] direction, which were also supported by the FFT pattern of the nanowire (Fig. 2f). However, this nanowire was not straight but seemed flexible, thus the direction of the lattice fringes with the same Miller index slightly changed along the nanowire as shown in Fig. 2g and h. Nevertheless, the interplanar distances along the nanowires (Fig. 2e, g and h) were unchanged which indicated the homogeneous composition along the nanowire, otherwise different interplanar distance could be found for the planes with the same Miller indices. Fig. S3† indicated that the terminated nanoparticle was composed of monoclinic Ag2S phase (JCPDS: 14-0072). These results suggested the formation of ternary alloyed Zn0.53Mn0.47S nanowire catalyzed by the Ag2S nanoparticle for sample 5#. And it could also suggest that the Ag2S nanoparticles can act as the catalysts for the growth of ternary Zn1−xMnxS nanowires via SSS route in this case, similar to the reported Ag2S nanoparticles catalyzed growth of ZnS and MnS nanowires.16,24,25,35
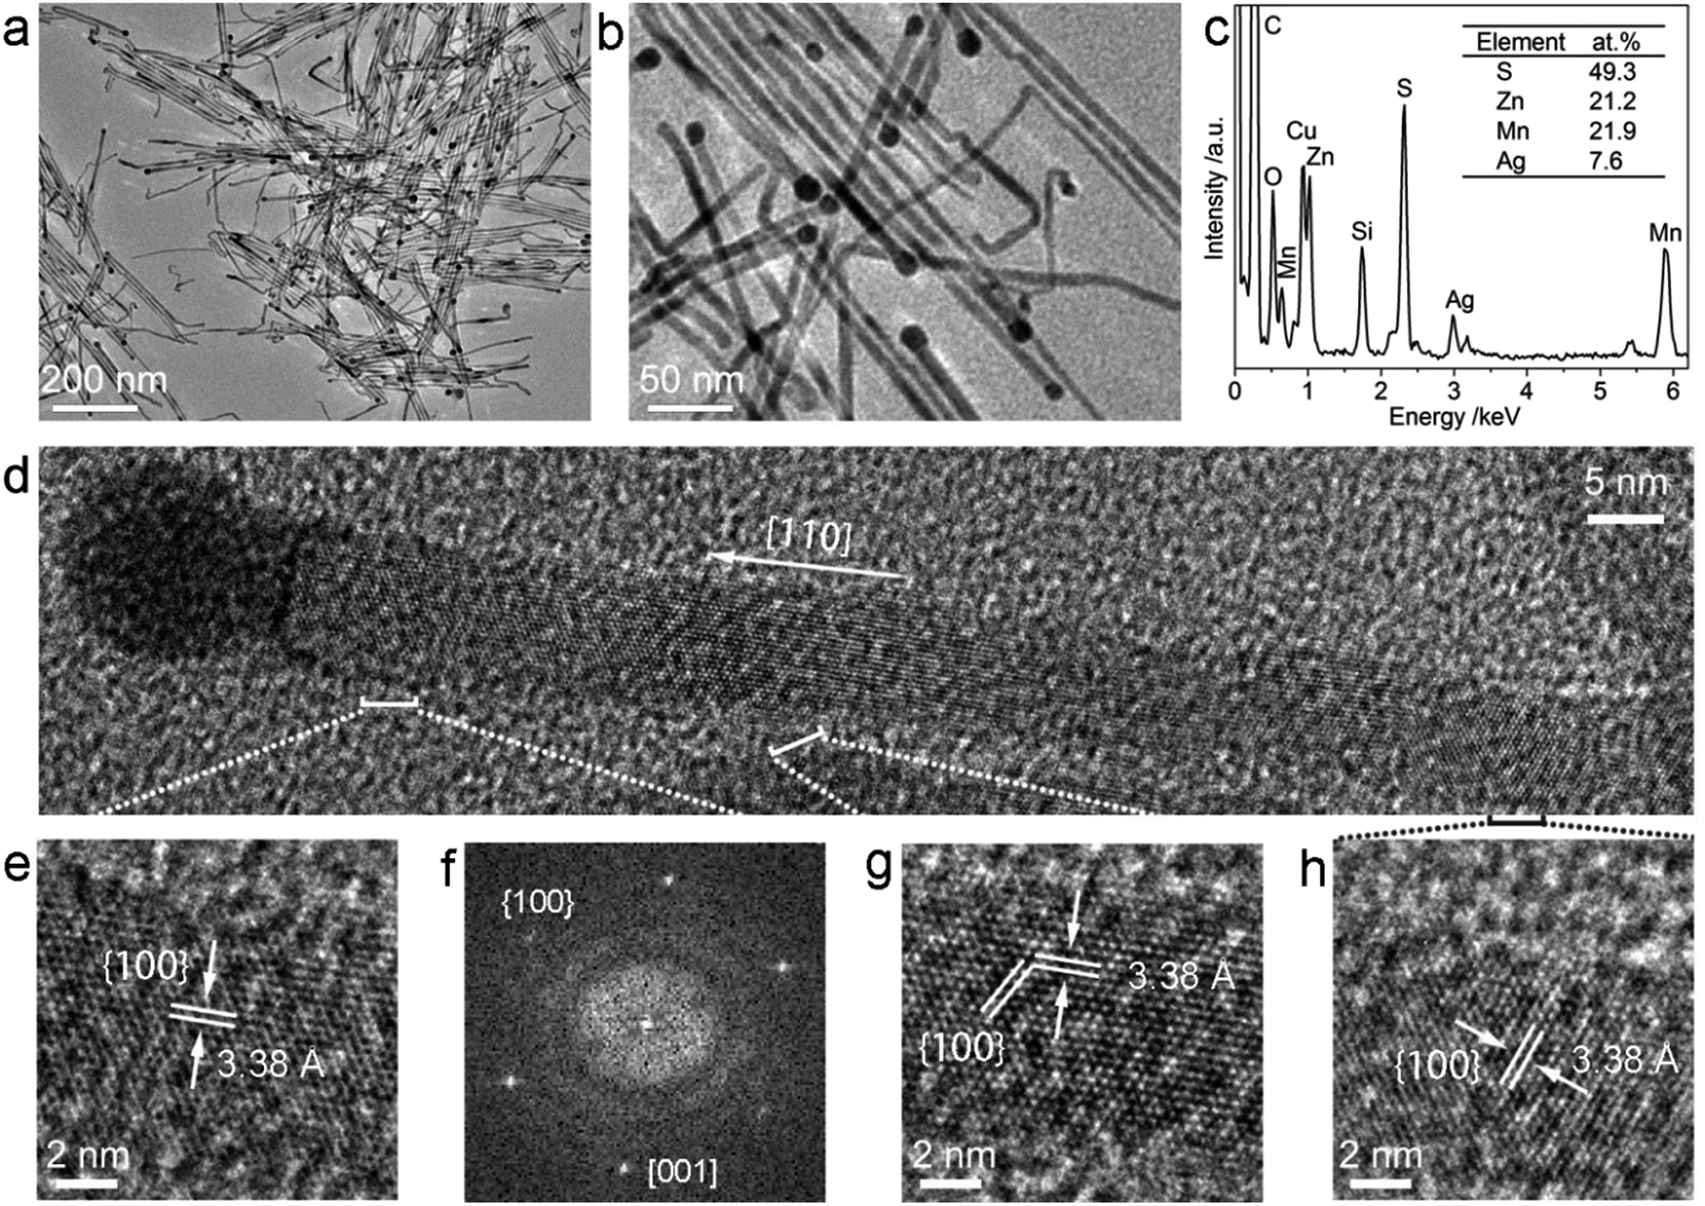 | ||
| Fig. 2 (a, b) TEM images of the sample 5# with different magnification. (c) EDS spectrum of sample 5#. The C, O, Cu and Si signals come from the Cu grid. (d) HRTEM image of a typical heteronanostructure. (e, g, h) Enlarged HRTEM images from different sites of the Zn1−xMnxS nanowire in (d) as indicated by the dashed line. (f) Corresponding Fast Fourier Transform (FFT) pattern of the area in (e). | ||
To obtain the accurate composition x of Zn1−xMnxS nanowires, the typical samples 3, 5, 7# were characterized by ICP-MS and the molar fraction of Mn/(Mn + Zn) was measured at 0.23, 0.48 and 0.69, respectively (denoted by ★ in Fig. 3). Besides, the composition x for all samples determined by Vegard's law based on the XRD spectra were also drawn in Fig. 3 (denoted by ●), as well as the composition for sample 5# determined by EDS analysis (denoted by ◇). It can be seen that all these analysis methods have provided the similar results, indicating the x values determined by Vegard's law could be used to approximately represent their composition. In other words, the nanowires of samples 1–9# were composed of ZnS, Zn0.90Mn0.10S, Zn0.77Mn0.23S, Zn0.68Mn0.32S, Zn0.53Mn0.47S, Zn0.36Mn0.64S, Zn0.30Mn0.70S, Zn0.17Mn0.83S and MnS phase, respectively. Besides, Fig. 3 has also shown that the experimental determined x values coincided well with the feeding molar ratio of Mn/(Mn + Zn) precursors, which suggested that this route was very effective in the synthesis of composition controlled Zn1−xMnxS nanowires.
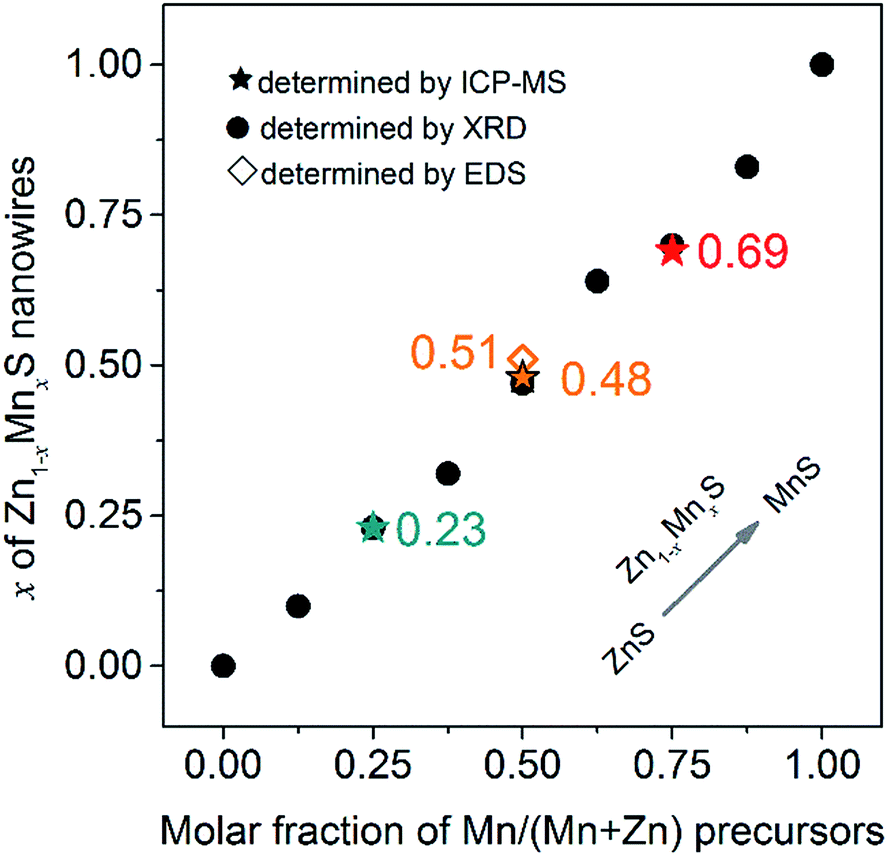 | ||
| Fig. 3 The relationship between the experimental measured compositions x of Zn1−xMnxS nanowires and feeding molar fraction of Mn/(Mn + Zn) precursors. The compositions for samples 3, 5, 7# denoted by pentagon (★) were determined through ICP-MS, for all samples by dot (●) were determined through Vegard's law, and for sample 5# by diamond (◇) was determined through EDS analysis. | ||
The optical properties of these products were examined by UV-Vis and PL spectroscopies. The absorbance spectra of the samples in Fig. 4a all showed the discernible shoulder peaks. The bandgaps of the samples were extracted (Fig. 4b) using the method similar to the literatures.20,36,37 It was interesting that the extracted bandgaps of Zn1−xMnxS nanowires did not shown a linear relationship with the composition x, but exhibited a nonlinear optical bowing effect (Fig. 4c) similar to that reported in PbSxSe1−x nanocrystals38 and ZnSexTe1−x nanowires,20 etc. Taking into accounts of the optical bowing effect, the quadratic eqn (2) below were used to fit the bandgaps of Zn1−xMnxS nanowires,
| Eg (eV) = xEgA + (1 − x)EgB − bx(1 − x) | (2) |
| Eg (eV) = 3.88 − 0.94x + 0.74x2 | (3) |
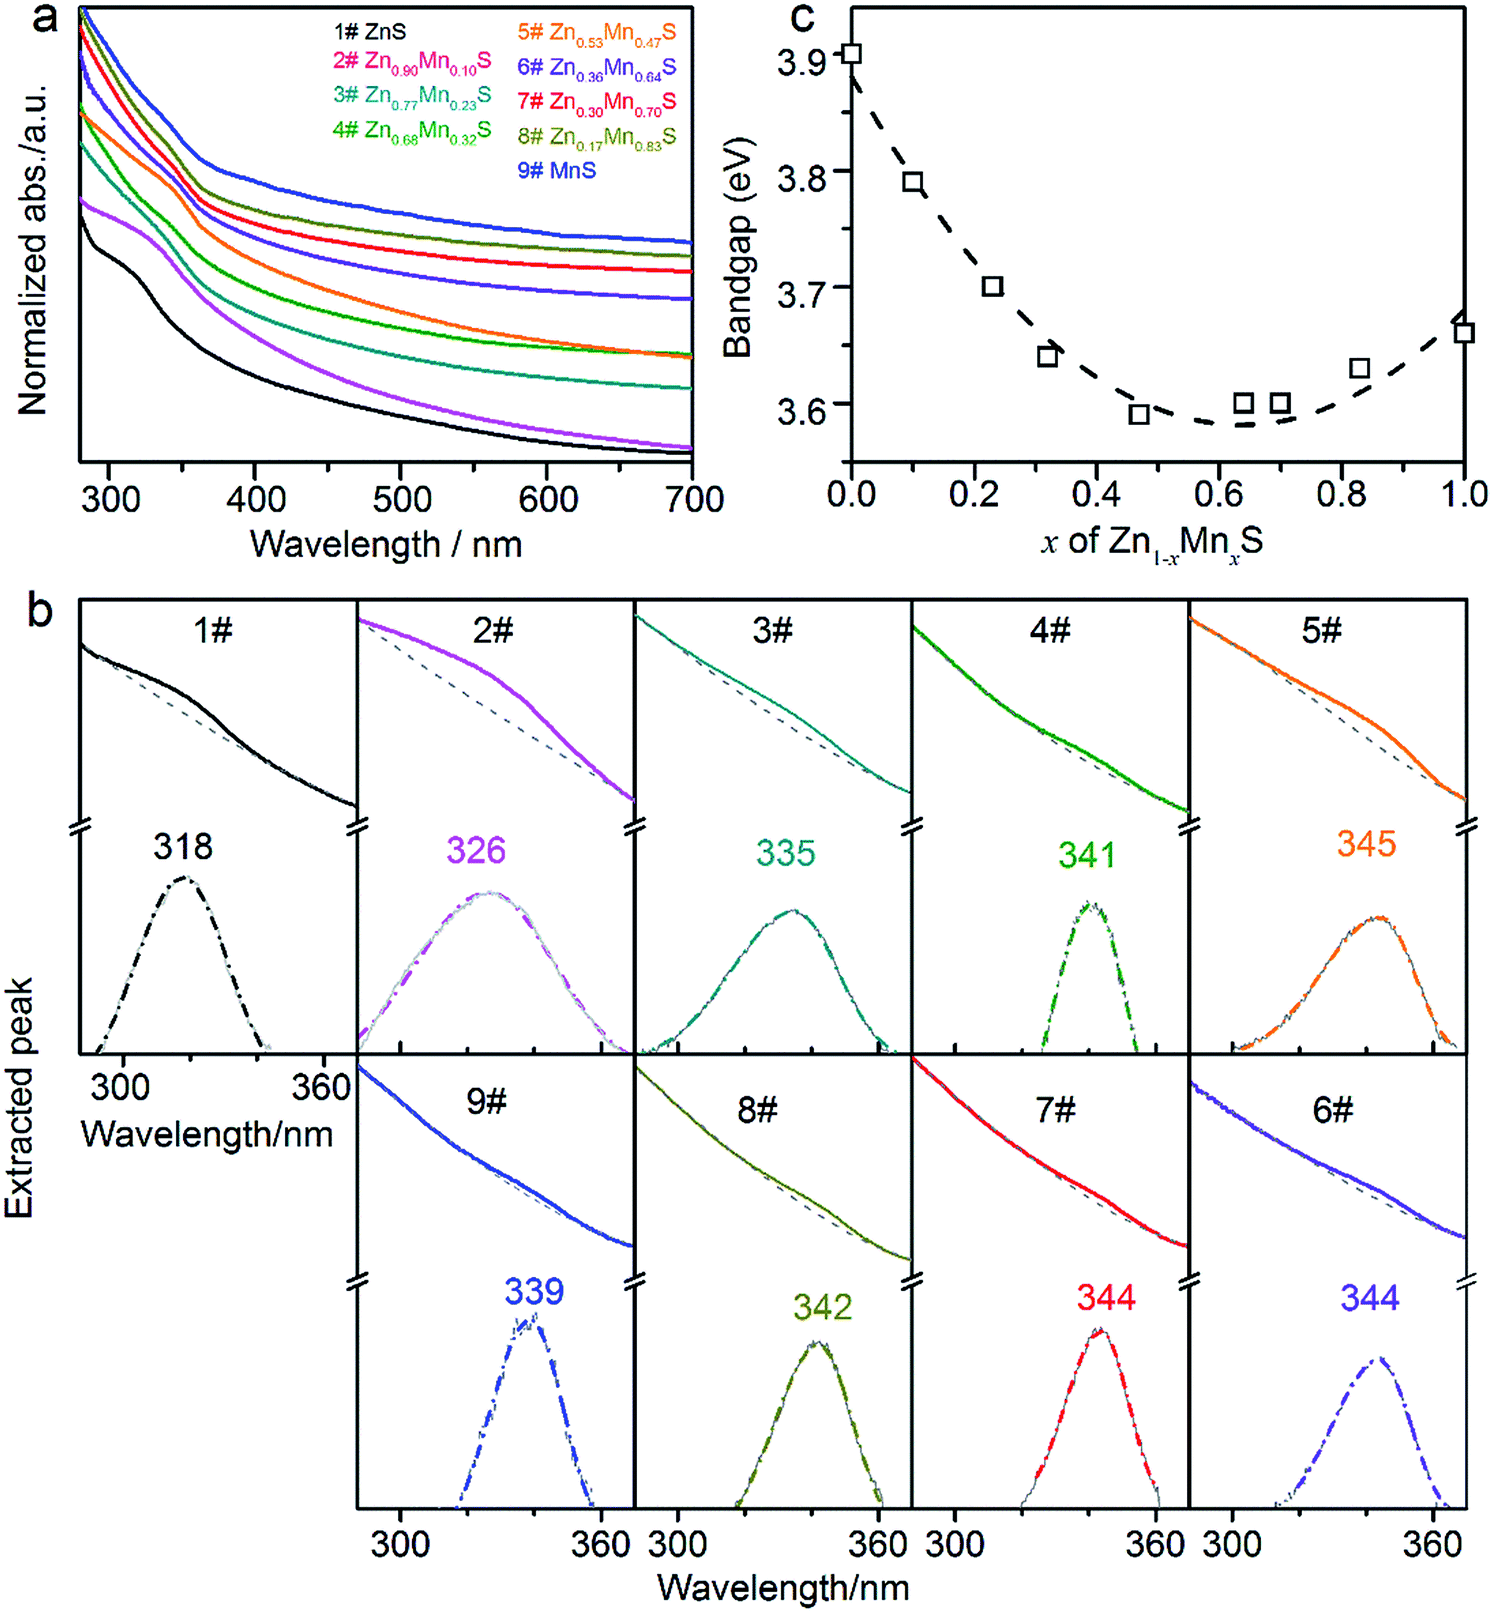 | ||
| Fig. 4 (a) Absorption spectra of the typical samples 1–9#, which are denoted by different colors. (b) The extracted peaks for the samples 1–9#. For example, in the sample 1#, the top solid dark line was original absorbance curve. The top dashed grey line was the fitted baseline. The bottom solid grey peak was extracted by subtracting baseline from the absorbance curve. The bottom dashed dark curve was the fitted Gaussian plot, which displayed the shoulder peak located around 318 nm. The method to extract the shoulder peak was similar to that in the literatures.20,36,37 (c) The relationship between the bandgap energy of Zn1−xMnxS nanowires and the composition x. | ||
The PL properties of the samples 1, 3, 5, 7, 9# were examined (Fig. S4†) in the range of 550–850 nm using the 532 nm laser as the excitation source. It can be seen that the samples 1# (ZnS) and 9# (MnS) show featureless PL spectra, however, the ternary Zn1−xMnxS samples of 3, 5, 7# show clear characteristic yellow emission at 576 nm from the 4T1–6A1 transition of Mn2+ dopant,9 which indicated the formation of ternary alloyed Zn1−xMnxS compound. Besides, the EPR spectra of the typical samples of 3, 5, 7# were also collected as shown in Fig. S5.† The increased EPR intensity from samples 3# to 5# and 7# indicated the increased amount of Mn2+ in the Zn1−xMnxS nanowires, and the hyperfine structure of Mn2+ cannot be resolved due to the high Mn2+ concentration for these samples. These features are similar to those reported in Cd1−xMnxSe nanocrystals.13 The results also supported the formation of ternary alloyed Zn1−xMnxS nanowires.
In conclusion, the ternary alloyed Zn1−xMnxS nanowires were controlled synthesized via the Ag2S nanoparticle mediated growth under vacuum by the co-decomposition of [(C4H9)2NCS2]2Zn and [(C4H9)2NCS2]2Mn precursors. The diameters of the alloyed Zn1−xMnxS nanowires were uniform. The composition of the nanowires could be well tuned over the entire range (0 ≤ x ≤ 1). The relationship between the bandgaps and composition x of the Zn1−xMnxS nanowires were examined, and thus the bandgaps were found to exhibit the nonlinear bowing character versus the composition x. The results could provide new opportunities for modulating the bandgaps of Mn-based ternary chalcogenide nanowires and promote their further application in photonics and spintronics.
Conflicts of interest
There are no conflicts to declare.Acknowledgements
This work was jointly supported by National Natural Science Foundation of China (No. 51602090, 51702077), Applied Technical Achievement Training Program of Hefei University of Technology (No. JZ2017YYPY0257), National Basic Research Program of China (No. 2013CB932902), and Foundation on the Integration of Industry, Education and Research of Hefei University of Technology (No. XC2015JZBZ18, XC2016JZBZ01).Notes and references
- N. Pradhan, S. Das Adhikari, A. Nag and D. D. Sarma, Angew. Chem., Int. Ed., 2017, 56, 7038–7054 CrossRef CAS PubMed.
- C. D. Pu, H. Y. Qin, Y. Gao, J. H. Zhou, P. Wang and X. G. Peng, J. Am. Chem. Soc., 2017, 139, 3302–3311 CrossRef CAS PubMed.
- Z. Deng, L. Tong, M. Flores, S. Lin, J. X. Cheng, H. Yan and Y. Liu, J. Am. Chem. Soc., 2011, 133, 5389–5396 CrossRef CAS PubMed.
- X. Yuan, S. H. Ji, M. C. De Siena, L. L. Fei, Z. Zhao, Y. J. Wang, H. Li, J. L. Zhao and D. R. Gamelin, Chem. Mater., 2017, 29, 8003–8011 CrossRef CAS.
- R. Beaulac, L. Schneider, P. I. Archer, G. Bacher and D. R. Gamelin, Science, 2009, 325, 973–976 CrossRef CAS PubMed.
- X. Yuan, J. J. Zheng, R. S. Zeng, P. T. Jing, W. Y. Ji, J. L. Zhao, W. Y. Yang and H. B. Li, Nanoscale, 2014, 6, 300–307 RSC.
- H. Y. Chen, S. Maiti and D. H. Son, ACS Nano, 2012, 6, 583–591 CrossRef CAS PubMed.
- E. Hofman, R. J. Robinson, Z. J. Li, B. Dzikovski and W. W. Zheng, J. Am. Chem. Soc., 2017, 139, 8878–8885 CrossRef CAS PubMed.
- S. L. Shen, Y. J. Zhang, Y. S. Liu, L. Peng, X. Y. Chen and Q. B. Wang, Chem. Mater., 2012, 24, 2407–2413 CrossRef CAS.
- M. A. Kamran, A. Majid, T. Alharbi, M. W. Iqbal, M. W. Amjad, G. Nabi, S. Zou and B. Zou, J. Mater. Chem. C, 2017, 5, 8749–8757 RSC.
- B. B. Srivastava, S. Jana, N. S. Karan, S. Paria, N. R. Jana, D. D. Sarma and N. Pradhan, J. Phys. Chem. Lett., 2010, 1, 1454–1458 CrossRef CAS.
- P. Arunkumar, K. H. Gil, S. Won, S. Unithrattil, Y. H. Kim, H. J. Kim and W. B. Im, J. Phys. Chem. Lett., 2017, 8, 4161–4166 CrossRef CAS PubMed.
- C. J. Barrows, P. Chakraboriy, L. M. Kornowske and D. R. Gamelin, ACS Nano, 2016, 10, 910–918 CrossRef CAS PubMed.
- A. S. Silva, S. A. Lourenco and N. O. Dantas, Phys. Chem. Chem. Phys., 2016, 18, 6069–6076 RSC.
- S. Joicy, R. Saravanan, D. Prabhu, N. Ponpandian and P. Thangadurai, RSC Adv., 2014, 4, 44592–44599 RSC.
- Y. L. Zhang, J. Cai, T. P. Ji, Q. Wu, Y. Y. Xu, X. Z. Wang, T. Sun, L. J. Yang and Z. Hu, Nano Res., 2015, 8, 584–591 CrossRef CAS.
- Y. Liu, J. A. Zapien, Y. Y. Shan, C. Y. Geng, C. S. Lee and S. T. Lee, Adv. Mater., 2005, 17, 1372–1377 CrossRef CAS.
- Y. G. Chen, S. Zhao, X. Wang, Q. Peng, R. Lin, Y. Wang, R. A. Shen, X. Cao, L. B. Zhang, G. Zhou, J. Li, A. D. Xia and Y. D. Li, J. Am. Chem. Soc., 2016, 138, 4286–4289 CrossRef CAS PubMed.
- J. Pan, M. I. Utama, Q. Zhang, X. F. Liu, B. Peng, L. M. Wong, T. C. Sum, S. J. Wang and Q. H. Xiong, Adv. Mater., 2012, 24, 4151–4156 CrossRef CAS PubMed.
- F. J. Xu, B. Xue, F. D. Wang and A. G. Dong, Chem. Mater., 2015, 27, 1140–1146 CrossRef CAS.
- A. C. Onicha, N. Petchsang, T. H. Kosel and M. Kuno, ACS Nano, 2012, 6, 2833–2843 CrossRef CAS PubMed.
- C. Y. He, Q. Wu, X. Z. Wang, Y. L. Zhang, L. J. Yang, N. Liu, Y. Zhao, Y. N. Lu and Z. Hu, ACS Nano, 2011, 5, 1291–1296 CrossRef CAS PubMed.
- T. Kuykendall, P. Ulrich, S. Aloni and P. D. Yang, Nat. Mater., 2007, 6, 951–956 CrossRef CAS PubMed.
- L. Zhang, S. You, M. Zuo and Q. Yang, Inorg. Chem., 2017, 56, 7679–7686 CrossRef CAS PubMed.
- Y. L. Zhang, R. Xu, W. M. Chen, O. Zhuo, Q. Wu, J. Cai, X. Z. Wang and Z. Hu, J. Mater. Chem. C, 2017, 5, 6493–6496 RSC.
- G. X. Zhu and Z. Xu, J. Am. Chem. Soc., 2011, 133, 148–157 CrossRef CAS PubMed.
- S. L. Shen, Y. J. Zhang, L. Peng, Y. P. Du and Q. B. Wang, Angew. Chem., Int. Ed., 2011, 50, 7115–7118 CrossRef CAS PubMed.
- J. L. Wang, K. M. Chen, M. Gong, B. Xu and Q. Yang, Nano Lett., 2013, 13, 3996–4000 CrossRef CAS PubMed.
- W. W. Xu, J. Z. Niu, H. Z. Wang, H. B. Shen and L. S. Li, ACS Appl. Mater. Interfaces, 2013, 5, 7537–7543 CAS.
- J. C. Zhou, F. Huang, J. Xu and Y. S. Wang, Nanoscale, 2013, 5, 9714–9719 RSC.
- L. Zhang and Q. Yang, Nano Lett., 2016, 16, 4008–4013 CrossRef CAS PubMed.
- W. Han, L. X. Yi, N. Zhao, A. W. Tang, M. Y. Gao and Z. Y. Tang, J. Am. Chem. Soc., 2008, 130, 13152–13161 CrossRef CAS PubMed.
- J. L. Wang, C. M. Yang, Z. P. Huang, M. G. Humphrey, D. Jia, T. T. You, K. M. Chen, Q. Yang and C. Zhang, J. Mater. Chem., 2012, 22, 10009 RSC.
- A. Denton and N. Ashcroft, Phys. Rev. A, 1991, 43, 3161–3164 CrossRef CAS.
- F. D. Wang, A. G. Dong and W. E. Buhro, Chem. Rev., 2016, 116, 10888–10933 CrossRef CAS PubMed.
- F. D. Wang, R. A. Loomis and W. E. Buhro, ACS Nano, 2016, 10, 9745–9754 CrossRef CAS PubMed.
- H. Yu, J. B. Li, R. A. Loomis, L. W. Wang and W. E. Buhro, Nat. Mater., 2003, 2, 517–520 CrossRef CAS PubMed.
- J. Akhtar, M. Afzaal, M. Banski, A. Podhorodecki, M. Syperek, J. Misiewicz, U. Bangert, S. J. O. Hardman, D. M. Graham, W. R. Flavell, D. J. Binks, S. Gardonio and P. O'Brien, J. Am. Chem. Soc., 2011, 133, 5602–5609 CrossRef CAS PubMed.
Footnote |
| † Electronic supplementary information (ESI) available: Additional (HR)TEM images, statistical distribution data, PL and EPR data of typical samples. See DOI: 10.1039/c7ra12714f |
| This journal is © The Royal Society of Chemistry 2018 |