 Open Access Article
Paclitaxel-loaded PLGA microspheres with a novel morphology to facilitate drug delivery and antitumor efficiency†
Zongrui Zhangab,
Xinyu Wang *ab,
Binbin Liab,
Yuanjing Houab,
Zhengwei Caiab,
Jing Yangc and
Yi Lid
aState Key Laboratory of Advanced Technology for Materials Synthesis and Processing, Wuhan University of Technology, Wuhan 430070, China. E-mail: wangxinyu@whut.edu.cn; Fax: +86-27-87880734; Tel: +86-27-87651853
bBiomedical Materials and Engineering Research Center of Hubei Province, Wuhan 430070, China
cSchool of Foreign Languages, Wuhan University of Technology, Wuhan 430070, China
dInstitute of Textiles and Clothing, The Hong Kong Polytechnic University, Hung Hom, Kowloon, Hong Kong, P. R. China
First published on 16th January 2018
Abstract
The aim of this study was to develop a novel morphological paclitaxel (PTX) loaded poly(lactide-co-glycolide) (PLGA) microspheres (MS) delivery system to enhance drug delivery and antitumor efficiency as well as reduce drug administration frequency. Therefore, different morphological types of PTX-PLGA-MS were prepared using a modified solvent evaporation technique. Morphology analysis confirmed the successful preparation of the smooth PTX-PLGA-MS with internal sporadic porosity, and the novel rough PTX-PLGA-MS with microporous surface and porous internal structures. The PTX drugs were distributed in the readily bioavailable state (amorphous) in PTX-loaded MS, which allowed fast drug release from MS following intratumoral administration. The drug entrapment and release behaviors indicated that the rough MS could provide enough hydrophobic space for PTX-loading and deep surface folds for fast matrices degradation, thus achieving a higher drug-loading efficiency (17.8%) and a rapid sustained drug release effect. Furthermore, the rough MS showed strengthened in vitro anti-hepatoma efficiency than that of free PTX and smooth MS. The in vivo studies indicated remarkable antitumor activity of rough MS (tumor inhibition rate = 58.33%) for at least 13 days after a single injection, which was because the rapid sustained-release drugs could induce the pro-apoptosis gene and protein expressions, cause extensive tumor cell apoptosis, and reduce the toxicity to normal tissues. In conclusion, the rough PTX-PLGA-MS drug delivery system with outstanding tumor growth inhibition effect could serve as a promising treatment for liver tumor.
Introduction
Human hepatocellular carcinoma (HCC) which is mainly attributed to viral hepatitis and non-alcoholic steatohepatitis induced cirrhosis,1 is among the top five most deadly cancers worldwide, and has an increasing incidence and a high mortality rate.2,3 Despite recent progress in HCC patients treatment including hyperthermia therapy,4 radiotherapy,5 and chemotherapy,6 the treatment to liver cancer are still remarkably limited because of high recurrence rates and conventional chemotherapy resistance. Among them, the chemotherapy plays an important role because most antitumor drugs are small molecules and their clearance from the tumor is rapid via the enhanced permeability and outward convective interstitial fluid flow effect.7 The key areas for HCC patients therapeutic treatment are to improve the accumulation of chemotherapeutic agents in tumor sites, avoiding multi-drug resistant (MDR) and tumor recurrence.8Paclitaxel (PTX) as the most effective antitumor drugs, has shown its potency of treating various solid tumors, especially against metastatic breast cancer,9 refractory prostate and ovarian cancers.10,11 It works through interfering with mitosis by inducing the microtubules assembly and stabilization, which caused the G2/M phase accumulation, and tumor cell death.12,13 Furthermore, PTX may have universal effects throughout the cell cycle, which resulted in disturbances of cell functions like cell movement or angiogenesis without significantly affecting cell proliferation.14 However, the main challenges associated with successful clinical PTX therapy are its extremely poor water solubility (<0.025 mg mL−1),7 MDR in tumor cells,15 and nonspecific pharmacokinetics in systemic circulation.16
In order to overcome these defects, there have been continuous efforts to develop suitable drug delivery systems for PTX, including polymeric micelles, liposomes, microspheres (MS), and nanoparticles.13,17–19 Generally, the cytotoxic activity of PTX required that cells enter the G2/M phases, thus the carriers should efficiently deliver drugs to the tumor cells to bring out maximum therapeutic effects.20 Polymeric MS can significantly improve the solubilization and bioavailability of PTX drugs, as well as serve as drug reservoirs to allow sustained drug release, thus improving PTX therapeutic efficiency in the desired tumor tissue.21–23 Since these studies, the development of PTX-loaded polymeric MS with favorable drug release is important existing in choosing suitable delivery vehicle.24,25 Poly(lactide-co-glycolide) (PLGA) with excellent biocompatibility and tunable degradation rate are rapidly becoming promising polymeric MS delivery vehicle, which enable the effective protection and long-term delivery of the inhaled drug agents.26 Nevertheless, improving the MS overall performance, including drug-loading capacity, premature drug release before reaching the tumor cells, undesired MDR for slow drug release, and relevant side-effects, remains challenging.27,28
Nowadays, most publications focus on drug entrapment and release behaviors better than the morphology of drug-loaded MS. Noteworthy, the drug encapsulation and delivery are strongly correlated to MS morphology.29 Zhou et al.30 have investigated that the various surface morphologies were mainly affected by the stirring rate, the oil phase viscosity, and the organic solvent evaporation. Liu et al.31 have prepared core–shell MS through Pickering emulsion polymerization, which have distinguished advantages over full core MS in drug-loading capacity. Additionally, the integrated hollow core and porous shell microstructure of MS could extend their applications, such as selective separation,32 controlled release,33 and chemical sensors,34 which were resulted from their ordered pore structures, tailored sorption properties, improved permeability and high specific surface area.35 Consequently, even if there were few literatures to report MS morphological behaviors, as delivery carriers of PTX, the MS morphology has significant influences on the solubility, encapsulation efficiency and release behaviors of drugs, which further affects their antitumor activity.36,37 Furthermore, the disruption of cell proliferation and mitogen-activated protein kinases (MAPK) signaling pathways may result in elevated cell apoptosis, so the changes of liver tumor molecule biology play important role in the early HCC patients treatment.38,39 The specific aim of this work was to develope a novel PTX-PLGA-MS to investigate the influences of morphology on drug entrapment and release behaviors as well as antitumor efficacy.
In this study, the novel rough PTX-PLGA-MS were prepared using modified double-emulsion solvent evaporation method. The morphology, drug stability, thermal and in vitro drug release behaviors of rough PTX-PLGA-MS were carried out to confirm whether the MS possessed novel morphological features, high drug-loading capacity, enhanced drug bioavailability and rapid sustained drug release. Furthermore, the in vivo evaluations were performed to compare the behaviors of rough MS with free PTX and smooth MS, including antitumor activity, histological and molecular biology studies. The results demonstrated that the rough MS could efficiently suppress the tumor growth and alleviate the damage to normal organs, which might be associated with the rapid sustained drug release, decreased drug administration frequency and system toxicity consequently. The implications of these results above are thoroughly analyzed for the development of rough PTX-PLGA-MS for optimal therapeutic efficacy inside solid tumors.
Materials and methods
Materials
Paclitaxel (98% purity) and PLGA (lactide/glycolide = 75/25, Mw = 21![[thin space (1/6-em)]](https://www.rsc.org/images/entities/char_2009.gif) 375) were purchased from Sigma. Dichloromethane (DCM), ammonium bicarbonate (ABC), polyvinyl alcohol (PVA; Mw = 77
375) were purchased from Sigma. Dichloromethane (DCM), ammonium bicarbonate (ABC), polyvinyl alcohol (PVA; Mw = 77![[thin space (1/6-em)]](https://www.rsc.org/images/entities/char_2009.gif) 000), deuterated chloroform (CDCl3), trimethylsilane (TMS), phosphate-buffered saline (PBS) and sodium salicylate were bought from Huashun Biological Technology Co., Ltd (Wuhan, China). Dulbecco's minimal essential medium (DMEM), penicillin, streptomycin, trypsin, Cell Counting Kit (CCK-8), paraformaldehyde, Triton X-100, polyvinylidene difluoride (PVDF) membranes were purchased from Sigma. Primary antibodies against glyceraldehyde 3-phosphate dehydrogenase (GAPDH), Bax, Bcl-2, p42/44MAPK and p38MAPK were bought from Beyotime Biotechnology. Horseradish peroxidase (HRP)-conjugated goat antimouse and antirabbit IgG secondary antibodies were obtained from Sigma.
000), deuterated chloroform (CDCl3), trimethylsilane (TMS), phosphate-buffered saline (PBS) and sodium salicylate were bought from Huashun Biological Technology Co., Ltd (Wuhan, China). Dulbecco's minimal essential medium (DMEM), penicillin, streptomycin, trypsin, Cell Counting Kit (CCK-8), paraformaldehyde, Triton X-100, polyvinylidene difluoride (PVDF) membranes were purchased from Sigma. Primary antibodies against glyceraldehyde 3-phosphate dehydrogenase (GAPDH), Bax, Bcl-2, p42/44MAPK and p38MAPK were bought from Beyotime Biotechnology. Horseradish peroxidase (HRP)-conjugated goat antimouse and antirabbit IgG secondary antibodies were obtained from Sigma.
Human hepatoma (HepG2) cell lines were purchased from Beyotime Biotechnology (Wuhan, China). Cells were grown in DMEM medium (37 °C, 5% CO2 humidified atmosphere) supplemented with 10% (v/v) fetal bovine serum and antibiotic supplements (penicillin and streptomycin at both 100 units mL−1). Female BALB/c-nu mice (14–16 g) were obtained from the Animal Center of Wuhan University. The mice had free access to standard chow food and were housed at 50% relative humidity (25 °C) for 12 h light/dark cycle. This study was performed in strict accordance with the NIH guidelines for the care and use of laboratory animals (NIH publication no. 85-23 rev. 1985) and was approved by the Disease Control and Prevention of Hubei Province (Wuhan, China).
Preparation and characterization of PTX-loaded MS
In this study, the smooth and rough PTX-PLGA-MS were prepared by modified single emulsion technique and double-emulsion solvent evaporation method, respectively. For the preparation of rough PTX-PLGA-MS, the ABC solution (5 mg mL−1 in deionized water (DI)) were used as the internal water phase (W1), and the oil phase (O) were obtained by dissolving PTX (20 mg) and PLGA (200 mg) in 6 mL DCM. Then, the W1 and O phases were probes sonicated in an ice-water bath for 90 s to form the homogeneous emulsion. Under magnetic stirring, the resultant emulsion was transferred into 100 mL 2 wt% PVA solution (external water phase, W2), and was continuously stirred at 800 rpm for complete solvent evaporation. Afterwards, the redundant PVA and non-incorporated drugs were removed by DI washing and centrifugalizing (2000 rpm) the solidified MS, which were lyophilized and stored in a vacuum desiccator at −20 °C for further analysis. For the smooth PTX-PLGA-MS preparation, the O/W2 emulsion method was performed with the external PVA concentration at 0.5 wt%. Additionally, the blank PLGA-MS were prepared by the same parameters without addition of PTX drugs.The FT-IR spectra of free PTX, PLGA, and PTX-PLGA-MS were studied using a Nicolet6700 FTIR spectrometer (Bruker, Germany) with the wavelength range from 400 to 4000 cm−1. 1H NMR spectra were recorded on a Bruker AVANCE 500MHZ (AV 500, Germany) spectrometer at 400 MHz (25 °C), taking CDCl3 as eluent and TMS as internal reference. The XRD (Bruker D8 Advance, Germany) and DSC (PE, USA) were used to investigate the physical state of PTX drugs in PTX-PLGA-MS. The XRD was performed with a Cu Kα radiation (Ni filter) and a diffraction 2θ range of 6–60°. The DSC was conducted over a temperature range of 40 to 400 °C with a constant heating rate of 10 °C min−1. The equipment was purged with nitrogen atmosphere (30 mL min−1) and liquid nitrogen was used to reestablish the starting temperature.
Morphology analysis of PTX-loaded MS
To evaluate the morphology of PTXloaded MS, MS were visualized using SEM (Zeiss Ultra Plus, Germany). Briefly, samples were sprinkled on a double-sided adhesive tape previously applied to an aluminum stub and then fixed onto a graphite surface. The samples were coated with a 30 nm layer of gold and viewed under SEM at 25.0 kV. Furthermore, to investigate MS internal and microstructure, the synchrotron radiation X-ray microtomography scans (SR-μCT, Shanghai Synchrotron Radiation Facility (SSRF)) were conducted with BL13W1. Samples were blended in a micropipette container and scanned with SR-μCT at 15.0 keV. The pixel size was 3.25 μm, exposure time was 5.0 s, and sample-to-detector distance was 12.0 cm. For each acquisition, after penetration through the samples, 630 projection images over 180° were taken. The total projected images were reconstructed and enhanced the quality using the X-TRACT SSRF CWS x64. Moreover, the three dimension (3D) rendered data were analyzed with VGStudio Max (Version 2.1, Volume Graphics GmbH, Germany) and Image Pro Analyzer 3D (Version 7.0, Media Cybernetics, USA).Loading and in vitro release experiments of drug
The ultraviolet (UV) spectrometer (UV-2550, SHIMADZU, Japan) were used to analyze the drug loading (DL) and encapsulate efficiency (EE) of PTX-loaded MS. First, a range of standard PTX concentrations (0–100 μg mL−1) were detected to determine the calibration curve of PTX, and the obtained standard curve with high correlation coefficient (R2 = 0.99958) was satisfied. 10 mg MS were dissolved in 5 mL DCM with stirring overnight to ensure thorough dissolution. Then, the above solution was added with 10 mL methanol and was vortexed for 2 min before being measured by UV detection. The following equations were used to calculate the DL and EE.| Drug loading(%) = (weight of drugs in microspheres)/(weight of microspheres) × 100% |
| Encapsulate efficiency(%) = actual drug loading%/theoretical drug loading% × 100% |
For free PTX release experiment, 2 mg PTX were suspended in 5 mL sodium salicylate/PBS (pH 7.4) medium (1 mol L−1) in a dialysis membrane (MWco 14![[thin space (1/6-em)]](https://www.rsc.org/images/entities/char_2009.gif) 000 Da). Additionally, 15 mg drug-loaded MS were suspended in the medium to determine their release behaviors. The dialysis bag was immersed into a screw-capped tube with 50 mL the aforementioned solution, which then was placed horizontally in a 37 °C orbital shaker (HZQ-F160, Harbin, China). At certain time intervals, 2 mL release medium in the tube was collected for UV absorbance analysis (227 nm) and the system was replaced with 2 mL fresh medium. The drug release amount was determined using the above calibration equation.
000 Da). Additionally, 15 mg drug-loaded MS were suspended in the medium to determine their release behaviors. The dialysis bag was immersed into a screw-capped tube with 50 mL the aforementioned solution, which then was placed horizontally in a 37 °C orbital shaker (HZQ-F160, Harbin, China). At certain time intervals, 2 mL release medium in the tube was collected for UV absorbance analysis (227 nm) and the system was replaced with 2 mL fresh medium. The drug release amount was determined using the above calibration equation.
In vitro antitumor activity
The antitumor activities of free PTX, smooth and rough PTX-PLGA-MS were evaluated by seeding HepG2 cells in 96-well plates (5 × 10³ cells per well) in 200 μL DMEM. The empty PLGA-MS was selected as control group. Upon 80% of cells grew with adherence, the smooth and rough MS with equivalent PTX concentrations (0.01–100 μg mL−1 in 20 μL PBS) were added to each well for 48 h. Additionally, HepG2 cells were incubated with equivalent PTX concentrations (0.01–100 μg mL−1) of free PTX and rough PTX-PLGA-MS for 24, 48 and 72 h to compare their antitumor effects. After incubation, the plates were replenished with 200 μL DMEM and 10 μL CCK-8 solution, and then were incubated in a 37 °C (5% CO2) atmosphere for another 2 h. The solution absorbencies were measured on an ELISA (Multiskan, Thermo Fisher, Finland) micro-plate reader at 450 nm. Cell viability was calculated using the following equation:| Cell viability(%) = (Asample − APBS)/(APBS − Acell) × 100% |
In vivo antitumor efficacy
The tumor xenograft models were created to determine whether the rough PTX-PLGA-MS obtained improved in vivo therapeutic efficacy than free PTX and smooth MS. Specifically, the freshly harvested HepG2 cells (3 × 10⁶ cells per mouse in PBS medium) were subcutaneously inoculated in the right flank region of BALB/c-nu mice. Tumor volumes were measured using a vernier caliper and were calculated as V = d2 × D/2 (d and D represent the shortest and the longest tumor diameter, respectively). The mice were randomly divided into four groups, when the average tumor volume reached approximately 280 mm.3 For each group, the tumors of four mice were excised and weighted at the beginning of the treatment. The remaining mice were administered via intratumoral injection. As the released drug amount from rough MS was 88% for 13 days, the rough and smooth MS were injected every 13 days, while the saline and free PTX were injected every four days. The free PTX treatment dosage was set as 10 mg kg−1, and the rough and smooth MS were chosen at 30 mg PTX equiv. kg−1, as the different injections but the same whole dose should be chosen. After injections, the tumor volumes were recorded every four days, and the tumor growth rate (from day 17 to day 40) was calculate as tumor growth volumes per days (mm3 day−1). The mice body weights were recorded throughout the experiment. At the end of the experiment, the excised tumors were photographed and weighted.Histological analysis
At the end of the treatment, the organs and tumor tissues of each mouse were excised, fixed with 4% (v/v) paraformaldehyde (24 h), embedded in paraffin, and cut into 4 μm thin sections. The slices were affixed to glass slides, deparaffinised in xylene, rehydrated in ethanol, rinsed with DI and then fixed with 4% (v/v) formaldehyde. Thereafter, the slices were stained by hematoxylin and eosin (HE), and were observed by fluorescence microscope (Olympus, IX71, Japan). For TUNEL experiments, the paraffin-embedded tissue sections were dewaxed and incubated with a proteinase K solution (21–37 °C, 15–30 min). Then, the sections were treated with FragELTM DNA fragment detection kit according to the manufacturer's protocol (EMD Chemicals Inc, Darmstadt, Germany). Images were taken with a Nikon A1R confocal microscope.In vivo molecular biology studies
The in vivo mRNA and proteins expression levels of different treatments on liver tumors were evaluated by Quantitative Real-Time PCR (qRT-PCR) and Western-blot. Total RNA of tumor tissues was extracted using the RNeasy Kit (Qiagen, Hilden, Germany). The reverse transcription reaction was performed using SuperscriptIII (Invitrogen) in a final volume of 20 mL containing 5 mg of total RNA, and was terminated by heating at 72 °C for 15 min. The newly synthesized cDNA were amplified using the PCR synthesis kit (Invitrogen). PCR fragments were visualized by ethidium bromide staining. PCR amplifications were performed with SYBR Premix (Invotrogen) on an Applied Biosystems7500 Fast. The relative mRNA expression results calculated from the changes in the threshold method were represented as relative fold induction compared to control samples and were normalized to the control GAPDH gene. The primer sequences were as follows (Table 1).| Gene name | Forward primer | Reverse primer | Band size (bp) |
|---|---|---|---|
| GAPDH | AGGAGCGAGACCCCACTAACA | AGGGGGGCTAAGCAGTTGGT | 247 |
| Bax | GCCTTTTTGCTACAGGGTTTCAT | TATTGCTGTCCAGTTCATCTCCA | 151 |
| Bcl-2 | TGACTTCTCTCGTCGCTACCGT | CCTGAAGAGTTCCTCCACCACC | 112 |
| PTEN | TCAAGAGGATGGATTCGACTT | CGCCACTGAACATTGGAATA | 572 |
| TNF-α | CAGCCTCTTCTCCTTCCTGA | GGAAGACCCCTCCCAGAT AGA | 503 |
For Western-blot test, tumor tissues after treatment were homogenized, dissolved in RIPA buffer and centrifuged (12![[thin space (1/6-em)]](https://www.rsc.org/images/entities/char_2009.gif) 000 rpm, 4 °C) for 10 min. Protein concentration was quantitated by BCA protein assay kit, and equal amounts (30 μg) of cellular proteins were separated by 10% (v/v) SDS-PAGE gels. After incubated with 0.5% (v/v) Triton X-100 (10 min), proteins were transferred to a PVDF membrane. The following dilutions were used for individual antibodies against different proteins: Bax (1
000 rpm, 4 °C) for 10 min. Protein concentration was quantitated by BCA protein assay kit, and equal amounts (30 μg) of cellular proteins were separated by 10% (v/v) SDS-PAGE gels. After incubated with 0.5% (v/v) Triton X-100 (10 min), proteins were transferred to a PVDF membrane. The following dilutions were used for individual antibodies against different proteins: Bax (1![[thin space (1/6-em)]](https://www.rsc.org/images/entities/char_2009.gif) :
:![[thin space (1/6-em)]](https://www.rsc.org/images/entities/char_2009.gif) 500); Bcl-2 (1
500); Bcl-2 (1![[thin space (1/6-em)]](https://www.rsc.org/images/entities/char_2009.gif) :
:![[thin space (1/6-em)]](https://www.rsc.org/images/entities/char_2009.gif) 1000); p42/44MAPK (1
1000); p42/44MAPK (1![[thin space (1/6-em)]](https://www.rsc.org/images/entities/char_2009.gif) :
:![[thin space (1/6-em)]](https://www.rsc.org/images/entities/char_2009.gif) 1600); p38MAPK (1
1600); p38MAPK (1![[thin space (1/6-em)]](https://www.rsc.org/images/entities/char_2009.gif) :
:![[thin space (1/6-em)]](https://www.rsc.org/images/entities/char_2009.gif) 1000). Then the membrane was blocked with 5% (v/v) nonfat dry milk in TBST for 4 h (37 °C), incubated with a specific primary antibody overnight (4 °C) and further an appropriate HRP-labeled secondary antibody (2 h, 4 °C). Specific protein detections were dyed using the BCIP/NBT Alkaline Phosphatase Color Development Kit and the intensity bands of proteins were quantified by Quantity One software.
1000). Then the membrane was blocked with 5% (v/v) nonfat dry milk in TBST for 4 h (37 °C), incubated with a specific primary antibody overnight (4 °C) and further an appropriate HRP-labeled secondary antibody (2 h, 4 °C). Specific protein detections were dyed using the BCIP/NBT Alkaline Phosphatase Color Development Kit and the intensity bands of proteins were quantified by Quantity One software.
Statistical analysis
All numerical data were given as the mean ± standard deviation. At least three replicates were set up in each group, and three independent experiments were performed. The results were statistically analyzed using one-way ANOVA through SPSS. P < 0.05 was considered statistically significant.Results and discussion
PTX-PLGA-MS preparation and characterization
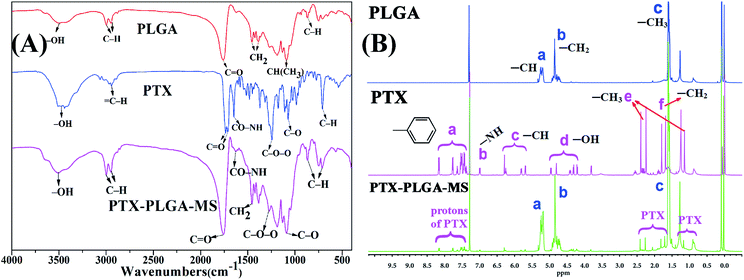
In this study, the rough PTX-PLGA-MS were prepared using modified double-emulsion solvent evaporation technique. Generally, the process parameters of internal ABC and external PVA phases have significant influences on the surface and inner morphology of MS. The use of internal ABC solution could produce carbon dioxide in the W1/O emulsion, thus produced internal porous structure throughout the PLGA matrices during MS solidification. Additionally, the spontaneous coalescence of multi-core globules can be avoided by the metastable emulsion droplets collision, as the high PVA concentration may stabilize the interfacial inherent thermodynamic between the W1/O and W2 immiscible phases.40To verify the successful drug encapsulation, the FT-IR and 1H NMR spectra of PLGA, free PTX, and PTX-PLGA-MS were analyzed. The major infrared peaks assigned to PLGA (Fig. 1A) were observed at 2998 cm−1 (C–H), 1759 cm−1 (C![[double bond, length as m-dash]](https://www.rsc.org/images/entities/char_e001.gif) O), 1455 cm−1 (–CH2), and 1310 cm−1 CH(CH3). The PTX spectrum showed characteristic peaks at 2946 cm−1 (
O), 1455 cm−1 (–CH2), and 1310 cm−1 CH(CH3). The PTX spectrum showed characteristic peaks at 2946 cm−1 (![[double bond, length as m-dash]](https://www.rsc.org/images/entities/char_e001.gif) C–H), 1735 and 1715 cm−1 (C
C–H), 1735 and 1715 cm−1 (C![[double bond, length as m-dash]](https://www.rsc.org/images/entities/char_e001.gif) O carbonyl ketone group), 1648 cm−1 (amide group), 1248 cm−1 (C–O–O bending vibrations), 1072 cm−1 (C–O stretch vibration), and 709 cm−1 (aromatic C–H). The 1H NMR signals (Fig. 1B) observed at 1.59, 4.85, and 5.18 ppm are referred to protons of methyl, methylene, and methine groups of PLGA polymers correspondingly. Meanwhile, the PTX spectrum showed signals arising from methyl (1.27 ppm), acetyl (1.71–2.41 ppm), hydroxy (4.21–4.96 ppm), and aromatic (7.38–8.16 ppm) protons. Noteworthy, all the peaks and signals of drugs and PLGA were visible in PTX-PLGA-MS spectra, indicating that the PTX substances were successfully encapsulated in MS without chemical changes and interactions. However, some PTX bands were not prominent in PTX-PLGA-MS, which might be because the PTX were completely encapsulated in the porous internal cores of PLGA matrices or appeared at almost the same wave numbers as PLGA.
O carbonyl ketone group), 1648 cm−1 (amide group), 1248 cm−1 (C–O–O bending vibrations), 1072 cm−1 (C–O stretch vibration), and 709 cm−1 (aromatic C–H). The 1H NMR signals (Fig. 1B) observed at 1.59, 4.85, and 5.18 ppm are referred to protons of methyl, methylene, and methine groups of PLGA polymers correspondingly. Meanwhile, the PTX spectrum showed signals arising from methyl (1.27 ppm), acetyl (1.71–2.41 ppm), hydroxy (4.21–4.96 ppm), and aromatic (7.38–8.16 ppm) protons. Noteworthy, all the peaks and signals of drugs and PLGA were visible in PTX-PLGA-MS spectra, indicating that the PTX substances were successfully encapsulated in MS without chemical changes and interactions. However, some PTX bands were not prominent in PTX-PLGA-MS, which might be because the PTX were completely encapsulated in the porous internal cores of PLGA matrices or appeared at almost the same wave numbers as PLGA.
Subsequent to the confirmed chemical structures, the morphology of the smooth and rough PTX-PLGA-MS were obtained from SEM and SR-μCT observations. As shown in Fig. 2A, the smooth MS were well-dispersed spherical particles with smooth surface and internal sporadic porosity. While, the rough MS (Fig. 2B) displayed microporous surface and highly porous internal structures. The 3D cross-section micrographs (Fig. 2C) indicated that the rough MS displayed regular spherical profiles and porous internal structure with big holes. During the process of drug-loaded MS formulation, the PLGA polymers tended to precipitate to form a macromolecular network structure and subsequently a polymeric MS skeleton, which significantly limited the possibility of drug leakage and aggregation, resulting in well-dispersed PTX drugs in MS. For the rough MS, the ABC solution trapped in the interior of MS could produce carbon dioxide, which then escape and leave empty spaces after drying, thus leading to many big pores in MS matrices. As the gases may further escape from the MS surface, leaving pores on the surface, the formation of microporous surface was facilitated by the use of higher external PVA concentration. Because the high PVA concentration may increase the viscosity of the double emulsion, thus stabilizing emulsion droplets against coalescence.41 Additionally, the carbon dioxide diffusion rate was slow down, because the small W1/O droplets were encapsulated in the high viscosity PVA globules, thus the prepared rough MS were endowed with deep surface folds. Morphological analysis verified that the rough PTX-PLGA-MS possessed a novel morphology of microporous surface and internal porous structures. The internal and microstructural details of MS obtained from the SR-μCT technique provide a better way to investigate the drug encapsulation and distribution properties.42 This highly porous internal structure could provide enough hydrophobic space, which enabled the drugs to have a better place to adhere to. The specific aim of this work was to evaluate whether the novel morphology had significant influences on the PTX-loading quantity and in vitro PTX release behaviors.
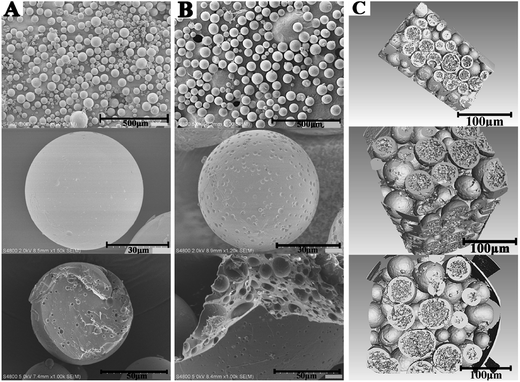 | ||
| Fig. 2 The surface and fractured internal SEM micrographs of (A) smooth PTX-PLGA-MS and (B) rough PTX-PLGA-MS. (C) The 3D outer and inner morphometric of rough PTX-PLGA-MS. | ||
Drug stability and thermal analysis of PTX-PLGA-MS
Generally, the crystallinity changes of drugs during MS formulation process obviously affect the drug release rate and its increased bioavailability.33 To investigate the physical state of drugs, XRD and DSC analysis were conducted for free PTX, PLGA, physical mixture and the acquired PTX-PLGA-MS. As shown in Fig. 3A, PTX powders displayed a few typical diffraction peaks at 8.9°, 12.6°, 16.8° and 34.1°, suggesting that it is crystalline. The pattern of amorphous PLGA polymer exhibited a broad peak at the region between 16.2° and 23.1°. Meanwhile, in the physical mixture spectrum, the characteristic PTX peaks were found at the same positions as that in PTX powder, indicating that PTX in the mixture is also crystalline. However, the sharp PTX diffraction peaks disappeared and only a small PTX peaks could be detected in the diffractogram of PTX-PLGA-MS, which might be because the PTX were distributed in amorphous state. This was a readily bioavailable state which allowed fast drug release from microspheres following intratumoral administration. Furthermore, the crystallinity decrease in PLGA would facilitate the degradation of PLGA and thus the release of PTX from polymer matrices.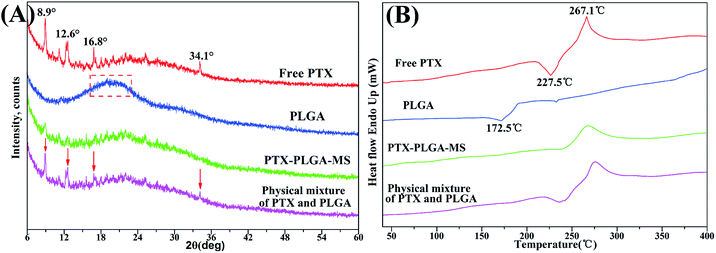 | ||
| Fig. 3 XRD patterns and DSC thermograms of free PTX, PLGA, PTX-PLGA-MS and physical mixture. The arrows point out typical diffraction peaks of PTX in the physical mixture. | ||
The PTX DSC thermogram (Fig. 3B) exhibited a sharp endothermic peak (267.1 °C) and an exothermic peak (227.5 °C), which was attributed to the melting of PTX, also indicating its crystalline nature. Interestingly, PLGA polymer showed an exothermic peak at 172.5 °C which is most probably related to the phase transition and decomposition of PLGA polymer.43 For the physical mixture, the endothermic and exothermic peaks corresponding to PTX drugs melting were also presented with only a slight shift. While, the PTX-PLGA-MS displayed only a broad endothermic peak, suggesting that PTX was existed in a disorder crystalline phase of an amorphous state, and was improved in terms of long-term stability and bioavailability. The generated DSC thermograms and their respective endothermic values indicated that the drug and preparation method had little effect on the thermal properties of the polymer.44 These findings are highly consistent with the XRD results above and previous studies that the solubilization of drugs in the core of PTX-PLGA-MS leads to the crystalline PTX molecules melting peak disappearance.45,46 Moreover, in view of the goal of the current formulation to provide a constant rapid drug release, the molecular dispersions of PTX drugs seems to give better release profiles for the intended drug delivery applications.
Drug loading and in vitro release analysis of PTX-PLGA-MS
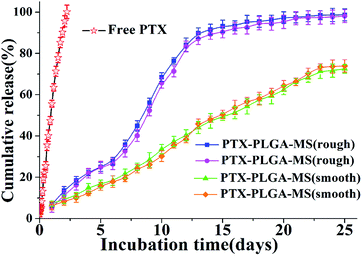
Generally, the hydrophobic PLGA matrices possessed a readily incorporation of hydrophobic PTX drugs. The prepared smooth PTX-PLGA-MS with internal sporadic porosity achieved a relative low DL (9.8%) and EE (83.6%). While the rough PTX-PLGA-MS achieved higher DL (17.8%) and EE (93.2%), because the internal porous MS matrices provide enough hydrophobic space for PTX-package and the high external PVA concentration could prevent the drug-leakage. As the drug release from a carrier system is an important property for their biomedical application in cancer treatment, the release patterns of smooth and rough MS were performed to investigate how the MS morphology affected their in vitro drug release behaviors. Noteworthy, in order to provide valid in vitro release data, two groups of each PTX-PLGA-MS samples were obtained by two independent MS preparation experiments using the same experimental method. The free PTX release pattern displayed a zero-order release phase (Fig. 4) with the 48 h cumulative drug release amount at 88%. The smooth MS release patterns were found to be approximately linear with correlation coefficients from 0.989 to 0.993. Additionally, the rough MS exhibited S-curve release patterns and the drug release amount was approximately 13% and 88% at 48 h and 13 days, respectively. The two groups release data of each PTX-PLGA-MS samples showed no significant difference.The use of large PVA volume directly affected the migration of drugs and accelerated the solidification of PTX in polymer matrices. As mentioned above that the hydrophobic PTX substances were considered to amorphous inside the MS matrices. The hydrolysis of PLGA polymer would destroy their internal structure as well as change the original crystallization features. The slow linear release for smooth MS was mainly because of the initial release of drugs dispersed on MS surface and the follow slow drug release which was slowed down by the low MS matrices degradation rate and internal sporadic porosity. Nevertheless, the fast drug release for rough MS from day 7 was attributed to the mesopores drug diffusion from MS matrices. The rough MS with deep surface folds degraded faster than smooth MS, and the drug diffusion and migration were accelerated by the immersion of the release medium in the matrices. The effective drug release could be facilitated by the accelerated drug release rate, thus reducing the risk of drug resistance. Overall, the rough PTX-PLGA-MS achieved the enhancement of drug stability, the relatively fast drug release and the sustained drug release in consequence.
In vitro antitumor activity
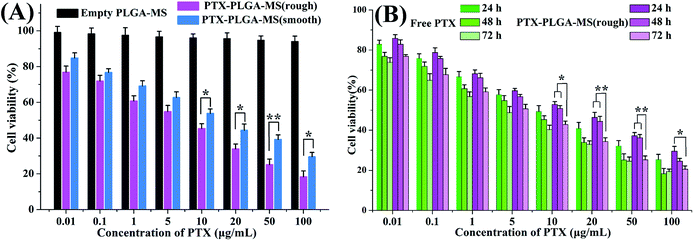
The antitumor activity of empty PLGA-MS and PTX preparations on HepG2 cells were evaluated to determine whether the rough PTX-PLGA-MS with rapid sustained PTX release had good antitumor efficiency. The cells incubated with empty PLGA-MS even at the highest concentration exhibited normal growth state (Fig. 5A), suggesting its negligible cytotoxicity. Whereas, the free PTX and rough MS groups displayed cytotoxic potency to the HepG2 cells proliferation in a dose- and time-dependent manner (Fig. 5B). Furthermore, the IC50 value of rough MS treated group (3.25 ± 0.46 μg mL−1) was lower than free PTX (6.02 ± 0.42 μg mL−1) and smooth MS (8.66 ± 0.53 μg mL−1) groups, which indicated that the rough MS would possess the efficient transport of sustained-release drugs into HepG2 cells, thus achieving superior antitumor effects. Noteworthy, the cell viability of rough MS treated group showed significant difference compared to that of free PTX group at the equivalent drug concentration and certain treatment period. These findings were attributed to the sustained release property of rough MS through the combination of pores drug diffusion and polymer degradation, which would be favorable to the anticancer drug delivery with prolongation of incubation. The fact that the rough PTX-PLGA-MS shows a continued inhibition to HepG2 cells rather than a sharp inhibition caused by free PTX demonstrated that the rough MS possessed significant enhanced antitumor efficiency than free PTX and smooth MS.In vivo antitumor efficacy
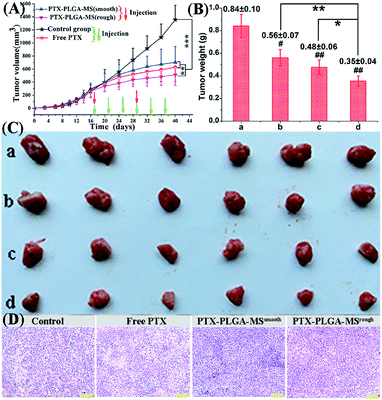
In order to monitor the tumor inhibition efficacy and system toxicity of PTX formulations, the changes in tumor volume were assessed in samples treated HepG2 tumor xenograft mice, and at the end of the experiment, the excised tumors were photographed and weighed.47 Fig. 6A showed that the saline treated group exhibited the fast tumor growth rate with the mean tumor volume expanded from 260.26 to 1226.54 mm3 within 24 days. However, as shown in Table 2, the tumor volumes of PTX preparations groups were significantly smaller, and the free PTX played a very weak antitumor effect with the tumor volume developing to 629.36 ± 218.83 mm3. The final tumor weight for rough PTX-PLGA-MS group was smaller than that of free PTX and smooth MS groups (Fig. 6B). The tumor weight and volume reduction percentage (Table 2) indicated that the rough MS possessed significant tumor suppression effect for the rapid sustained drug release. Additionally, tumor inhibition efficiency was calculated based on the tumor weights and volumes, and the rough MS (512.63 ± 162.34 mm3) efficiently inhibited tumor growth (58.33%), which was 1.36-, and 1.75-fold higher than that of free PTX and smooth MS, respectively. The rough MS possessed superior antitumor efficacy with the improved inhibitory effect of PTX with 54.75%, which might be attributed to the efficient drug delivery, penetration and accumulation in tumor sites.48 Furthermore, the free PTX group showed a negative antitumor effect because of the high plasma drug concentration in the body caused by the frequency of drug use. Mice injected with free PTX frequently exhibited noticeable hypersensitivity symptoms including dyspnea, shock and convulsions within 10 min post-injection.| Sample groups | Tumor weight (g) | Tumor volume (mm3) | ||||
|---|---|---|---|---|---|---|
| At beginning | At end | % reductiona | At beginning | At end | % reductionb | |
a Tumor weight reduction percentage was calculated using the following equation:  .b Tumor volume reduction percentage was calculated using the following equation: .b Tumor volume reduction percentage was calculated using the following equation:  Increased Wcontrol and Vcontrol represent the increased weight and volume of control group, similarly the increased Wsamples and Vsamples represent the increased weight and volume of sample groups. Increased Wcontrol and Vcontrol represent the increased weight and volume of control group, similarly the increased Wsamples and Vsamples represent the increased weight and volume of sample groups. |
||||||
| Saline | 0.17 ± 0.02 | 0.84 ± 0.10 | 0 | 260.26 ± 98.69 | 1226.56 ± 223.12 | 0 |
| Free PTX | 0.19 ± 0.04 | 0.48 ± 0.06 | 56.72% | 286.09 ± 123.09 | 629.36 ± 218.83 | 64.47% |
| Smooth MS | 0.20 ± 0.03 | 0.56 ± 0.07 | 46.27% | 294.91 ± 88.35 | 702.69 ± 242.79 | 57.79% |
| Rough MS | 0.16 ± 0.02 | 0.35 ± 0.04 | 71.64% | 264.43 ± 83.74 | 512.65 ± 163.75 | 74.31% |
The representative photographs (Fig. 6C) of excised tumors showed a direct intuitive proof of the remarkable tumor inhibition effect of rough MS. It is noteworthy that the rough MS treated group (10.34 mm3 day−1) exhibited lower tumor growth rate than free PTX (15.98 mm3 day−1) and smooth MS (19.58 mm3 day−1) groups, suggesting their higher tumor growth inhibition potency. The HE staining images of PTX formulations treated groups (Fig. 6D) exhibited necrosis areas (pyknosis, karyorrhexis), which were composed of an extensive lymphocyte infiltration into the tumor tissues and a low presence of connective tissues. However, the control group displayed noticeably higher tumor cell density, negligible necrosis and sporadic cell apoptosis. The rough MS group caused the most extensive cell apoptosis and necrosis with one therapeutic course (13 days), which might be because these MS could evenly disperse and adhere throughout the tumor sites, reduce drug distribution in normal tissues and achieve a significant inhibitory effect with a relatively low dosage. Consequently, the novel rough PTX-PLGA-MS delivery system contributes to high anticancer efficiency and low incidence of side effects observed herein.
Histological analysis
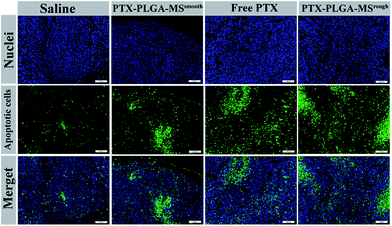
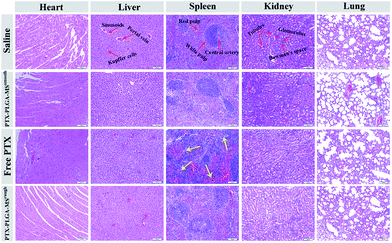
Furthermore, to assess whether the tumor growth inhibitory induced by PTX formulations was attributed to an increase in apoptotic cell death, the excised tumors and organs were analyzed by HE staining and TUNEL assay. The HE images of saline treated liver tumor tissue showed typical tumor pathological characteristic of closely arranged tumor cells. The PTX formulations treated groups exhibited obvious apoptotic response and evident necrosis (spotty death and intercellular blank) of tumor cells.49 In addition, the cell apoptosis extent was in line with the scope of tumor necrosis. For the HE images of major organs, the smooth and rough PTX-PLGA-MS treated groups (Fig. 7) displayed no obvious pathological changes in the cellular morphology, which were very similar to those of saline-treated groups. Specifically, the liver organ sections showed well-arranged hepatocytes and intact lobules, the kidney sections showed well-formed Bowman's capsule with clearly evident glomeruli, proximal and distal tubules.50 The spleen characteristic of roughly ovoid white pulps observed in splenic sections indicated the biocompatible nature of these PTX-loaded MS. Whereas, the free PTX showed toxicity to mice evidenced by some damage observed in the spleen HE images of free PTX treated group (Fig. 7, yellow arrows). Additionally, mice treated with free PTX exhibited noticeable body weight loss (Fig. S1†), while, the MS-treated mice body weight slightly increased and became stable at around 18.8 g. The stable body weight suggested that the drug-loaded MS caused negligible side effects and were suitable for system chemotherapy. The free PTX caused body weight loss was attributed to its non-selective uptake by normal tissues resulted in high drug level in the blood.As the natural necrosis would occur because of internal hypoxia inside the tumor, the TUNEL was photographed near the peripheral area of the tumor.43 As shown in Fig. 8, the viable cell nuclei of samples treated tumor tissues were dyed with dark blue and the apoptotic cell nuclei were dyed with green. The smooth PTX-PLGA-MS treatment only resulted in moderately positive TUNEL staining at the tumor peripheral area. In contrast, the rough PTX-PLGA-MS treated tumor tissues showed higher number of TUNEL positive cells (green), which was also higher than free PTX group, suggesting that the rough MS with rapid sustained PTX release caused extensive cell apoptosis throughout the tumor tissues. Noteworthy, in rough MS treatment group, the apoptotic cell nuclei showed diffuse in tumor tissue rather than only on the tumor periphery, thus suggesting that the drugs released from rough MS achieved effective delivery throughout the tumor. According to HE analysis the PTX-loaded MS had little side effects to the liver, heart and spleen, while the free PTX treated group exhibited noticeable splenic damage. Strikingly, these results corroborated that the rough MS caused little damage to the main organs while significant necrosis and apoptosis in tumor tissues, thus demonstrated the excellent anti-tumor efficacy of rough MS. The enhanced antitumor effect of rough MS is most likely due to its distinct drug release behavior in the tumor. It is noteworthy that the free PTX and PTX-PLGA-MS were intratumoral injected. As a consequence, the free PTX could diffuse throughout the tissues and immediately exert its cytotoxicity, resulting in negative tumor inhibition potency. While the rough MS might first disperse and adhere throughout the tumors, and subsequently display cytotoxicity after PTX was released from MS and uptake by the tumor cells via adsorptive endocytosis. Collectively, our results verified that compared to free PTX, the rough PTX-PLGA-MS possessed efficient tumor inhibition and negligible system toxicity to mice.
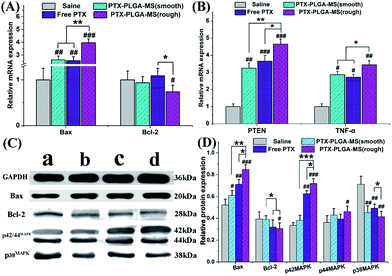
In vivo molecular biological analysis
In this work, the target siRNA of Bax and Bcl-2 indicating activation of apoptosis cascade, were evaluated as they are the most important factors in the Bcl-2 related apoptosis pathway.51 Further molecular biological evidences for the synergistic effect of PTEN and TNF-α siRNA in PTX formulations treated groups came from the immunohistochemistry assay. Fig. 9A and B showed that the rough PTX-PLGA-MS group induced the highest levels of Bax, PTEN and TNF-α mRNA expressions in tumor tissues than other treatment groups. The observed increase in pro-apoptosis related in vivo mRNA expression levels caused by the therapeutic activity of PTX drugs proved that the rough MS induced significant cell apoptosis. Interestingly, in the free PTX and smooth MS therapeutic groups, the Bcl-2 mRNA levels displayed a negligible variation. Furthermore, the free PTX and smooth MS treatment only caused medium level of pro-apoptotic activation, and neither of them was able to induce sufficient tumor cell apoptosis, as revealed by the TUNEL analysis. These results clearly demonstrated the improvement in antitumor efficiency of the rough PTX-PLGA-MS.Subsequent to the mRNA expression analysis, the immunoblotting study was performed on tumor tissues to evaluate how these multifunctional proteins contribute to the tumor inhibitory. The saline treated tumor groups showed a high expression of Bcl-2 and p38MAPK, and a low expression of Bax and p42/44MAPK (Fig. 9C and D). For the rough MS group, the p38MAPK expressions were significantly inhibited, whereas the expressions of Bax and p42/44MAPK were apparently up-regulated than that of free PTX and smooth MS groups. Additionally, the decreased cell proliferation rate observed in p42/44MAPK overexpressing tumors suggested that the p42/44MAPK protein levels may affect cell cycle progression.52 Varma et al. reported that the selective activation of p42/44MAPK may regulate baseline permeability and cGMP-induced hyperpermeability, thus affecting the drug penetration and the antitumor activity in consequence.53 In line with the RT-PCR results and previous report,54 treatment of tumor tissues with PTX drugs have similar effects on the expression of Bax and Bcl-2 proteins. It is noteworthy that the involvement of these molecule pathways is essential for the enhancement of PTX toxicity in tumor tissues. These results were consistent with the in vitro and in vivo antitumor results, which indicated that the PTX-mediated mitotic arrest was significantly affected by the activation of these proteins. The rough MS possessed highly chemotherapy sensitizing effect, which could increase drug accumulation and uptake in both inherent and acquired liver tumor cells. Consequently, the rough PTX-PLGA-MS with high drug-loading capacity and rapid sustained drug release could cause extensive tumor apoptosis and less damage to normal tissues for their efficient apoptosis related proteins expression and fewer drug resistance.
Conclusions
To sum up, we prepared a novel PTX-PLGA-MS with rough surface and porous internal structure to improve the antitumor efficiency of PTX drugs and reduce drug administration frequency. Specifically, the highly porous MS matrices provided enough hydrophobic space for PTX-packaging, thus achieving a higher drug-loading efficiency and enhanced drug stability. Noteworthy, the rapid sustained drug release was attributed to the readily drug bioavailable state (amorphous) in MS matrices, as well as the microporous surface which could facilitate the degradation of MS matrices. Moreover, the rough MS significantly enhanced in vitro and in vivo antitumor efficiency than free PTX and smooth MS. The rough MS with one therapeutic course (13 days) could evenly disperse and adhere throughout the tumor sites, and reduce drug distribution in normal tissues, thus suppressed tumor growth and improved animal survival more effectively. In conclusion, our results verified that the rough PTX-PLGA-MS drug delivery system could serve as a promising anticancer agent.Conflicts of interest
The authors declare no conflicts of interest.Acknowledgements
This work was supported by the National Key R&D Program of China (No. 2017YFC1103800); the HongKong, Macao and Taiwan Science & Technology Cooperation Program of China (No. 2015DFH30180); the Science and Technology Support Program of Hubei Province (No. 2015BCE022) and the Major Special Projects of Technological Innovation of Hubei Province (No. 2017ACA168).Notes and references
- T. D. Baere, Y. Arai, R. Lencioni, J. F. Geschwind, W. Rilling, R. Salem, O. Matsui and M. C. Soulen, Cardiovasc. Intervent. Radiol., 2016, 39, 334–343 CrossRef PubMed.
- H. L. Zhang, M. D. Wang, X. Zhou, C. J. Qin, G. B. Fu, L. Tang, H. Wu, S. Huang, L. H. Zhao, M. Zeng, J. Liu, D. Cao, L. N. Guo, H. Y. Wang, H. X. Yan and J. Liu, Cancer Lett., 2017, 388, 1–11 CrossRef CAS PubMed.
- J. Fairman, K. H. Liu and S. Menne, BMC Cancer, 2017, 17, 172–182 CrossRef PubMed.
- B. B. Prasad, Y. H. Ha, S. K. Lee and J. K. Kim, Journal of Mechanical Science and Technology, 2016, 30, 5837–5845 CrossRef.
- M. M. Haddad, K. W. Merrell, C. L. Hallemeier, G. B. Johnson, T. Mounajjed, K. R. Olivier, J. L. Fidler and S. K. Venkatesh, Abdominal Radiology, 2016, 41, 2061–2077 CrossRef PubMed.
- S. Ribback, V. Sailer, E. Böhning, J. Günther, J. Merz, F. Steinmüller, K. Utpatel, A. Cigliano, K. Peters, M. G. Pilo, M. Evert, D. F. Calvisi and F. Dombrowski, Int. J. Mol. Sci., 2016, 17, 1618–1635 CrossRef PubMed.
- Y. R. Xu, S. Asghar, H. Y. Li, M. L. Chen, Z. G. Su, Y. F. Xu, Q. N. Ping and Y. Y. Xiao, Colloids Surf., B, 2016, 142, 81–88 CrossRef CAS PubMed.
- L. L. Shi, C. Tang and C. H. Yin, Biomaterials, 2012, 33, 7594–7604 CrossRef CAS PubMed.
- Y. T. Yoshizawa, Y. Kono, K. Ogawara, T. Kimura and K. Higaki, Int. J. Pharm., 2011, 412, 132–141 CrossRef CAS PubMed.
- Y. Takei, K. Kadomatsu, T. Goto and T. Muramatsu, Cancer, 2006, 107, 864–873 CrossRef CAS PubMed.
- P. Pitchakarn, S. Umsumarng, S. Mapoung, P. Ting, P. Temviriyanukul, W. Punfa, W. Pompimon and P. Limtrakul, J. Nat. Med., 2017, 71, 693–702 CrossRef CAS PubMed.
- E. Pérez, A. Martínez, C. Teijón, R. Olmo, J. M. Teijón and M. D. Blanco, Int. J. Pharm., 2015, 492, 10–19 CrossRef PubMed.
- J. Q. Lu, Y. X. Huang, W. C. Zhao, R. T. Marquez, X. J. Meng, J. Li, X. Gao, R. Venkataramanan, Z. Wang and L. Song, Biomaterials, 2013, 34, 1591–1600 CrossRef CAS PubMed.
- J. Lövey, K. Fazekas, A. Ladányi, G. Németh and J. Tímár, Strahlenther. Onkol., 2003, 179, 812–818 CrossRef PubMed.
- X. Y. Jiang, H. L. Xin, Q. Y. Ren, J. J. Gu, L. J. Zhu, F. Y. Du, C. L. Feng, Y. K. Xie, X. Y. Sha and X. L. Fang, Biomaterials, 2014, 35, 518–529 CrossRef CAS PubMed.
- R. Zhang, K. Luo, J. Y. Yang, M. Sima, Y. G. Sun, M. M. Janát-Amsbury and J. Kopeček, J. Controlled Release, 2013, 166, 66–74 CrossRef CAS PubMed.
- X. F. Ding, X. Xu, Y. Zhao, L. H. Zhang, Y. D. Yu, F. Huang, D. Z. Yin and H. Huang, RSC Adv., 2017, 7, 35086–35095 RSC.
- W. Gao, Y. Chen, D. H. Thompson, K. Park and T. L. Li, J. Controlled Release, 2016, 237, 168–176 CrossRef CAS PubMed.
- Z. Zhao, Y. Li and M. B. Xie, Int. J. Mol. Sci., 2015, 16, 4880–4903 CrossRef CAS PubMed.
- N. Zhang, H. Chen, A. Y. Liu, J. J. Shen, V. Shah, C. Zhang, J. Hong and Y. Ding, Biomaterials, 2016, 74, 280–291 CrossRef CAS PubMed.
- Y. Zou, Y. Song, W. J. Yang, F. H. Meng, H. Y. Liu and Z. Y. Zhong, J. Controlled Release, 2014, 193, 154–161 CrossRef CAS PubMed.
- Y. L. Cheng, C. L. He, J. X. Ding, C. S. Xiao, X. L. Zhuang and X. S. Chen, Biomaterials, 2013, 34, 10338–10347 CrossRef CAS PubMed.
- K. F. Martins, A. D. Messias, F. L. Leite and E. A. R. Duek, Mater. Res., 2014, 17, 650–656 CrossRef CAS.
- J. Shiny, T. Ramchander, P. Goverdhan, M. Habibuddin and J. V. Aukunuru, Int. J. Pharm. Invest., 2013, 3, 119–125 CrossRef PubMed.
- S. H. Ranganath, I. Kee, W. B. Krantz, P. K. H. Chow and C. H. Wang, Pharm. Res., 2009, 26, 2101–2114 CrossRef CAS PubMed.
- Z. Y. Mao, Z. W. Fang, Y. Q. Yang, X. Chen, Y. G. Wang, J. Kang, X. H. Qu, W. E. Yuan and K. R. Dai, RSC Adv., 2017, 7, 24607–24615 RSC.
- Y. W. Hu, Y. Z. Du, N. Liu, X. Liu, T. T. Meng, B. L. Cheng, J. B. He, J. You, H. Yuan and F. Q. Hu, J. Controlled Release, 2015, 206, 91–100 CrossRef CAS PubMed.
- Y. Ding, Y. Y. Zhou, H. Chen, D. D. Geng, D. Y. Wu, J. Hong, W. B. Shen, T. J. Hang and C. Zhang, Biomaterials, 2013, 34, 10217–10227 CrossRef CAS PubMed.
- J. Bile, M. A. Bolzinger, C. Vigne, O. Boyron, J. P. Valour, H. Fessi and Y. Chevalier, Int. J. Pharm., 2015, 494, 152–166 CrossRef CAS PubMed.
- Y. L. Zhou, Y. L. Zhao, H. T. Wang and Q. G. Du, J. Polym. Sci., Part A: Polym. Chem., 2012, 50, 3537–3545 CrossRef CAS.
- J. J. Liu, D. Z. Yin, S. Zhang, H. Liu and Q. Y. Zhang, Colloids Surf., A, 2015, 466, 174–180 CrossRef CAS.
- X. W. Huanga, J. F. Gao, N. Zheng, W. Li, H. G. Xue and R. K. Y. Li, Colloids Surf., A, 2017, 517, 17–24 CrossRef.
- S. Nanaki, P. I. Siafaka, D. Zachariadou, M. Nerantzaki, D. J. Giliopoulos, K. S. Triantafyllidis, M. Kostoglou, E. Nikolakaki and D. N. Bikiaris, Eur. J. Pharm. Sci., 2017, 99, 32–44 CrossRef CAS PubMed.
- X. Wei, G. C. Zhang, L. S. Zhou and J. W. Li, Appl. Surf. Sci., 2017, 419, 744–752 CrossRef CAS.
- J. F. Gao, W. Li, J. S. P. Wong, M. J. Hu and R. K. Y. Li, Polymer, 2014, 55, 2913–2920 CrossRef CAS.
- L. Y. Wang, M. M. Cai, Y. Liu, T. Y. Yang, Y. J. Zeng, Y. L. Zhang, Q. Li, B. C. Zhu and G. H. Ma, Powder Technol., 2015, 275, 77–84 CrossRef CAS.
- S. Y. Wang, X. D. Shi, Z. H. Gan and F. Wang, Chin. J. Polym. Sci., 2015, 33, 128–136 CrossRef CAS.
- Y. Huang, X. H. Li, H. Sha, L. R. Zhang, X. Y. Bian, X. Han and B. R. Liu, Sci. Rep., 2017, 579, 658–670 Search PubMed.
- M. S. Park, K. W. Lee, H. Kim, Y. R. Choi, G. Hong, N. J. Yi and K. S. Suh, Transplant. Proc., 2017, 49, 1103–1108 CrossRef PubMed.
- K. Fang, F. Yang, Q. Y. Zhang, T. Z. Zhang and N. Gu, Mater. Lett., 2014, 117, 86–89 CrossRef CAS.
- Y. Y. Yang, T. S. Chung and N. P. Ng, Biomaterials, 2001, 22, 231–241 CrossRef CAS PubMed.
- H. Y. Han, L. Li, Y. C. Tian, Y. W. Wang, Z. S. Ye, Q. S. Yang, Y. M. Wang, R. Klitzing and X. H. Guo, RSC Adv., 2017, 7, 47877–47885 RSC.
- S. H. Ranganath, I. Kee, W. B. Krantz, P. K. H. Chow and C. H. Wang, Pharm. Res., 2009, 26, 2101–2114 CrossRef CAS PubMed.
- J. G. Hiremath, N. S. Khamar, S. G. Palavalli, C. G. Rudani, R. Aitha and P. Mura, Saudi Pharm. J., 2013, 21, 85–91 CrossRef PubMed.
- M. E. Manesh, S. H. Mostafavi, R. F. Majidi, M. N. Koopaei, N. S. Ravari, M. Amini, B. Darvishi, S. N. Ostad, F. Atyabi and R. Dinarvand, Daru, J. Pharm. Sci., 2015, 23, 28–35 CrossRef PubMed.
- P. Lu, Y. Liu, M. Q. Guo, H. D. Fang and X. H. Xu, Mater. Sci. Eng., C, 2011, 31, 1285–1289 CrossRef CAS.
- J. T. Wu, J. Zhang, C. Deng, F. H. Meng and Z. Y. Zhong, Biomacromolecules, 2016, 17, 2367–2374 CrossRef CAS PubMed.
- R. N. Wang, X. C. Gu, J. P. Zhou, L. J. Shen, L. F. Yin, P. Y. Hua and Y. Ding, J. Controlled Release, 2016, 235, 134–146 CrossRef CAS PubMed.
- P. Liu, J. Q. Situ, W. S. Li, C. L. Shan, J. You, H. Yuan, F. Q. Hu and Y. Z. Du, J. Nanomed. Nanotechnol., 2015, 11, 855–866 CrossRef CAS PubMed.
- S. Narayanan, M. Pavithran, A. Viswanath, D. Narayanan, C. C. Mohan, K. Manzoor and D. Menon, Acta Biomater., 2014, 10, 2112–2124 CrossRef CAS PubMed.
- T. H. Yin, P. Wang, J. G. Li, Y. R. Wang, B. W. Zheng, R. Q. Zheng, D. Cheng and X. T. Shuai, Biomaterials, 2014, 35, 5932–5943 CrossRef CAS PubMed.
- P. Dhawan, A. Bell, A. Kumar, C. Golden and K. D. Mehta, J. Lipid Res., 1999, 40, 1911–1919 CAS.
- S. Varma, J. W. Breslin, B. K. Lal, P. J. Pappas, R. W. Hobson II and W. N. Durán, Microvasc. Res., 2002, 63, 172–178 CrossRef CAS PubMed.
- T. H. Yin, P. Wang, J. G. Li, Y. R. Wang, B. W. Zheng, R. Q. Zheng, D. Cheng and X. T. Shuai, Biomaterials, 2014, 35, 5932–5943 CrossRef CAS PubMed.
Footnote |
| † Electronic supplementary information (ESI) available. See DOI: 10.1039/c7ra12683b |
| This journal is © The Royal Society of Chemistry 2018 |

