 Open Access Article
Creative Commons Attribution 3.0 Unported Licence
A synthesis and performance evaluation of a highly efficient ecological dust depressor based on the sodium lignosulfonate–acrylic acid graft copolymer
Yanghao Liu a,
Wen Nie*ab,
Yubing Mua,
Haihan Zhanga,
Hongkun Wanga,
Hu Jina and
Zhiqiang Liu
 a
a
aCollege of Mining and Safety Engineering, Shandong University of Science and Technology, Qingdao 266590, Shandong Province, China. E-mail: niewen@sdust.edu.cn; liuyanghao2012@163.com
bState Key Laboratory of Mining Disaster Prevention and Control Co-found by Shandong Province and the Ministry of Science and Technology, Shandong University of Science and Technology, Qingdao 266590, China
First published on 22nd March 2018
Abstract
In this paper, a highly efficient and environmentally-friendly dust depressor was developed based on the sodium lignosulfonate–acrylic acid graft copolymer. Using the grafting ratio as an index, a three-factor and four-level orthogonal experiment was conducted to optimize the fabrication conditions of the graft copolymer. At a reaction temperature of 60 °C, feed ratio mSLS–AA of 1![[thin space (1/6-em)]](https://www.rsc.org/images/entities/char_2009.gif) :
:![[thin space (1/6-em)]](https://www.rsc.org/images/entities/char_2009.gif) 3, and FeSO4·7H2O content of 2.5%, the prototype produced the highest grafting ratio. The microstructure of the graft copolymer was measured using Fourier transform infrared spectrometry (FTIR) and nuclear magnetic resonance (1H-NMR). Furthermore, the influence of glycerol and the JFC penetrant on the contact angle between the compound solution and coal powder was investigated. Finally, four formulas of dust depressor were selected based on the experimental results. The dust-control performance of the four dust depressors was then tested on a large-scale spray dust suppression simulation platform. The results show that after applying formula 1 at various distances from the spray field, the average dust reduction rates of the total dust (respirable dust) at each point increased. Compared to the water-spraying dust suppression technique, the dust concentration is significantly reduced after the graft copolymer dust depressor is applied.
3, and FeSO4·7H2O content of 2.5%, the prototype produced the highest grafting ratio. The microstructure of the graft copolymer was measured using Fourier transform infrared spectrometry (FTIR) and nuclear magnetic resonance (1H-NMR). Furthermore, the influence of glycerol and the JFC penetrant on the contact angle between the compound solution and coal powder was investigated. Finally, four formulas of dust depressor were selected based on the experimental results. The dust-control performance of the four dust depressors was then tested on a large-scale spray dust suppression simulation platform. The results show that after applying formula 1 at various distances from the spray field, the average dust reduction rates of the total dust (respirable dust) at each point increased. Compared to the water-spraying dust suppression technique, the dust concentration is significantly reduced after the graft copolymer dust depressor is applied.
Introduction
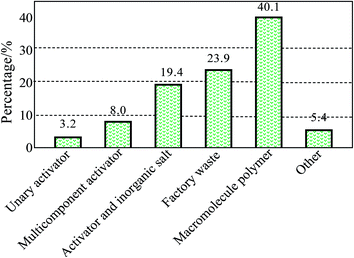
In recent years, there has been an ever-increasing environmental issue in industrial working areas, due to pollutants that consist mainly of inhalable particles (PM10) and fine particles (PM2.5). In the coal industry in particular, most of the respirable dust can enter directly into a human's lungs and form deposits there; furthermore they can gain access to the circulation system, causing severe hazards for the human body.1–3 Among the current dust suppression methods, spraying, using water as the liquid, has been applied extensively in underground coalmines. However, the coal dust's surface contains a large amount of the hydrophobic nonpolar group, leading to a strong hydrophobicity of the coal dust.4 Moreover, water's large surface tension leads to poor wettability with regard to the coal dust.5–7 Thus, most of the coal dust, particularly the respirable dust, does not become wet quickly and efficiently and is therefore not suppressed by water. Due to their small size, some of the dust particles deposited on the ground can also be dissipated easily by the wind, leading to secondary dust emissions. However, adding a dust depressor to water has proved to be an effective way of increasing the dust suppression rate by spraying. The development of a highly efficient dust depressor based on the dust's properties is therefore of great importance with regard to improving the dust control performance. To date, researchers worldwide have paid a great deal of attention to the development of a chemical dust depressor and there have been some notable achievements. For example, Kim J. et al.8 fabricated a dust depressor for wetting coal dust using a nonionic surfactant including surfynol 440, macol 30, plurafac RA 43, mindust 293, and neodol 92 as the main contents. Furthermore, Haining Wang et al.9 developed a dust binder from a starch grafted sodium polyacrylate. Cuifeng Du et al.10 synthesized a cohesive dust suppressant using a polymer film forming agent, polysaccharide polymer filler, and other auxiliaries. Miguel. A. Medeirosa et al.11 studied the dust suppressant fabricated from a glycerol polymerization and catalyzed by acids (sulfuric acid or phosphoric acid) and bases. Finally, Shuyan Cheng et al.12 created an environment-friendly dust depressor using byproducts from the production of biodiesel, such as glycerin.The main contents of the chemical dust depressors that emerged from the literature between 2001 and 2009 are shown in Fig. 1.13,14 As can be seen from this figure, the components of the chemical dust depressor have evolved from simple surfactants, along with their compounds and inorganic salts, to organic polymers. There is also an increasing tendency to use green, environmentally-friendly dust depressors. Therefore, combining the characteristics of organic polymers and environmentally-friendly dust depressors can promote their wider usage as a novel and highly efficient dust depressor.
As a byproduct from the papermaking industry, sodium lignosulfonate (LSL) benefits from its low cost, with an annual production of approximately 150![[thin space (1/6-em)]](https://www.rsc.org/images/entities/char_2009.gif) 000 tons in China.15,16 Lignin is a renewable resource with good water solubility and cohesion, nontoxicity, and biodegradability. The active groups in SLS molecules such as hydroxyl and the sulfonic group can bond with coal particles and form a solidified layer on the coal's surface. After forming a sodium lignosulfonate–acrylic acid graft copolymer (GCS–A) with acrylic acid (AA), the surface tension is significantly reduced. In addition, AA has the structure of CH2
000 tons in China.15,16 Lignin is a renewable resource with good water solubility and cohesion, nontoxicity, and biodegradability. The active groups in SLS molecules such as hydroxyl and the sulfonic group can bond with coal particles and form a solidified layer on the coal's surface. After forming a sodium lignosulfonate–acrylic acid graft copolymer (GCS–A) with acrylic acid (AA), the surface tension is significantly reduced. In addition, AA has the structure of CH2![[double bond, length as m-dash]](https://www.rsc.org/images/entities/char_e001.gif) CH–COOH, where the carboxylic acid with a double bond is introduced to GCS–A. The carboxylic acid in a GCS–A molecule provides a crosslinking point for the reaction. Moreover, the crosslinking structure formed from the reaction between carboxyl and hydroxyl in the molecule chain or SLS can greatly enhance the viscosity of the copolymer.17–19 Therefore, the inclusion of SLS in a chemical dust depressor has a number of advantages.
CH–COOH, where the carboxylic acid with a double bond is introduced to GCS–A. The carboxylic acid in a GCS–A molecule provides a crosslinking point for the reaction. Moreover, the crosslinking structure formed from the reaction between carboxyl and hydroxyl in the molecule chain or SLS can greatly enhance the viscosity of the copolymer.17–19 Therefore, the inclusion of SLS in a chemical dust depressor has a number of advantages.
The graft copolymer of SLS and AA consists of two polymerization processes: the polymerization of AA grafting to SLS and the self-polymerization of AA.20,21 The self-polymerization of AA is a simple process, and the reaction equation is shown in eqn (1):
 | (1) |
The graft polymerization of AA and SLS can take place at C-5 or in phenolic groups. As shown in eqn (2), SLS has a dynamic equilibrium. The graft polymerization of SLS and AA can occur in the following two pathways: (1) AA grafting to SLS following a one-by-one sequence, as shown in eqn (3); and (2) AA grafting to SLS after its self-polymerization, as shown in eqn (4).
 | (2) |
| LS˙ + M → LS − M˙ + (n − 1)M → LS − Mn | (3) |
| nM → Mn˙ + LS → LS − Mn | (4) |
Glycerin is a nontoxic, noncorrosive, and nonflammable liquid with a good moisture absorption capability, which satisfies the requirements of an ideal green solvent. The utilization of glycerin has recently become a focus of environmentally-focused chemistry. Previously, most of the studies in this area concentrated on the conversion of glycerin, while little has been explored with regard to utilizing it in new ways.22 It has been reported that glycerin can act as an auxiliary to increase the crosslinking degree among the large molecule chains of the graft copolymer, and expand the three-dimensional water-absorption space by forming a network structure.23,24 Therefore, in this paper, based on GSS–A, a new type of highly efficient and environmentally-friendly dust depressor is synthesized using glycerin as a wetting agent and the JFC penetrant as excipients.
Experimental methods
Raw materials and equipment
Sodium lignosulfonate (SLS, industrial grade), acrylic acid (AA, analytical purity), FeSO4·7H2O, acetone, glycerin, JFC penetrant, distilled water, magnetic stirrer with constant temperature and heater (85-1), water recycling vacuum pump (8HZ-D(III)), vacuum drying oven (DHG-9030), automatic tensionmeter (JK99C), nuclear magnetic resonance spectrometer (Bruker, AVANCE III 400, Swiss), FTIR spectrometer (Nicolet 6700), spin viscometer (NDJ-79).A synthesis of the graft copolymer
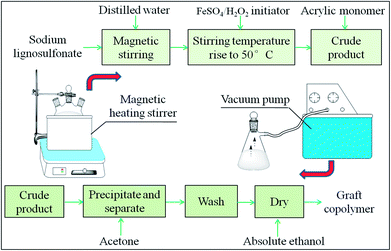
The SLS solution and distilled water of a certain ratio were added to a three-neck flask (250 mL). After stirring for 10 min with a magnetic stirrer to activate the reactant, an initiator and AA were added to the solution. The reaction temperature was maintained at 50 to 80 °C, and the raw copolymer was obtained after 3 hours. The reaction process of the copolymer is shown in Fig. 2. After separation and purification, the product was weighed, and the GCS–A yield was calculated following the process in ref. 25. The calculation equation is as follows:26
 | (5) |
The design of the individual experiment
Six types of coal sample were selected based on the coalification degree: lignite coal (HM, Shenum, Shanxi, China), long flame coal (CY, Hebi, Henan, China), 1/3 coking coal (1/3JM, Huipodi, Shanxi, China), fat coal (FM, Jiangzhuang, Shandong, China), lean coal (PSM, Shiquan, Shanxi, China), and anthracite coal (WY, Tongzi, Guizhou, China). Each coal sample was collected according to the published national standard (GB/T482-2008) to ensure its representativeness.28 After being grinded to a coal powder by a vibration-grinding machine, the samples were put through a 200 mesh standard sieve, labeled, and stored at a low temperature.
The water retention test evaluates mainly the water-holding capacity of the solution, based on the variation trend of the water loss rate with time. The water loss rate can be calculated as follows:
 | (6) |
20 mg of each coal sample was placed in a 60 mm Petri dish, and 10 mL of glycerin at different mass concentrations was sprayed uniformly onto the dust sample. As a control experiment, water was also sprayed onto separate samples. Next, the samples were placed in a drying oven at 70 °C, with the Petri dish's mass measured hourly for 7 hours. The water loss rate was then calculated.
An optical droplet morphology analyzer (DSA100) was adopted to measure the dynamic contact angle between different solutions and the fat coal from Jiangzhuang. The contact angle between the coal and solution at 30 s was measured, and the experiment was repeated four times to obtain the average value for each solution.
The chemical structure of the dust depressor
![[thin space (1/6-em)]](https://www.rsc.org/images/entities/char_2009.gif) :
:![[thin space (1/6-em)]](https://www.rsc.org/images/entities/char_2009.gif) 150. The FTIR spectrum of the mixed powder was then measured in the range of 4000 to 400 cm−1 with five scan times.29,30
150. The FTIR spectrum of the mixed powder was then measured in the range of 4000 to 400 cm−1 with five scan times.29,30Results and discussion
The optimization of the graft copolymerization
In order to determine the optimum reaction conditions, based on the effect of various factors, the mass fraction and reaction time in this experiment were set as constant, and a three-factor and four-level orthogonal experiment was conducted to obtain the optimal experimental conditions. Here A denotes the reaction temperature (°C), B denotes the mass fraction of acrylic acid and sodium lignosulfonate, and C denotes the mass fraction (%) of FeSO4·7H2O. The experimental variable is the yield of the graft copolymer G, and the optimized condition has the largest G. The levels of the various factors in the orthogonal experiment are shown in Table 1, and the results are shown in Table 2.| Level | Factor | ||
|---|---|---|---|
| A (°C) | B | C (%) | |
| 1 | 50 | 1![[thin space (1/6-em)]](https://www.rsc.org/images/entities/char_2009.gif) : :![[thin space (1/6-em)]](https://www.rsc.org/images/entities/char_2009.gif) 2 2 |
2.5 |
| 2 | 60 | 1![[thin space (1/6-em)]](https://www.rsc.org/images/entities/char_2009.gif) : :![[thin space (1/6-em)]](https://www.rsc.org/images/entities/char_2009.gif) 3 3 |
3 |
| 3 | 70 | 1![[thin space (1/6-em)]](https://www.rsc.org/images/entities/char_2009.gif) : :![[thin space (1/6-em)]](https://www.rsc.org/images/entities/char_2009.gif) 3.5 3.5 |
3.5 |
| 4 | 80 | 1![[thin space (1/6-em)]](https://www.rsc.org/images/entities/char_2009.gif) : :![[thin space (1/6-em)]](https://www.rsc.org/images/entities/char_2009.gif) 4 4 |
4 |
| No. | A (°C) | B | C (%) | G (%) |
|---|---|---|---|---|
| 1 | 50 | 1![[thin space (1/6-em)]](https://www.rsc.org/images/entities/char_2009.gif) : :![[thin space (1/6-em)]](https://www.rsc.org/images/entities/char_2009.gif) 2 2 |
2.5 | 69.6 |
| 2 | 50 | 1![[thin space (1/6-em)]](https://www.rsc.org/images/entities/char_2009.gif) : :![[thin space (1/6-em)]](https://www.rsc.org/images/entities/char_2009.gif) 3 3 |
3 | 68.4 |
| 3 | 50 | 1![[thin space (1/6-em)]](https://www.rsc.org/images/entities/char_2009.gif) : :![[thin space (1/6-em)]](https://www.rsc.org/images/entities/char_2009.gif) 3.5 3.5 |
3.5 | 58.1 |
| 4 | 50 | 1![[thin space (1/6-em)]](https://www.rsc.org/images/entities/char_2009.gif) : :![[thin space (1/6-em)]](https://www.rsc.org/images/entities/char_2009.gif) 4 4 |
4 | 62.9 |
| 5 | 60 | 1![[thin space (1/6-em)]](https://www.rsc.org/images/entities/char_2009.gif) : :![[thin space (1/6-em)]](https://www.rsc.org/images/entities/char_2009.gif) 2 2 |
3 | 55.7 |
| 6 | 60 | 1![[thin space (1/6-em)]](https://www.rsc.org/images/entities/char_2009.gif) : :![[thin space (1/6-em)]](https://www.rsc.org/images/entities/char_2009.gif) 3 3 |
2.5 | 66.2 |
| 7 | 60 | 1![[thin space (1/6-em)]](https://www.rsc.org/images/entities/char_2009.gif) : :![[thin space (1/6-em)]](https://www.rsc.org/images/entities/char_2009.gif) 3.5 3.5 |
4 | 71.7 |
| 8 | 60 | 1![[thin space (1/6-em)]](https://www.rsc.org/images/entities/char_2009.gif) : :![[thin space (1/6-em)]](https://www.rsc.org/images/entities/char_2009.gif) 4 4 |
3.5 | 78.3 |
| 9 | 70 | 1![[thin space (1/6-em)]](https://www.rsc.org/images/entities/char_2009.gif) : :![[thin space (1/6-em)]](https://www.rsc.org/images/entities/char_2009.gif) 2 2 |
3.5 | 42.3 |
| 10 | 70 | 1![[thin space (1/6-em)]](https://www.rsc.org/images/entities/char_2009.gif) : :![[thin space (1/6-em)]](https://www.rsc.org/images/entities/char_2009.gif) 3 3 |
4 | 58.2 |
| 11 | 70 | 1![[thin space (1/6-em)]](https://www.rsc.org/images/entities/char_2009.gif) : :![[thin space (1/6-em)]](https://www.rsc.org/images/entities/char_2009.gif) 3.5 3.5 |
2.5 | 74.1 |
| 12 | 70 | 1![[thin space (1/6-em)]](https://www.rsc.org/images/entities/char_2009.gif) : :![[thin space (1/6-em)]](https://www.rsc.org/images/entities/char_2009.gif) 4 4 |
3 | 45.3 |
| 13 | 80 | 1![[thin space (1/6-em)]](https://www.rsc.org/images/entities/char_2009.gif) : :![[thin space (1/6-em)]](https://www.rsc.org/images/entities/char_2009.gif) 2 2 |
4 | 54.6 |
| 14 | 80 | 1![[thin space (1/6-em)]](https://www.rsc.org/images/entities/char_2009.gif) : :![[thin space (1/6-em)]](https://www.rsc.org/images/entities/char_2009.gif) 3 3 |
3.5 | 52.9 |
| 15 | 80 | 1![[thin space (1/6-em)]](https://www.rsc.org/images/entities/char_2009.gif) : :![[thin space (1/6-em)]](https://www.rsc.org/images/entities/char_2009.gif) 3.5 3.5 |
3 | 76.8 |
| 16 | 80 | 1![[thin space (1/6-em)]](https://www.rsc.org/images/entities/char_2009.gif) : :![[thin space (1/6-em)]](https://www.rsc.org/images/entities/char_2009.gif) 4 4 |
2.5 | 67.5 |
| K1 | 64.75 | 55.55 | 69.35 | |
| K2 | 67.98 | 71.38 | 61.55 | |
| K3 | 54.98 | 70.18 | 57.9 | A2B2C1 |
| K4 | 62.95 | 63.5 | 61.85 | |
| R | 13 | 15.83 | 11.45 |
According to Table 2, the max–min difference analysis of the orthogonal experiment results shows that the main factor affecting the yield of the graft copolymer is the level of AA. A low AA level leads to its low concentration near the SLS molecules, and part of the SLS free radicals lose activity before the grafting reaction, resulting in a decreased yield. However, if the AA level is overly high, an AA self-polymerization reaction can occur, reducing the yield of the graft polymerization reaction between AA and SLS. As shown in Table 2, A2, B2, and C1 correspond to the highest graft yield. Thus, the optimized combination from the orthogonal experiment is A2B2C1. The effect of the three factors on the copolymer yield ranks as: C > A > B.
The IR analysis of the graft copolymer
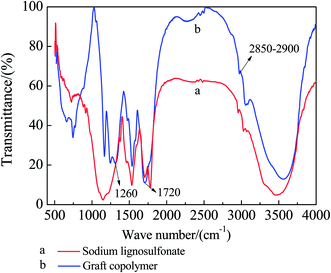
Fig. 5 show the FTIR spectra of the SLS before and after the graft reaction. The comparison between the two figures shows that the grafted GCS–A exhibits apparent hydroxyl absorption peak at 1720 cm−1, and the C–O stretching vibration peak at 1260 cm−1 is significantly enhanced, due to the carboxyl introduced to SLS after grafting AA. All the other features of the two spectra show no apparent difference, indicating that AA is grafted to SLS and forms graft copolymer.An analysis of 1H-NMR spectrum
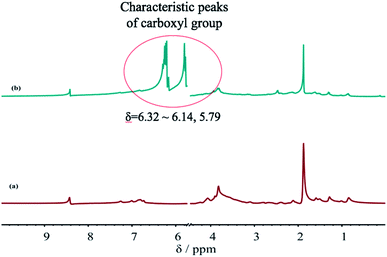
Fig. 6 shows the 1H-NMR spectra of the SLS before and after grafting with AA. A comparison between Fig. 6(a) and (b) shows a carboxyl (carbonyl) characteristic peak near δ = 6.32–6.14, 5.79 after the grafting reaction of SLS and AA, indicating that GCS–A is successfully synthesized. Moreover, the results are consistent with the FTIR analysis. Meanwhile, the integral areas of hydrogen-related peaks in the 1H-NMR spectra suggest that the carboxyl (carbonyl) amount in the graft copolymer is significantly higher after the grafting reaction. This is because the double bond carboxylic acid in AA is introduced to the copolymer as a monomer, providing carboxyl for the copolymer molecule and crosslink points for the reaction. The carboxyl can react with the hydroxyl in the molecule chain or SLS, increasing the viscosity of the copolymer. Thus, GCS–A can bond easily to a coal particle and enhance the capture rate of coal dust particles by the dust depressor.The surface tension and viscosity analysis
The wetting of the dust particles can be enhanced by modifying the surface tension between the liquid and solid–liquid. Meanwhile, the appropriate viscosity of the solution can increase its cohesive force on the coal powders. Thus, both the surface tension and viscosity are of great importance. In this paper, GCS–A solutions with various mass fractions were prepared, and the viscosity and surface tension were measured under the same conditions. Having analyzed the experimental results, the viscosity and surface tension of the copolymer solution as a function of the mass fraction are shown in Fig. 7.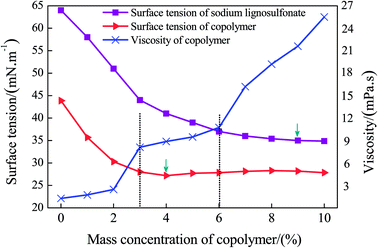 | ||
| Fig. 7 The viscosity and surface tension of the copolymer solution as a function of the mass fraction. | ||
According to Fig. 7, at a room temperature of 25 °C and with an increase of the solution mass fraction, the surface tension of SLS and GCS–A demonstrate a sharp initial decrease, followed by a mild decrease until a constant value is achieved. Before the grafting reaction, the surface tension of the SLS reaches a minimum value of 38.5 ± 0.5 mN m−1 with a mass fraction of 8–9%. After the grafting reaction, the surface tension of the GCS–A reaches a minimum value of 26.7 ± 0.5 mN m−1 with a mass fraction of 3–4%. Thus, the surface tension of the SLS solution is greatly reduced after grafting with AA to form GCS–A. Meanwhile, the variation trend of the viscosity as a function of various mass fractions indicates that the viscosity increases significantly with the increase of the mass fraction. Nevertheless, a high viscosity may cause difficulties in the spraying process. Thus, further considerations should be taken into account to determine the best mass concentration range. The variation trend of the surface tension and viscosity of the GCS–A solution suggest that both the surface tension and viscosity are within a relatively good region, as the mass fraction of the solution is 3–6%. Therefore, the preliminarily optimized mass fraction of the main material GCS–A should be 3–6%.
The influence of glycerin on the water retention of coal powders
The glycerin additive can affect the water retention of coal powders. In order to determine the proper mass fraction for glycerin, six coal samples were selected based on their coalification degrees, and the water retention performance was measured with a glycerin mass fraction of 0.2%, 0.6%, 1.0%, and 1.5%. The results are shown in Fig. 8(a)–(e).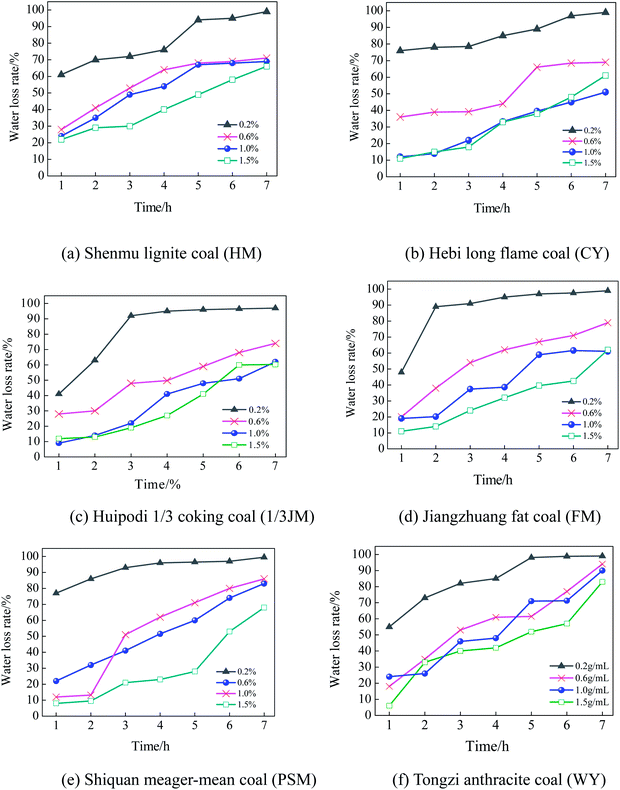 | ||
| Fig. 8 The influence of the glycerin concentration on the water retention performance of coal powders. | ||
As shown in Fig. 8(a)–(e), glycerin has an apparent effect on the water retention performance of the coal powders. As the mass fraction of glycerin increases, the water retention is significantly enhanced. Nevertheless, as the mass fraction increases from 1.0% to 1.5%, the water retention ceases to further improve. As an auxiliary for a dust depressor, glycerin has a good moisture absorbance and water retention. However, an overdose of glycerin can limit the stretching of the molecule chain, reducing the ability to store water. In addition, as the coalification degree increases, the effect of glycerin on the water retention performance is reduced. As shown in Fig. 8(a) (HM sample) and 8(b) (CY sample), as the mass fraction of the spraying glycerin reaches 0.6–1.5%, the maximum water loss rate is below 70%. In Fig. 8(f) (WY sample), the water loss rate at 7 hours is above 90%. This is because as the coalification degree increases, the wetting becomes poor, leading to decreased water retention.
Overall, taking into account both water retention performance and ecological factors, the preliminary mass fraction of glycerin should be between 0.6% and 1.0%.
An analysis of the penetration performance
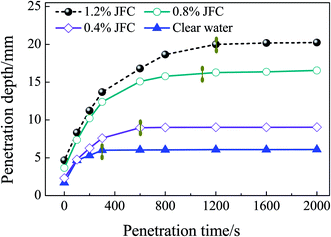
Fig. 9 reflects the penetration depth as a function of time in the penetration test. According to Fig. 9, compared to the JFC penetrant, the penetration depth of pure water is significantly smaller. After a penetration time of 1200, 1100, and 600 s, JFC solutions with a mass fraction of 0.4%, 0.8% and 1.0% become stable. The penetration depth of pure water becomes stable at 300 s. Finally at 2000 s, the penetration depth of JFC solutions with a mass fraction of 0.4%, 0.8% and 1.0% is 3.32, 2.24, and 1.22 times the depth for pure water. Thus, the JFC possesses an apparent enhanced penetration performance. Moreover, the JFC solution with a mass fraction of 1.8% shows little difference when compared to the 1.0% solution. Therefore, taking into account ecological factors, the preliminary mass fraction of the penetrant should be 0.4% to 0.8%.An analysis of the orthogonal experimental results
In order to select the optimum formula for a dust depressor, an orthogonal experiment was designed, as shown in Table 3. A max–min difference analysis of the contact angle was conducted, and the results are shown in Table 4.| Factor | A | B | C |
|---|---|---|---|
| 1 | 3% | 0.6% | 0.4% |
| 2 | 4% | 0.8% | 0.5% |
| 3 | 5% | 0.9% | 0.6% |
| 4 | 6% | 1.0% | 0.8% |
| No. | A% | B% | C% | Contact angle/° |
|---|---|---|---|---|
| 1 | 3 | 0.6 | 0.4 | 33.1 |
| 2 | 3 | 0.8 | 0.5 | 28.2 |
| 3 | 3 | 0.9 | 0.6 | 26.1 |
| 4 | 3 | 1 | 0.8 | 23.8 |
| 5 | 4 | 0.6 | 0.5 | 28.7 |
| 6 | 4 | 0.8 | 0.4 | 26.4 |
| 7 | 4 | 0.9 | 0.8 | 24.2 |
| 8 | 4 | 1 | 0.6 | 20 |
| 9 | 5 | 0.6 | 0.6 | 26.8 |
| 10 | 5 | 0.8 | 0.8 | 24.7 |
| 11 | 5 | 0.9 | 0.4 | 22.6 |
| 12 | 5 | 1 | 0.5 | 33.5 |
| 13 | 6 | 0.6 | 0.8 | 24.5 |
| 14 | 6 | 0.8 | 0.6 | 22.9 |
| 15 | 6 | 0.9 | 0.5 | 21.5 |
| 16 | 6 | 1 | 0.4 | 28.2 |
| K1 | 27.8 | 28.28 | 27.58 | |
| K2 | 24.83 | 25.55 | 27.98 | |
| K3 | 26.9 | 23.6 | 23.95 | BCA |
| K4 | 24.28 | 26.38 | 24.3 | |
| R | 3.52 | 4.68 | 4.03 |
K1, K2, K3, and K4 reflect the influence of various factors on the experimental index. A smaller contact angle between the dust depressor and coal powder is generally preferred. According to the results in Tables 3 and 4, A4, A2, B3, C3, and C4 are the optimum levels for each factor. A comparison of R values gives the following: RB > RC > RA. Thus, the influence of the factors on the contact angle ranks as B > C > A.
Overall, the optimum combinations of the three factors are A4B3C3, A4B3C4, A2B3C3, and A2B3C4. The four formulas of dust depressor determined by the orthogonal experiment are shown in Table 5.
| Formula | Component |
|---|---|
| 1 | 6% A + 0.9% B + 0.6% C |
| 2 | 6% A + 0.9% B + 0.8% C |
| 3 | 4% A + 0.9% B + 0.6% C |
| 4 | 4% A + 0.9% B + 0.8% C |
An analysis of the dust reduction rate
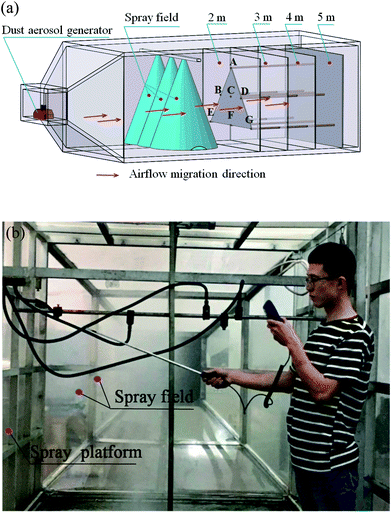
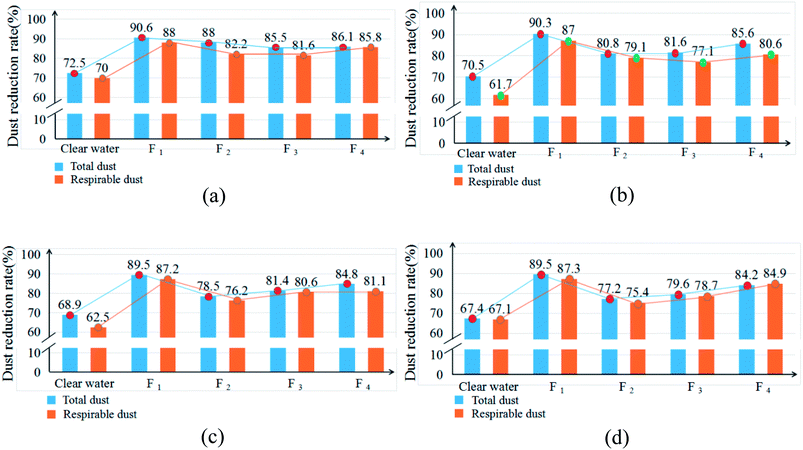
The dust control performance of the four dust depressors selected by the orthogonal experiment were tested in a large-scale mine spraying test box in the key state laboratories at Shandong University of Science and Technology. At a spraying pressure of 8 MPa, the mass concentrations of the total dust and respirable dust were measured for each formula. Four different cross sections located at 2, 3, 4, and 5 m from the spray field were selected with 7 measurement points at each cross section. The average mass concentrations of the total dust and respirable dust were measured at each point. The results are shown in Table 6. Using the data in Table 6, the average dust reduction rates of the total dust and respirable dust for each formula were calculated, and the results are summarized in a line chart (Fig. 10).| Distance to spray field/m | No dust reduction method | Clear water | Formula 1 | Formula 2 | Formula 3 | Formula 4 | ||||||
|---|---|---|---|---|---|---|---|---|---|---|---|---|
| T | R | T | R | T | R | T | R | T | R | T | R | |
| 2 | 812.6 | 426.1 | 266.7 | 127 | 76.4 | 51.1 | 97.5 | 75.8 | 117.8 | 78.4 | 113 | 60.5 |
| 3 | 729.5 | 364.2 | 215.2 | 139.5 | 70.5 | 47.2 | 140.1 | 76.1 | 134.2 | 83.4 | 106.5 | 70.7 |
| 4 | 642.4 | 291.6 | 199.8 | 109.4 | 67.5 | 37.3 | 138.1 | 69.4 | 122.5 | 56.6 | 97.6 | 55.1 |
| 5 | 541.6 | 233.1 | 176.6 | 76.7 | 59.4 | 29.5 | 123.5 | 57.3 | 110.5 | 49.7 | 85.6 | 35.2 |
 | ||
| Fig. 10 The average dust reduction rate of the total dust and respirable dust at the cross sections at different distances from the spray field. | ||
According to Table 6 and Fig. 10, compared to water spraying dust suppression techniques, the dust reduction rates of the four chemical dust depressors in this paper are significantly higher. After using the spraying dust depressor of formula 1, the average mass concentrations of the total dust and respirable dust at 2, 3, 4, and 5 m from the spray field decrease from 812.6 and 426.1 to 76.4 and 51.1, respectively. The average dust reduction rates of the total dust and respirable dust at each point increase from 72.5% and 70% to 90.6% and 88%, respectively. Thus, the dust reduction performance of formula 1 is apparently higher than the other three formulas. Therefore, the highly efficient dust depressor in this paper reduces the dust mass concentration in the test box significantly, thereby improving the environmental quality.
Analysis of SEM results
In order to investigate the effect of the new dust suppressant on the agglomeration and hardening of the coal powder, the present study uses high-resolution SEM to examine and compare the surface morphology of the dry coal powder without the spray of dust suppressant as well as the coal powder applied with the newly developed hybrid dust suppressant. The SEM images are shown in Fig. 11. Specifically, Fig. 11(a) depicts the surface morphology of the desiccated coal powder under 10![[thin space (1/6-em)]](https://www.rsc.org/images/entities/char_2009.gif) 000× SEM without the application of dust suppressant. It can be found that the spacing between coal dust particles is relatively large, and no agglomeration pattern is observed. This is mainly due to the fact that the surface of the coal dust contains large amount of hydrophobic groups, and there lacks cementing effect between particles. Therefore, the distribution of particles is scattered, and consequently the coal dust has a strong tendency to undergo dispersion driven by wind, leading to severe pollution. Fig. 11(b) shows the 10
000× SEM without the application of dust suppressant. It can be found that the spacing between coal dust particles is relatively large, and no agglomeration pattern is observed. This is mainly due to the fact that the surface of the coal dust contains large amount of hydrophobic groups, and there lacks cementing effect between particles. Therefore, the distribution of particles is scattered, and consequently the coal dust has a strong tendency to undergo dispersion driven by wind, leading to severe pollution. Fig. 11(b) shows the 10![[thin space (1/6-em)]](https://www.rsc.org/images/entities/char_2009.gif) 000× SEM image of the coal power undergoing the treatment of the new hybrid dust suppressant followed by desiccation. It is evident that the surface of coal powder is relatively smooth, and the coal dust particles are tightly connected with small spacing. This is due to the fact that the dust suppressant coats the coal dust surface with a hardened film. The film gives rise to a decent cementing effect between dust particles, rendering the coal dust particles a strong tendency to experience agglomeration. The reentrainment of coal dust is thereby suppressed.
000× SEM image of the coal power undergoing the treatment of the new hybrid dust suppressant followed by desiccation. It is evident that the surface of coal powder is relatively smooth, and the coal dust particles are tightly connected with small spacing. This is due to the fact that the dust suppressant coats the coal dust surface with a hardened film. The film gives rise to a decent cementing effect between dust particles, rendering the coal dust particles a strong tendency to experience agglomeration. The reentrainment of coal dust is thereby suppressed.
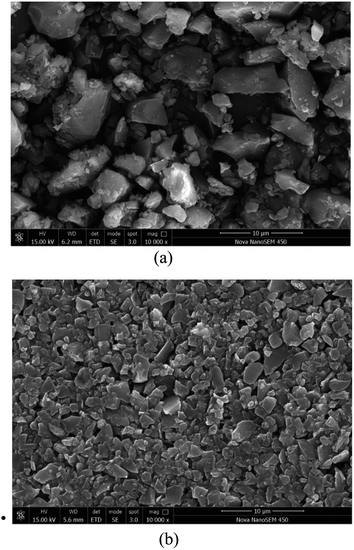 | ||
Fig. 11 SEM photo of coal powder solidifying effect: (a) dry coal dust under 10![[thin space (1/6-em)]](https://www.rsc.org/images/entities/char_2009.gif) 000× SEM; (b) coal dust after spraying dust suppressant under 10 000× SEM; (b) coal dust after spraying dust suppressant under 10![[thin space (1/6-em)]](https://www.rsc.org/images/entities/char_2009.gif) 000× SEM. 000× SEM. | ||
An analysis of coal quality
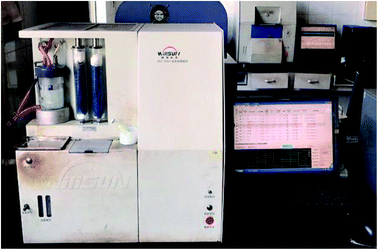
According to the general regulation of People's Republic of China national standard coal analysis and test method, the coal dust samples before and after spraying the dust suppressant were analyzed. Four representative coal samples from different regions were selected for determination depending on the degree of coalification. They are long flame coal (CY) from Shanxi Daliuta coal mine, 1/3 coking coal (1/3 JM) from Shanxi Huipodi coal mine, gas-fat coal (FM) from Shandong Jiangzhuang coal mine and anthracite coal (WY) from Guizhou Tongzi coal mine. Table 7 is the analysis results of coal dust before and after spray dust suppressant developed in this paper.| Coal sample | WB% | Calorific value | |||||
|---|---|---|---|---|---|---|---|
| Total moisture | Analytical water | Ash content | Volatile matter | Total sulfur | |||
| Mt | Mad | Ad | Vd | St,d | Qgr,d (MJ kg−1) | ||
| a 1# and 2# respectively represent the samples of raw coal and the coal simple after spraying dust suppressant. | |||||||
| CY | 1# | 19.41 | 5.56 | 6.22 | 33.25 | 0.48 | 25.84 |
| 2# | 20.79 | 3.45 | 6.31 | 33.74 | 0.476 | 25.68 | |
| 1/3JM | 1# | 16.5 | 1.85 | 2.8 | 60.2 | 0.52 | 34.01 |
| 2# | 19.21 | 1.77 | 2.77 | 59.68 | 0.49 | 32.99 | |
| FM | 1# | 17.22 | 1.55 | 5.6 | 30.56 | 0.39 | 35.62 |
| 2# | 19.56 | 1.53 | 5.64 | 30.47 | 0.38 | 34.87 | |
| WY | 1# | 14.32 | 2.69 | 7.21 | 9.64 | 0.35 | 40.01 |
| 2# | 17.3 | 2.7 | 7.18 | 9.39 | 0.33 | 39.55 | |
The comparison data in Table 7 indicate that after spraying the dust suppressant, the total moisture content of the coal sample increases, this is because the dust suppressant is an aqueous solution, which brings the total moisture content of the surface coal after spraying the dust suppressant; similarly, the coal total moisture also increased coal calorific value slightly causes. The reduced calorific value is all less than 0.1%, the effects are almost negligible. In addition, the whole water section of the coal surface will gradually evaporate during transportation, the resulting increase in moisture is also eliminated. Futhermore, spraying dust suppressant has no influence on ash content, volatile content and total sulfur content of coal. Therefore, the new hybrid dust suppressant developed in this paper will not affect the quality of coal.
Conclusions
In this paper, a sodium lignosulfonate–acrylic acid graft copolymer was synthesized using low-cost polymer sodium lignosulfonate. The optimized reaction condition determined by the orthogonal experiment was as follows: a reaction temperature of 60 °C, feed ratio mSLS–AA of 1![[thin space (1/6-em)]](https://www.rsc.org/images/entities/char_2009.gif) :
:![[thin space (1/6-em)]](https://www.rsc.org/images/entities/char_2009.gif) 3, and FeSO4·7H2O content of 2.5%. The FTIR spectrum confirms the introduction of AA into SLS, the 1H-NMR spectrum shows that the variation of the group peak position for the graft copolymer is consistent with the FTIR results. Meanwhile, the carboxyl group on the copolymer has a crosslinking structure with the molecular chain or the hydroxyl group on SLS, which can increase the viscosity of the polymer. Four kinds of dust reducing agents were selected through water conservation experiment and permeability test, finally, the optimum formula was determined by the spray dust reduction experiment. From an analysis of the experimental results, the new dust depressor developed in this paper has no effect on the quality of the coal. In summary, the novel, ecological, highly efficient dust depressor developed in this paper is environmentally-friendly and easily degradable, with a significantly enhanced dust reduction performance.
3, and FeSO4·7H2O content of 2.5%. The FTIR spectrum confirms the introduction of AA into SLS, the 1H-NMR spectrum shows that the variation of the group peak position for the graft copolymer is consistent with the FTIR results. Meanwhile, the carboxyl group on the copolymer has a crosslinking structure with the molecular chain or the hydroxyl group on SLS, which can increase the viscosity of the polymer. Four kinds of dust reducing agents were selected through water conservation experiment and permeability test, finally, the optimum formula was determined by the spray dust reduction experiment. From an analysis of the experimental results, the new dust depressor developed in this paper has no effect on the quality of the coal. In summary, the novel, ecological, highly efficient dust depressor developed in this paper is environmentally-friendly and easily degradable, with a significantly enhanced dust reduction performance.
Conflicts of interest
There are no conflicts to declare.Acknowledgements
This work has been funded by the China Postdoctoral Science Foundation (No. 2017T100503 and 2015M570601), the Focus on Research and Development Plan in Shandong Province (No. 2017GSF20111), the National Key R&D Program of China (No. 2017YFC0805201), and the National Natural Science Foundation of China (No. 51404147).Reference
- R. J. Blanka Binkova, M. Dostal, M. M. Dostalova, H. Libalova, A. Milcova, P. R. Hu Jin Jr, A. Rossnerova, J. Schmuczerova, V. Svecova, J. Topinka and H. Votavova, Health impact of air pollution to children, Int. J. Hyg. Environ. Health, 2013, 216, 533–540 CrossRef PubMed.
- W. Nie, Y. H. Liu, H. Wang, W. L. Wei, H. T. Peng, P. Cai, Y. Hua and H. Jin, The development and testing of a novel external-spraying injection deducting device for the heading machine in a fully-mechanized excavation face, Process Saf. Environ. Prot., 2017, 109, 716–731 CrossRef CAS.
- W. Nie, W. L. Wei, X. Ma, Y. H. Liu, H. T. Peng and Q. Liu, The effects of ventilation parameters on the migration behaviors of head-on dusts in the heading face, Tunnelling and Underground Space Technology, 2017, 70, 400–408 CrossRef.
- H. Wang, W. Nie, W. M. Cheng, Q. Liu and H. Jin, Effects of air volume ratio parameters on air curtain dust suppression in a rock tunnel's fully-mechanized working face, Adv. Powder Technol., 2018, 29, 230–244 CrossRef.
- W. Nie, X. Ma, W. M. Cheng, Y. H. Liu, L. Xin, H. T. Peng and W. L. Wei, A novel spraying/negative-pressure secondary dust suppression device used in fully mechanized mining face, Process Saf. Environ. Prot., 2016, 103, 126–135 CrossRef CAS.
- Q. Liu, W. Nie, Y. Hua, H. T. Peng and Z. Q. Liu, The effects of the installation position of a multi-radial swirling air-curtain generator on dust diffusion and pollution rules in a fully-mechanized excavation face: A case study, Powder Technol., 2018, 329, 371–385 CrossRef CAS.
- H. T. Wang, D. M. Wang, G. Chen and W. X. Ren, Preparation and application of the high-performance foam for suppressing dust, China Mining Magazine, 2012, 21(7), 114–116 Search PubMed.
- J. Kim, Effect of coal type on wetting by solutions of Nonionic surfactant, International Mining and Minerals, 1999, 2(14), 38–41 Search PubMed.
- H. M. Wang and C. Wu, Development of a dust suppression and high strength water absorption resin for pavement, J. Cent. South Univ. Technol., 1995, 26(3), 319–323 CAS.
- C. F. Du, Z. A. Jiang, Y. Xu, H. P. Lv and X. J. Yao, Industrial Test on Depression of Flying Dust at Open Coal Yard by Cohesive Dust Depressor, Metal Mine, 2005,(3), 55–57 Search PubMed.
- M. A. Medeiros, C. M. M. Leite and R. M. Lago, Use of glycerol by-product of biodiesel to produce an efficient dust suppressant, Chem. Eng. J., 2012, 180, 364–369 CrossRef CAS.
- S. Y. Cheng and Y. H. Hao, Synthesis of coal dust depressor by waste paper and its application, Chin. J. Environ. Eng., 2013, 7(9), 9 Search PubMed.
- C. Wu, Chemical Suppression of Dust, Central South University Press, Changsha, 2003. pp. 3–13 Search PubMed.
- Y. H. Liu, W. Nie, H. Jin, H. Ma, Y. Hua, P. Cai and W. L. Wei, Solidifying dust suppressant based on modified chitosan and experimental study on its dust suppression performance, Adsorpt. Sci. Technol., 2018, 36(1–2), 640–654 CrossRef CAS.
- C. Hao, J. J. Wang, Q. Cheng, Y. Bai, X. H. Wang and Y. L. Yang, Anionic surfactants-assisted solution-phase synthesis of ZnO with improved photocatalytic performance, J. Photochem. Photobiol., A, 2017, 332, 84–390 CrossRef.
- X. H. Wang, Y. Y. Wang, H. Q. Hou, J. J. Wang and C. Hao, Ultrasonic Method to Synthesize Glucan-g-poly(acrylic acid)/Sodium Lignosulfonate Hydrogels and Studies of Their Adsorption of Cu2+ from Aqueous Solution, ACS Sustainable Chem. Eng., 2017, 5, 6438–6446 CrossRef CAS.
- X. H. Wang, Z. L. Zhou, X. W. Guo, Q. He, C. Hao and C. W. Ge, Ultrasonic-assisted synthesis of sodium lignosulfonate–grafted poly (acrylic acid-co-poly (vinyl pyrrolidone)) hydrogel for drug delivery, RSC Adv., 2016, 6(42), 35550–35558 RSC.
- H. H. Xia, Y. X. Zhang, C. L. Chen, W. L. Wu, K. Yao and J. Zhang, Ozone-Mediated Functionalization of Multi-Walled Carbon Nanotubes and Their Activities for Oxygen Reduction Reaction, J. Mater. Sci. Technol., 2016, 32(6), 533–538 Search PubMed.
- C. Hao, Y. M. Xu, M. J. Bao, X. H. Wang, H. L. Zhang and T. H. Li, Hydrothermal synthesis of sphere-like BiOCl using sodium lignosulphonate as surfactant and its application in visible light photocatalytic degradation of rhodamine B, J. Mater. Sci.: Mater. Electron., 2017, 28, 3119–3127 CrossRef CAS.
- X. H. Wang, F. S. Wu, Y. W. Duan, Y. Y. Wang, C. Hao and C. W. Ge, Lignin-assisted solid-phase synthesis of nano-CuO for a photocatalyst with excellent catalytic activity and high performance supercapacitor electrodes, RSC Adv., 2016, 6, 65644 RSC.
- Y. Zheng, Preparation of new dust suppressant and its performance, J. Shanghai Inst. Technol., 2014, 14(2), 106–108 Search PubMed.
- H. Quan (Sophia), M. Josiah and Y. Jie, Utilization of the residual glycerol from biodiesel production for renewable energy generation, Renew. Sust. Energ. Rev., 2017, 71, 63–76 CrossRef.
- C. Hao, Y. R. Shen, Z. Y. Wang, X. H. Wang, F. Feng, C. W. Ge, Y. T. Zhao and K. Wang, Preparation and Characterization of Fe2O3 Nanoparticles by Solid-Phase Method and Its Hydrogen Peroxide Sensing Properties, ACS Sustainable Chem. Eng., 2016,(4), 1069–1077 CrossRef CAS.
- H. Zhao, Synthesis and properties research of a new sand fixing agent lignin sulfonate graft urea-formaldehyde resin, MPhil. thesis, Beijing University of Chemical Technology, Beijing, 2015 Search PubMed.
- Y. Chen, F. J. Wang, D. R. Ran, Y. W. Guo, Y. C. Ye, Y. X. Wang and H. M. Tan, Preparation of a C6 Quaternary Ammonium Chitosan Derivative Through a Chitosan Schiff Base with Click Chemistry, J. Appl. Polym. Sci., 2013, 129, 3185 CrossRef CAS.
- X. D. Zhao, Discussion on national standard of GB/T 482-2008. Sampling of coal seams, Coal Quality Technology, 2011,(02), 22–24 Search PubMed.
- X. Zhou, J. Z. Yang, Q. Gao and G. H. Qu, Study on heat hardening mechanism of starch composite binder for sand mold (core) by IR spectra, J. Mater. Sci. Technol., 2001, 17(S1), 143–146 Search PubMed.
- Y. Yuan, Preparation and life cycle assessment of environment-friendly wooden composites based on modified industrial lignins, PhD thesis, Northeast Forestry University, Heilongjiang, 2014, pp. 3–11 Search PubMed.
- W. M. Cheng, X. M. Hu, J. Xie and Y. Y. Zhao, An intelligent gel designed to control the spontaneous combustion of coal: Fire prevention and extinguishing properties, Fuel, 2017, 210, 826–835 CrossRef CAS.
- J. J. Liu, X. Q. Qiu and X. S. Tian, Numerical analysis of the flame structural characteristics of light oil burner of different environmental conditions, J. Shandong Univ. Sci. Technol., Nat. Sci., 2018, 37(2), 80–87 CrossRef.
| This journal is © The Royal Society of Chemistry 2018 |

