 Open Access Article
Creative Commons Attribution 3.0 Unported Licence
Cations substitution tuning phase stability in hybrid perovskite single crystals by strain relaxation
C. Wu ,
K. Chen,
D. Y. Guo
 ,
S. L. Wang* and
P. G. Li*
Department of Physics, Center for Optoelectronics Materials and Devices, Zhejiang Sci-Tech University, Hangzhou, 310018, China. E-mail: slwang@zstu.edu.cn; pgli@zstu.edu.cn
First published on 15th January 2018
Abstract
Methylammonium (MA) and formamidinium (FA) are two typical A site cations in lead halide perovskites. Instability of synthesised crystals will degrade the properties of the photoelectrical device constructed by such perovskites. MAPbI3 and FAPbI3 in cubic crystal structure have been demonstrated to be the most stable at room temperature. Herein we synthesised MA(EA)PbI3 and FA(MA)PbI3 single crystals using an inverse-temperature crystallization strategy by partially substituting the methylammonium (MA) with ethylammonium (EA) and the formamidinium (FA) with methylammonium (MA) respectively. The XRD results show that both crystal structures are cubic, which means organic incorporation can stabilize the crystal structure of lead halide perovskites. The lattice distortion decrease and strain relaxation in single crystals were considered to be the reason leading to higher stability. The single crystals of MA(EA)PbI3 and FA(MA)PbI3 with low trap state density exhibit excellent light-absorbing properties, indicating their potential applications in photoelectric devices.
Introduction
Organic-lead trihalide hybrid perovskites have been widely investigated for solar cells,1 photodetectors,2 lasing,3 light-emitting diodes,4 and hydrogen production,5 owing to their superior characteristics including direct bandgap, highly balanced hole and electron mobility, strong absorption coefficient and long carrier lifetime etc.6 As is well known, the perovskite structure of ABX3 (where A is an organic cation, B is a metal cation, and X is a halide anion) consists of a three-dimensional array of [BX6] octahedra with a cation occupying the 12-coordinated cubo-octahedral cavities of the 3D network. In the ABX3 perovskite structure, the size of precursor ions needs to follow one principal, which can be expressed as , where RA, RB and RX are the ionic radii of the corresponding ions. When the tolerance factor t of the perovskite is between 0.8 to 1, a stable three-dimensional (3D) crystal structure can be obtained. While maintaining a high-symmetry cubic structure, the value of t should be close to 1.7 Currently, the most-studied lead halide perovskites usually have formamidinium (FA) or methylammonium (MA) at the A site.
In fact, there are three types of MAPbI3 crystals, orthorhombic, tetragonal and cubic structures.8 Two phase transitions occur at 162.2 K and 327.4 K for orthorhombic–tetragonal and tetragonal–cubic transitions, respectively.9 The phase transition of MAPbI3 from cubic to tetragonal phases at 327.4 K may cause undesired lattice distortion and strain which is harmful to photoelectric devices.10 Compared with MAPbI3, FAPbI3 perovskite demonstrates better thermal stability and even better photoelectric property. However, FAPbI3 suffers from the well-known spontaneous phase transition from the desired cubic phase (α phase) black perovskite to δ-phase yellow non-perovskite at room temperature.11 This phase transition is the main obstacle for high efficiency and long-term stability of FAPbI3-based optelectric devices. Therefore, an urgent assignment is engineering and synthesizing of cubic MAPbI3 and FAPbI3 crystals which can stability exist at room temperature.
Zhu et al.12 reported the incorporation of cations with smaller effective radius can adjust the tolerance factor and relax the crystal strain of FA-based perovskites. Peng et al.13 studied the incorporation of cations with bigger effective radius to obtain cubic phase perovskite. M. T. Weller and O. J. Weber's research group have investigated the routes and kinetics of degradation of thin films of methylammonium (MA)/formamidinium (FA) lead iodide perovskites (FAxMA1−xPbI3).14 Meantime, they focused on growth of MA/FA system perovskite crystals and exploration of the phase transition mechanism.15 Herein, we synthesised cubic phase MA(EA)PbI3 and FA(MA)PbI3 single crystals by an inverse-temperature crystallization strategy, and investigated their thermodynamic and electronic property.
Experimental section
Materials
PbI2 (99.99%) was obtained from Macklin. MAI (>98%, 2-time purification), as well as EAI (>99%, 4-time purification) and FAI (>99%, 4-time purification) were acquired from Chengdu Technology Co. Ltd. The solvent γ-butyrolactone (GBL, 99%) was also obtained from Macklin. All materials were used as received.Growth of the mixed-perovskite crystals
Perovskite crystals were grown by a reported method of inverse temperature crystallization.16 Briefly, 1 M PbI2 and 1 M CH3NH3I (MAI) were dissolved in 2 ml γ-GBL at 40 °C, and stirred until the solution becomes clear. The solution was then kept at 90 °C for about 12 h to allow for pure MAPbI3 crystal growth. For the FA+ cation mixed with MAPbI3, 0.922 g PbI2, 0.159 g MAI, and 0.172 g HC(NH2)2I(FAI) were dissolved in 2 ml GBL solution under the same conditions outlined above, to facilitate mixed MAPbI3 crystal growth. This same method has been used for the incorporation of EA cations.Characterization of the mixed-perovskite crystals
X-ray diffraction (XRD) data from single crystals were collected by a Bruker D8-Advance, using Cu Kα radiation. Thermogravimetric analysis (TGA) was performed on a TGA analyzer (PYRTS 1). Differential scanning calorimetry (DSC) analysis was carried out by using Q2000 to test phase transition. Photoluminescence (PL) measurements of bulk crystals were performed with a Renishaw inVia Raman Microscope using a 532 nm laser as excitation source. The 1H Nuclear Magnetic Resonance (NMR) spectra were recorded in dimethyl sulfoxide (DMSO) using a Bruker Advance 300 spectrometer. UV-vis diffuse reflectance spectroscopy was measured using a UV-vis spectrophotometer (U-3900). V–I characteristics were tested using a Keithley 2400 instrument.Result and discussion
MA(EA)PbI3 precursors solutions were prepared using MAI and EAI with a molar ratio of 1![[thin space (1/6-em)]](https://www.rsc.org/images/entities/char_2009.gif) :
:![[thin space (1/6-em)]](https://www.rsc.org/images/entities/char_2009.gif) 3 while FA(MA)PbI3 precursors solutions were prepared using MAI and FAI with a molar ratio of 1
3 while FA(MA)PbI3 precursors solutions were prepared using MAI and FAI with a molar ratio of 1![[thin space (1/6-em)]](https://www.rsc.org/images/entities/char_2009.gif) :
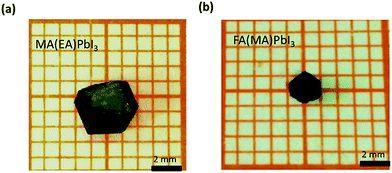
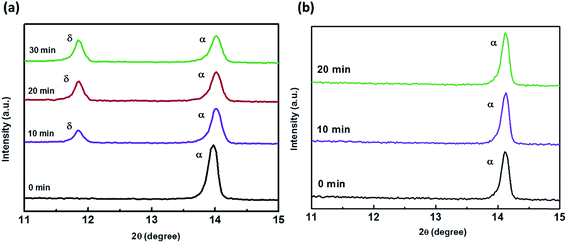
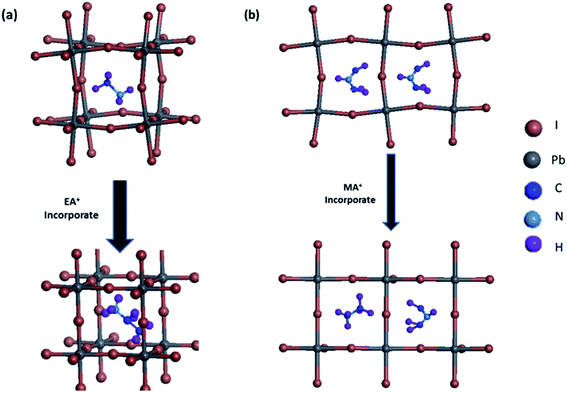
:![[thin space (1/6-em)]](https://www.rsc.org/images/entities/char_2009.gif) 1. After growing for about 12 h, the single crystal sizes of 4 mm × 3 mm × 1 mm and 2 mm × 2 mm × 1 mm are finally obtained for MA(EA)PbI3 and FA(MA)PbI3 respectively, as shown in Fig. 1. XRD patterns of the perovskite crystals are shown in Fig. 2. It shows that the main peaks for MA(EA)PbI3 is at 2θ = 14.1°, 28.3° and 31.7°. The diffraction pattern of the tetragonal MAPbI3 crystal is also shown in Fig. 2a for comparing. The reported calculated and experimental data of MAPbI3 show that the X-ray peaks (211) and (213) were used to differentiate tetragonal and cubic phase.17 No (211) reflection at 2θ = 23.5° was observed, which proves that MA(EA)PbI3 has a cubic structure. Previously report the sizes of the MA+ (2.03 Å) and EA+ (2.42 Å) were calculated.18 We speculate mixed of different size organic cations in perovskite caused lattice dilation, altered Pb–I–Pb bond angle and finally increased the crystal symmetry. When the A site is occupied by big size organic cation such as EA+, the lead halide perovskite will become a two-dimensional (2D) layer structure. This is due to the large ionic radius of EA+ resulting in a tolerance factor out of the empirical range for a stable 3D perovskite structure. We propose that MA(EA)PbI3 could show a stable 3D PbI6 octahedral framework owing to two lattice-distortion factors: (1) the small radius of MA+ causes lattice contraction; (2) the large radius of EA+ causes lattice dilation. This cell dilation adjusts the tolerance factor toward 1, favourable to stabilize the cubic perovskite. The diffraction pattern of FA(MA)PbI3 in a good agreement with the recently reported cubic phase FAPbI3 which were shown in Fig. 2b. Strain in the (111) plane of the cubic phase FAPbI3 is a driving force for its easy phase transition into the δ-phase, where the (111) plane acts as the nucleation site for the (0001) δ-phase.19 When small organic cation MA+ incorporated, the strain in (111) was relaxed. As shown in the inset of Fig. 2b, the diffraction peak positions shift to higher angles when MA+ cation incorporates, indicating the decrease of the lattice plane space. The FWHM for cubic phase FAPbI3 is 0.187° while for FA(MA)PbI3 is 0.177°. The sharpening of the peak indicates the relaxation of strain.20 Fig. 3 shows the time-dependent XRD measurements of FAPbI3 and FA(MA)PbI3 crystals. In the air at room temperature, FAPbI3 exhibits a phase transition while FA(MA)PbI3 does not. Spontaneous phase transition of FAPbI3 from cubic phase to non-perovskite phase was prevented when MA+ incorporated. The result is consistent with the reported literature.15 Schematic representation of the incorporation of organic cations was shown in Fig. 4. Cell parameters of MA(EA)PbI3 and FA(MA)PbI3 crystals were shown in Table 1.
1. After growing for about 12 h, the single crystal sizes of 4 mm × 3 mm × 1 mm and 2 mm × 2 mm × 1 mm are finally obtained for MA(EA)PbI3 and FA(MA)PbI3 respectively, as shown in Fig. 1. XRD patterns of the perovskite crystals are shown in Fig. 2. It shows that the main peaks for MA(EA)PbI3 is at 2θ = 14.1°, 28.3° and 31.7°. The diffraction pattern of the tetragonal MAPbI3 crystal is also shown in Fig. 2a for comparing. The reported calculated and experimental data of MAPbI3 show that the X-ray peaks (211) and (213) were used to differentiate tetragonal and cubic phase.17 No (211) reflection at 2θ = 23.5° was observed, which proves that MA(EA)PbI3 has a cubic structure. Previously report the sizes of the MA+ (2.03 Å) and EA+ (2.42 Å) were calculated.18 We speculate mixed of different size organic cations in perovskite caused lattice dilation, altered Pb–I–Pb bond angle and finally increased the crystal symmetry. When the A site is occupied by big size organic cation such as EA+, the lead halide perovskite will become a two-dimensional (2D) layer structure. This is due to the large ionic radius of EA+ resulting in a tolerance factor out of the empirical range for a stable 3D perovskite structure. We propose that MA(EA)PbI3 could show a stable 3D PbI6 octahedral framework owing to two lattice-distortion factors: (1) the small radius of MA+ causes lattice contraction; (2) the large radius of EA+ causes lattice dilation. This cell dilation adjusts the tolerance factor toward 1, favourable to stabilize the cubic perovskite. The diffraction pattern of FA(MA)PbI3 in a good agreement with the recently reported cubic phase FAPbI3 which were shown in Fig. 2b. Strain in the (111) plane of the cubic phase FAPbI3 is a driving force for its easy phase transition into the δ-phase, where the (111) plane acts as the nucleation site for the (0001) δ-phase.19 When small organic cation MA+ incorporated, the strain in (111) was relaxed. As shown in the inset of Fig. 2b, the diffraction peak positions shift to higher angles when MA+ cation incorporates, indicating the decrease of the lattice plane space. The FWHM for cubic phase FAPbI3 is 0.187° while for FA(MA)PbI3 is 0.177°. The sharpening of the peak indicates the relaxation of strain.20 Fig. 3 shows the time-dependent XRD measurements of FAPbI3 and FA(MA)PbI3 crystals. In the air at room temperature, FAPbI3 exhibits a phase transition while FA(MA)PbI3 does not. Spontaneous phase transition of FAPbI3 from cubic phase to non-perovskite phase was prevented when MA+ incorporated. The result is consistent with the reported literature.15 Schematic representation of the incorporation of organic cations was shown in Fig. 4. Cell parameters of MA(EA)PbI3 and FA(MA)PbI3 crystals were shown in Table 1.
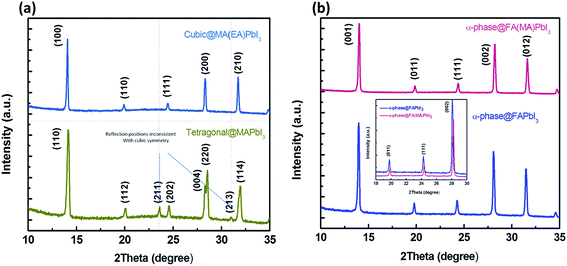 | ||
| Fig. 2 (a) Powder XRD patterns of the cubic MA(EA)PbI3 and the XRD of tetragonal crystal is also presented. (b) Powder XRD of α-FAPbI3 and α-FA(MA)PbI3. | ||
| Phase | Space-group | Cell-parameters | Cell volume | |
|---|---|---|---|---|
| MA(EA)PbI3 | Cubic | Pm![[3 with combining macron]](https://www.rsc.org/images/entities/char_0033_0304.gif) m m |
6.309 Å | 251.120 Å3 |
| FA(MA)PbI3 | Cubic | Pm![[3 with combining macron]](https://www.rsc.org/images/entities/char_0033_0304.gif) m m |
6.329 Å | 253.516 Å3 |
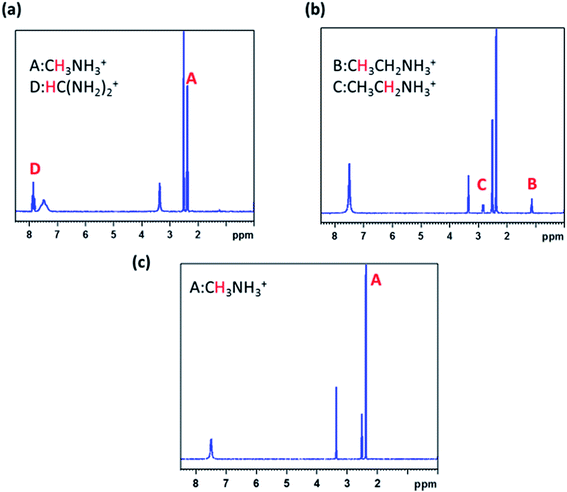
Unfortunately, the organic components show much lower diffraction intensity and intense rotating motion, we could not resolve their distributions.18 To further confirm the composition, we used solution-phase 1H NMR spectroscopy. The species corresponding to the 1H peaks are listed. Compared with tetragonal MAPbI3 sample, we can identify B, C 1H species in MA(EA)PbI3 and D 1H species in FA(MA)PbI3. It means that EA and MA had incorporated in MAPbI3 and FAPbI3, respectively. From 1H NMR spectroscopy of MA(EA)PbI3, integration of B and C peaks shows a B/C ratio of 1.00![[thin space (1/6-em)]](https://www.rsc.org/images/entities/char_2009.gif) :
:![[thin space (1/6-em)]](https://www.rsc.org/images/entities/char_2009.gif) 0.66 which is consistent with the proton population ratio –CH3/–CH2– in EA+. The B/A ratio is 1
0.66 which is consistent with the proton population ratio –CH3/–CH2– in EA+. The B/A ratio is 1![[thin space (1/6-em)]](https://www.rsc.org/images/entities/char_2009.gif) :
:![[thin space (1/6-em)]](https://www.rsc.org/images/entities/char_2009.gif) 6 which indicates an EA/MA ratio of 1
6 which indicates an EA/MA ratio of 1![[thin space (1/6-em)]](https://www.rsc.org/images/entities/char_2009.gif) :
:![[thin space (1/6-em)]](https://www.rsc.org/images/entities/char_2009.gif) 6. While from 1H NMR spectroscopy of FA(MA)PbI3, A/D ratio indicates a FA/MA ratio of 1
6. While from 1H NMR spectroscopy of FA(MA)PbI3, A/D ratio indicates a FA/MA ratio of 1![[thin space (1/6-em)]](https://www.rsc.org/images/entities/char_2009.gif) :
:![[thin space (1/6-em)]](https://www.rsc.org/images/entities/char_2009.gif) 1 (Fig. 5).
1 (Fig. 5).
To examine the thermal properties of perovskite MA(EA)PbI3 and FA(MA)PbI3 thermogravimetric analysis (TGA) was measured from room temperature to 500 °C under nitrogen flow. As shown in Fig. 6a, the decomposition temperature of MA(EA)PbI3 is about 255 °C, which is slightly higher than that of MAPbI3 single crystal (240 °C). While FA(MA)PbI3 decomposed at 275 °C, which is smaller than FAPbI3 (300 °C). It should be noted that this decomposition, by sequential loss of HI followed by organic part, only occurs when the organic species are incorporated into the perovskite structure.14 The identical thermal behavior was also observed from differential scanning calorimetry (DSC) in Fig. 6b. The thermal stability is related to the probability of HI formation, which is directly related to the acidity of the organic cation.21 The stronger the acidic character of the cation, the higher the chance that the organic cation can be deprotonated to yield HI. Since the FA cation is less acidic than MA and EA organic species, it is natural that the thermal decomposition is difficult in FA-incorporated perovskites. The pure FAPbI3 exhibits a peak at 156 °C, indicating a phase transition of FAPbI3 from the yellow δ phase to the perovskite structure at this temperature. MAPbI3 shows a peak at 57 °C which indicates a phase transition of tetragonal–cubic transition. Neither of the mixed perovskites shows any peaks, indicating that these mixed perovskites are stable over the investigated temperature range. UV-vis diffuse reflectance of perovskites were characterized by an UV-vis diffuse reflectance spectrometer to confirm the band gap energy of single crystals. Reflectance spectra for the single crystals as a function of wavelength in the range of 740–860 nm are presented in Fig. 6c. A further analysis of optical spectra can be performed to calculate band gap energy. The Kubelka–Munk equation at any wavelength is
 | (1) |
 | (2) |
| [F(R∞)hν]2 = C2(hν − Eg) | (3) |
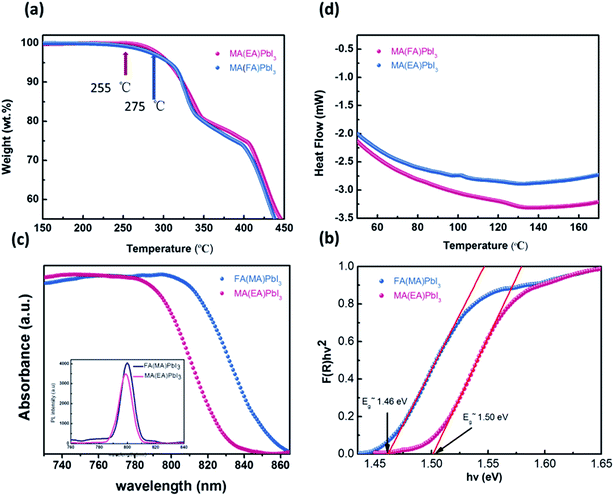 | ||
| Fig. 6 (a) TGA curves cubic phase crystals; (b) DSC heating curve of samples; (c) UV-vis diffuse reflectance spectrum and photoluminescence (PL) properties; (d) bandgap determination. | ||
Therefore, obtaining F(R∞) from eqn (1) and plotting [F(R∞)hν]2 against hν, the band gap energy, Eg, can be obtained easily, and are shown in Fig. 6d.
The optical bandgap of MA(EA)PbI3 is determined to be about 1.49 eV which is similar to MAPbI3. While the value of FA(MA)PbI3 is about 1.43 eV, that is smaller than MAPbI3. Fig. 6c also shows the photoluminescence (PL) spectra of the perovskite. MA(EA)PbI3 and FA(MA)PbI3 exhibit narrow PL peaks at 709 nm and 800 nm, respectively. PL measurement shows the light emission peak position of the single crystal is very close to the absorption onset, indicating low trap state density. From the UV-vis spectra and PL spectra, both MA(EA)PbI3 and FA(MA)PbI3 have superior light-absorbing capability which holds potential to be a suitable photoelectric material.
The trap density (ntrap) in cubic phase single crystals was investigated by using dark I–V technique to characterize fabricated hole-only device. When the applied voltage is lower than the kink-point voltage, the current I increase linearly with applied voltage V, demonstrating an ohmic response between the electrode and the perovskite for the hole-only device. As the applied voltage exceeds the kink-point voltage the current I exhibit a quick non-linear increase, indicating that the trap states are fully filled by the injected carriers. The applied voltage at the kink point is defined as the trap-filled limit voltage (VTFL), which is determined by the trap state density:19
 | (4) |
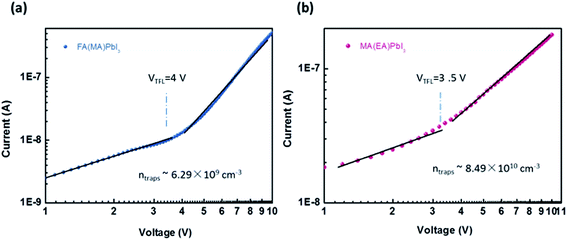 | ||
| Fig. 7 (a) and (b) Current–voltage curve for a hole only MA(EA)PbI3 device and hole only FA(MA)PbI3 device, respectively. | ||
Conclusions
In summary, we report a route to synthesis cubic phase crystal MA(EA)PbI3 and FA(MA)PbI3 by using inverse temperature reactive crystallization process. Big size organic cation EA+ incorporated into MAPbI3 and small size MA+ mixed with FA(MA)PbI3 could obtain stable cubic single crystal via altering the PbI6 octahedral cage and relaxed strain. The large radius of EA+ causes lattice dilation and adjusts the tolerance factor toward 1, favourable to stabilize the cubic perovskite. MA+ cation incorporated has reduced the lattice volume and relaxed the strain in lattice and thereby prevent the phase transition from the cubic phase to δ-phase. Both MA(EA)PbI3 and FA(MA)PbI3 single crystals show remarkable thermal stability with no endothermic peak at range 50–170 °C. Direct dark I–V measurement of cubic phase crystals indicates low trap state density. Both MA(EA)PbI3 and FA(MA)PbI3 have superior light-absorbing capability which holds potential to be a suitable photoelectric material.Conflicts of interest
There are no conflicts to declare.Acknowledgements
This work was supported by the National Natural Science Foundation of China (No. 51572241, 61704153, 51572033, 51172208, 11404029), the Scientific Research Project for the Education Department of Zhejiang Province (No. Y201738294), Science and Technology Department of Zhejiang Province Foundation (Grant No. 2017C37017).References
- J. J. Choi, X. Yang, Z. M. Norman, S. J. L. Billinge and J. S. Owen, Nano Lett., 2014, 14, 127–133 CrossRef CAS PubMed.
- L. Dou, Y. M. Yang, J. You, Z. Hong, W. H. Chang, G. Li and Y. Yang, Nat. Commun., 2013, 5, 5404 CrossRef PubMed.
- G. Xing, N. Mathews, S. S. Lim, N. Yantara, X. Liu, D. Sabba, M. Grätzel, S. Mhaisalkar and T. C. Sum, Nat. Mater., 2014, 13, 476–480 CrossRef CAS PubMed.
- Z. K. Tan, R. S. Moghaddam, M. L. Lai, P. Docampo, R. Higler, F. Deschler, M. Price, A. Sadhanala, L. M. Pazos and C. Dan, Nat. Nanotechnol., 2014, 9, 687–692 CrossRef CAS PubMed.
- Y. S. Chen, J. S. Manser and P. V. Kamat, J. Am. Chem. Soc., 2015, 137, 974–981 CrossRef CAS PubMed.
- G. Xing, N. Mathews, S. Sun, S. S. Lim, Y. M. Lam, M. Grätzel, S. Mhaisalkar and T. C. Sum, Science, 2013, 342, 344 CrossRef CAS PubMed.
- H. S. Kim, H. I. Sang and N. G. Park, J. Phys. Chem. C, 2014, 118, 5615–5625 CAS.
- N. Onoda-Yamamuro, T. Matsuo and H. Suga, J. Phys. Chem. Solids, 1990, 51, 1383–1395 CrossRef CAS.
- Y. Kawamura, H. Mashiyama and K. Hasebe, J. Phys. Soc. Jpn., 2002, 71, 1694–1697 CrossRef CAS.
- C. C. Stoumpos, C. D. Malliakas and M. G. Kanatzidis, Inorg. Chem., 2013, 52, 9019 CrossRef CAS PubMed.
- Y. Liu, J. Sun, Z. Yang, D. Yang, X. Ren, H. Xu, Z. Yang and S. Liu, Adv. Opt. Mater., 2016, 4, 1829–1837 CrossRef CAS.
- Z. Li, M. Yang, J. S. Park, S. H. Wei, J. J. Berry and K. Zhu, Chem. Mater., 2016, 28, 284–292 CrossRef CAS.
- W. Peng, X. Miao, V. Adinolfi, E. Alarousu, O. El Tall, A. H. Emwas, C. Zhao, G. Walters, J. Liu and O. Ouellette, Angew. Chem., Int. Ed. Engl., 2016, 55, 10686 CrossRef CAS PubMed.
- B. Charles, J. Dillon, O. J. Weber, S. Islam and M. T. Weller, J. Mater. Chem. A, 2017, 5, 22495 CAS.
- O. J. Weber, B. Charles and M. T. Weller, J. Mater. Chem. A, 2016, 4, 15375 CAS.
- Y. Liu, Z. Yang, D. Cui, X. Ren, J. Sun, X. Liu, J. Zhang, Q. Wei, H. Fan and F. Yu, Adv. Mater., 2015, 27, 5176–5183 CrossRef CAS PubMed.
- M. Luan, J. Song, X. Wei, F. Chen and J. Liu, CrystEngComm, 2016, 18, 5257–5261 RSC.
- M. R. Filip, G. E. Eperon, H. J. Snaith and F. Giustino, Nat. Commun., 2014, 5, 5757 CrossRef CAS PubMed.
- X. Zheng, C. Wu, S. K. Jha, Z. Li, K. Zhu and S. Priya, ACS Energy Lett., 2016, 1(5), 1014–1020 CrossRef CAS.
- Y. Zhao and J. Zhang, J. Appl. Crystallogr., 2008, 41, 1095–1108 CrossRef CAS.
- J. Yang, B. D. Siempelkamp, E. Mosconi, F. D. Angelis and T. L. Kelly, Chem. Mater., 2015, 27, 150529083734008 Search PubMed.
- J. Torrent and V. Barrón, Encyclopedia of Surface & Colloid Science, 2002 Search PubMed.
- N. Ramanujam and G. M. Palmer, Method for extraction of optical properties from diffuse reflectance spectra, US7570988, 2009 Search PubMed.
- A. E. Morales, E. S. Mora and U. Pal, Rev. Mex. Fis., 2007, 53, 18–22 CAS.
- D. Shi, V. Adinolfi, R. Comin, M. Yuan, E. Alarousu, A. Buin, Y. Chen, S. Hoogland, A. Rothenberger and K. Katsiev, Science, 2015, 347, 519 CrossRef CAS PubMed.
| This journal is © The Royal Society of Chemistry 2018 |

