 Open Access Article
Mechanical response of bilayer silicene nanoribbons under uniaxial tension†
M. R. Chávez-Castillo ab,
M. A. Rodríguez-Meza
 b and
L. Meza-Montes
 *a
*a
aInstituto de Física, Benemérita Universidad Autónoma de Puebla, Apdo. Postal J-48, 72570, Puebla, Pue., Mexico. E-mail: lilia@ifuap.buap.mx; Tel: +52 222 229 56 10
bInstituto Nacional de Investigaciones Nucleares, Apdo. Postal 18-1027, 11801, México, D.F., Mexico
First published on 19th March 2018
Abstract
Understanding the behaviour of nanoscale systems is of great importance to tailor their properties. To this aim, we investigate the Young's modulus (YM) of defect-free and defective armchair bilayer silicene nanoribbons (SNRs), at room temperature, as a function of length and distance between layers. In this study, we perform molecular dynamics simulations using the environment-dependent interatomic potential to describe the interaction of the Si atoms. We show that the Young's modulus of pristine and defective bilayer SNRs increases with the ribbon length exhibiting size dependence. In general, YM of defective bilayer SNRs is smaller than the value obtained for the defect-free case, as a result of the number of missing bonds. In all cases, as the interlayer distance increases YM decreases and the buckling increases. It is shown that the YM exhibits a quadratic interlayer distance dependence. Finally, when only one layer has a mono-vacancy defect, the atomic stress distribution of the pristine layer is affected by the presence of the vacancy. This effect can be considered as a “ghost vacancy” since the deterioration of the pristine layer is similar to that shown by the defective one. These results show that YM of pristine and defective bilayer SNRs could be tailored for a given length and interlayer distance. It is also found that the fracture stress and the fracture strain of defective bilayers are both smaller than those obtained for the defect-free ones.
1 Introduction
Over the past two decades, the study of materials have shifted from the micrometric scale to the nanometer scale, in order to inquire into materials at atomic scale. As we know, at this scale, effects related to a single atom or molecule could redefine the properties of materials compared to their bulk analogues. Thus, since the experimental discovery of graphene, the study of two-dimensional (2D) materials has become one of the areas of greatest interest within the scientific community.1–9 Although the study of graphene-like materials has been focused on their electronic properties because they have been considered the most stable ones to be used in the development of new electronic devices,3,5 the mechanical properties of this kind of materials has turned out to be one of the fields of major interest, since they present very promising applications in nano-electromechanical devices. In addition, due to their structural flexibility, it is possible to modify and adjust not only their mechanical properties but at the same time also their electronic properties,10 in order to get a better suit to the operating needs of the devices of interest. Therefore, understanding how the mechanical properties of 2D materials are affected when these are deformed, not only offers new attractive areas of study, but also allows the development of innovative devices using what is actually known as engineering-deformation or straintronics.11 Also, it is known that any change in the ideal material structure can be used to create new features of the material and, in this sense, one of the most inevitable changes is the presence of vacancy defects. Hence, it will be extremely important to understand how these defects influence the mechanical response of the material, so that the development and improvement of technology based on 2D materials will be possible.Now, following the boom over the past few years of monolayer silicene, bilayer and multilayer silicene have also attracted increased attention, not only because they could posses higher stability due to interlayer interaction, but also they could give rise to new opportunities for applications, such as optical applications by using hydrogenated bilayer silicene.12 Thus far, a diversity of studies about the mechanical properties of silicene have been reported.13–22 In the case of bilayer SNRs, it is well known that the interlayer interactions influence their physical properties. Theoretical studies have predicted that bilayer silicene nano-sheets have a wide variety of morphologies due to the possible interlayer covalent bonds.23 As the Young's Modulus (YM) is the most fundamental mechanical property of any material, we have shown that YM of silicene nanoribbons (SNRs) is determined by the width and the chirality of the ribbon, and it could be also modified by the change in temperature and the presence of vacancy defects.24 Additionally, Song, et al.13 have shown that armchair SNRs present a semiconductor behaviour, which indicates that this kind of nanoribbons may be used in a wide range of applications. Another important mechanical property of materials is failure. As in bulk materials, fracture mechanism of two-dimensional materials is one of the biggest concerns for the security in real applications. In this sense the interest in understanding the basic fracture mechanism of these materials is a work that is still in process. Fracture mechanism in graphene-like materials is annalized extending from the bulk classic theories. It has been shown that fracture is a complex process that it has not been fully understood. Therefore, the formulation of generalised criteria that describe the two-dimensional fracture mechanism has not yet been possible. However, Brochard et al.25 propose a fracture criterion for two different graphene structures, one previously fractured and one intact. This criterion describes a combined fracture mechanism that includes not only the stress, but also the energy. On the other hand, DFT calculations show that two-dimensional materials fail due to two instability cases. The first one corresponds to the elastic instability of atomic bonds under in-plane strain and the second one is associated to the phonon instability of out-of-plane relaxations of atoms.26,27 Furthermore, theoretical fracture results obtained in two-dimensional structures, such as graphene,28 molybdenum disulfide (MoS2),26 hexagonal boron-nitride (h-BN),29 phosphorene,30 silicene,31 borophene27 and two-dimensional silica,32 show that before the rupture of atomic bonds there are very large non-linear deformations. So, to obtain a full description of the fracture mechanism, the non-linear deformations should be considered.
In the present task we are interested in studying the mechanical response of two silicene mono-layers as a function of their interlayer distance. At small interlayer distances the layers tend to form the bulk-like structure of silicon. Nonetheless, at larger separations the bilayer structure is conserved. Thereby, the interlayer distances in our study were limited to those that conserve the two-dimensional structure. In that sense, we perform molecular dynamics simulations to study the Young's modulus and the failure response of defect-free and defective armchair bilayer SNRs as a function of length and interlayer distance. The rest of the paper is organized as follows: in Section 2, we briefly describe the calculation method; in Section 3, results of the mechanical properties of pristine and defective bilayer armchair SNRs are analyzed and discussed. Finally, the conclusions of the work are given in Section 4.
2 Methodology
We apply classical molecular dynamics simulations, at room temperature, to study the Young's modulus and failure stress of armchair bilayer silicene nanoribbons (B-SNRs) under uniaxial tension. A planar configuration of the bilayer SNR with a larger lattice constant has already been reported in the ref. 33. However, since the experimental results had found a buckled structure we employed the latter one. The interaction of the Si atoms, in the low-buckled bilayer SNRs, is described by the Environment-Dependent Interatomic Potential (EDIP)34 as implemented in LAMMPS.35 There is a variety of empirical potentials to describe the interactions between silicon atoms, however, EDIP potential was chosen to carry out the simulations of this study because it allows atomic interactions to vary according to the local environment (number of neighbouring atoms), it provides an accurate description of bonding and breaking process, and it reproduces the elastic constants for silicon very well. Even though the EDIP potential describes a graphitic phase, which was determined by first principles calculation of the cohesive properties of silicon both in the diamond and graphitic phases,34 by the time it was developed experimental data for silicene were not available. Despite of this, different interatomic potentials (Tersoff, Stillinger-Weber, MEAM, EDIP among others) have been used to simulate and compared with first principles calculations in order to validate the potential.14,36 Results show that EDIP potential can lead to more accurate outcomes since Si–Si bond length and buckled distance values are closer to those obtained from first principle calculations.14 Moreover, thermal conductivities for monolayer and silicon nanowires under uniaxial strain with EDIP potential have already been studied.37 Although this potential have limitations on the long-range interactions, DFT calculations have shown no difference when van der Waals interactions were included.33 It is worth to note that in our simulations it is guaranteed that long-range interactions are included within the environment dependent scheme of EDIP. However, an improved description of silicene's behaviour may be obtained by a new set of parameters as it has been done for graphene,38,39 but there are not enough available data, as in the bulk case, to compare with.Top and lateral views of the ideal bilayer structure are shown in Fig. 1. Note that the deformation direction matches with the ribbon's chirality and the buckling value corresponds to the monolayer silicene structure.40,41 Simulations are performed for four squared-shaped bilayer SNRs, whose lengths vary from 39 to 95 Å, with and without mono-vacancy defects. Table 1 shows ribbon lengths used in this study. It is important to highlight that the bilayer silicene configuration used in this study agrees with the AA stacking one, which corresponds to the most stable configuration.12,23,33,42,43
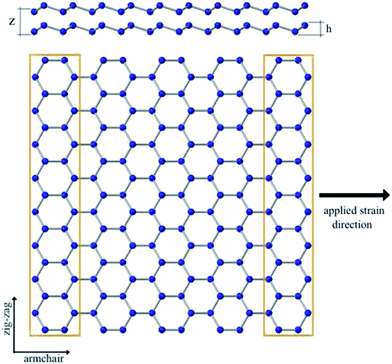 | ||
| Fig. 1 Top: Lateral view of the bilayer SNR structure with buckling distance h = 0.75 Å (ref. 40 and 41) and variable interlayer distance z. Bottom: Ideal defect-free bilayer SNR top view, along with the definitions of armchair and zig-zag directions. Yellow boxes represent the clamped regions in the simulations. | ||
| Length, Å | Armchair chirality |
|---|---|
| 39.44 × 40.18 | ach1 |
| 53.36 × 52.24 | ach2 |
| 60.32 × 60.28 | ach3 |
| 95.12 × 96.44 | ach4 |
We assume that two ideal monolayers with clamped ends approach each other at a given interlayer distance. In all simulations, each end along the zig-zag direction (the region within the box shown in Fig. 1) of the B-SNRs is attached to the simulation box in order to deform the structure. These regions are almost rigid. This gives us the possibility to apply a constant strain rate into the bilayer structure. Before deformation, an NVE ensemble is used to relax the ideal bilayer structure, with a vacuum space of 60 Å on each side along z-direction. Distributions of atomic relaxed positions showing the buckling are presented in Fig. S1.† After relaxing, we use an NVT ensemble to simulate uniaxial tension. The structure is deformed by displacing the right end of the bilayer at a strain rate of 0.005 ps−1 every time step during 180 ps. Velocity–Verlet algorithm with an integration time of 1 fs is used to integrate the motion equations of the Si atoms. In order to avoid any boundary effect in the structure along the tensile direction, we apply periodic boundary conditions along the direction of tension, which is also the chirality direction. As mentioned before, because free silicene is not a stable structure and tends to form its more stable structure, the interlayer distance (distance between the semi-rigid regions) is fixed in each simulation in order to preserve the two-dimensional structure of Si atoms. Silicon atoms in the bilayer silicene structure are arranged alternatively in two-layers. So, the bilayer thickness for each interlayer distance corresponds to the distance between the outer atoms of the layers. YM was obtained by a linear interpolation in the elastic regime (linear region) of the strain–stress curve, since this value is defined as the corresponding slope of this region. More details about the validation of our methodology can be found in ref. 24.
3 Results
In this section, we investigate the YM behaviour of armchair B-SNRs for different lengths (see Table 1) and interlayer distances. It should be noted that the interlayer distance (z) varies from 1.5 to 3.13 Å. The first one corresponds to twice the buckling value, in order to avoid the formation of covalent bonding of the silicon atoms between the layers, which consequently leads to the formation of bulk silicon. Finally, the last value corresponds to the range of the EDIP potential.343.1 Defect-free bilayer SNRs
Fig. 2 shows the YM obtained for each defect-free B-SNRs as a function of the interlayer distance. As we can see, the YM increases with ribbon's length. This size dependence has been observed in monolayer silicene24 and graphene.44 Moreover, YM value decreases as the interlayer distance increases for all sizes. Bond length within each layer has been reported with a value around 2.4 and 2.6 Å for flat and buckled configurations, respectively.45,46 Likewise, the existence of a strong coupling between layers of silicene has been already reported in ref. 33 and 47. Thus, larger YM values at small distances could indicate that silicene layers form strong covalent bonds to each other. So, due to the formation of these interlayer bonds the bilayer structures carry more strain. In this sense, as the interlayer distance increases then the interaction between layers decreases resulting in the formation of weaker interlayer bonds causing the structure to be less strain supportive and, consequently, a decreasing in YM. As can be seen in Fig. 2, this behaviour of the YM exhibits a quadratic interlayer distance dependence. Since in our case YM is the second derivative of total energy respect to strain on the plane, its quadratic dependence on interlayer distance suggests that the potential energy depends on the latter one in a similar way. This in turn indicates an elastic behaviour of the interlayer interaction, which decays as the layers become separated. It also suggests an anisotropic mechanical behaviour of the B-SNRs as expected.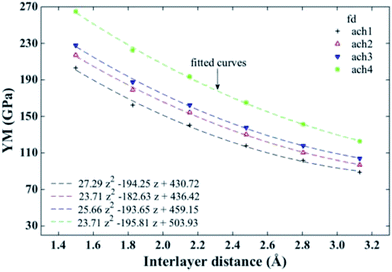 | ||
| Fig. 2 Young's modulus for different sizes of free of defects (fd) armchair B-SNRs vs. interlayer distance. ach and number label indicate the chirality and the size of the ribbon, respectively (see Table 1). Fitted curves show the non-linear behaviour of the Young's modulus. | ||
In addition, the load carrying capacity of the bilayer can be also explained in terms of the buckling. In Fig. 3 we present the ach3 B-SNRs buckling behaviour as a function of the interlayer distance. We can see that at smaller interlayer distances the buckling decreases, i.e., as the layers are closer to each other the structure tends to be flat. This behaviour has been reported for free-standing bilayer silicene by Padilha, et al.,33 and it is a consequence of the minimization of the system energy. So, the system prefers to lose its π cloud in order to minimize its energy, leading to the formation of σ bonds between the layers. Besides, the charge density passing through the chemical bonds of almost all atoms in the structure is nearly the same, which is a feature of the covalent systems. As a result, the atoms of both layers form strong bonds between each other (interlayer bonds) in the same way as the atoms on the same layer are bonded.33 Hence, the layers are less bonded as the interlayer distance increases. So, in order to preserve the bilayer structure, the buckling increases until it reaches the equilibrium buckling distance (h = 0.75 Å (ref. 40 and 41)) which corresponds to the silicene sheet. These results show that the formation of interlayer bonds helps the structure to support deformations better at smaller bucklings. Moreover, because there are no interlayer bonds formation at large separations, the space between layers is not available to support the load, which makes the structure more fragile.
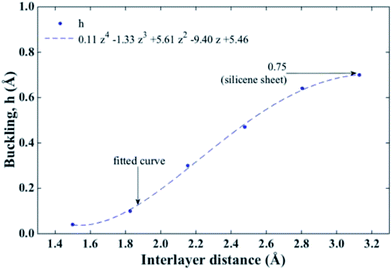 | ||
| Fig. 3 Variation in the buckling behaviour for ach3 B-SNR vs. interlayer distance. At lower distances the bilayer becomes unstable. At larger distances the nanoribbons tend to get the ideal buckling. | ||
To analyse in more detail the YM behaviour we choose the B-SNR of 60 × 60 Å (ach3), which corresponds to an intermediate size. Fig. 4 shows the YM values obtained for pristine and defective monolayer and bilayer SNRs for this nanoribbon. Solid lines (black on line) and dashed lines represent the YM for mono- and bi-layer SNRs, respectively.
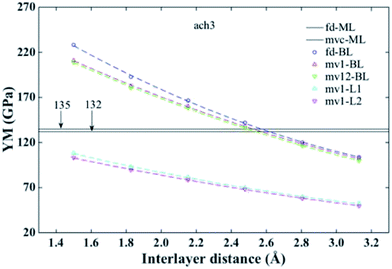 | ||
| Fig. 4 Young's modulus for ach3 B-SNR vs. interlayer distance. ML and BL correspond to monolayer and bilayer results, respectively. mvc represents a mono-vacancy defect at the center of the monolayer. mv1 (mv12) corresponds to one mono-vacancy defect in the bottom layer (both layers) at the center of the B-SNR. L1 and L2 indicates the bottom and the top layers, respectively (see Fig. 1). Horizontal black lines are the values obtained for pristine and defective monolayers in ref. 24. | ||
It is important to note, that the YM for defect-free and defective monolayer SNRs (fd-ML and mvc-ML, respectively) has been already reported in ref. 24. Now, for the pristine bilayer (fd-BL) case (circle dashed line – blue on line – in Fig. 4), Lian, et al.48 reported an interlayer distance of the free-standing bilayer of ∼2.46 Å. Additionally, the monolayer shows a YM value around 135 GPa. In Fig. 4 we can see that the bilayer presents this YM value at a interlayer distance of ∼2.5 Å. As this value is in good agreement with the already reported by Lian, et al., we could say that at this separation distance the bilayer structure shows a similar mechanical behaviour to that observed for the monolayer. This bilayer behaviour may be advantageous for applications that need to work around this YM value, since it would be indistinct to use a monolayer or a bilayer.
3.2 Defective bilayer SNRs
In ref. 24, YM results obtained for pristine and defective monolayers were obtained. Results for defective SNRs indicate that not only length and chirality are important, but also the number and position of vacancies influence the value of YM. Defects may not only deteriorate the mechanical properties of the material, but also be useful to tailor its properties in order to perform with specific applications needs. In that sense, we are interested on studying the response of the combination of defective layers as a function of their interlayer distance, i.e. how their mechanical behavior is as the layers approach each other. So, to study defective B-SNRs we consider two kinds of configurations. The first one corresponds to a mono-vacancy defect in the bottom layer of the B-SNR (mv1), and the second one correspond to one mono-vacancy defect in each layer of the ribbon (mv12). It should be noted that mono-vacancy (mv) defects in the structure were created by removing one atom approximately at the center of the ribbon's layer. As the first configuration shows the most interesting behaviour its results are presented below (Fig. 5). Results of the second one are shown in the ESI (see Fig. S2†).In Fig. 6 we present the YM of defective B-SNR for configuration shown in Fig. 5. Density, type and distribution of vacancies are important.24 Keeping a single mvc in either one or both layers, it can be seen that the longer the bilayer nanoribbons the larger the YM. The decrease of the load carrying capacity of the structure in presence of vacancy defects is due to the number of missing bonds, so that the greater number of missing bonds induces a larger deterioration of the structure. As a result, the bonds in the structure carry less strain making it easier to deform.24 From Fig. 5 and S2† we can see that mv1 and mv12 configurations have 3 and 6 missing bonds, respectively. Thus, YM values for mv1 configurations are slightly larger than those obtained for mv12 configurations, because of the total number of missing bonds compared to the total number of atoms makes no significant difference.
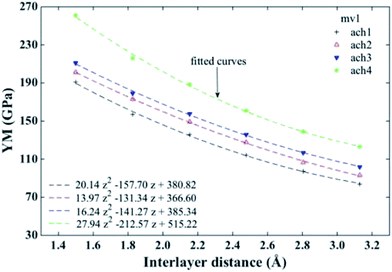 | ||
| Fig. 6 Young's modulus of mv1 defective B-SNRs configuration vs. interlayer distance. ach and number label indicate the chirality and the size of the ribbon, respectively (see Table 1). Fitted curves show the non-linear behaviour of the Young's modulus. | ||
As before, we now analyse the ach3 B-SNR in more detail. Fig. 4 shows the YM values obtained for defect-free and defective configurations. We can see that YM values for mv1 (up triangles, red on line) and mv12 (down triangles, blue on line) configurations are smaller than those observed in the defect-free configuration. A similar behaviour for silicene sheet and monolayer SNRs with one mv in their center has already reported.24,49 Small differences between both bilayer configurations, as we mentioned before, are due to the fact that mv12 has a larger number of missing bonds. So, YM values for mv12 are smaller than those observed for mv1.
It is important to emphasize that the YM for a monolayer SNR with one mv at the ribbon's center (mvc) is ∼132 GPa (ref. 24) (value indicated by one of the horizontal lines in Fig. 4). For a bilayer, this value correspond to a interlayer distance of ∼2.5 Å. So, alike to the defect-free case, at this separation distance the bilayer shows a mechanical behaviour similar to that observed in the monolayer SNR. As the mv1 configuration presents one mv in the center of one layer, we determined the YM of each layer. Thereby, each YM value obtained should correspond to its respective monolayer SNRs case, i.e., the YM of the layer with one mono-vacancy (mv1-L1) corresponds to the value obtained for the monolayer SNR with one mvc, and the YM of the second layer (mv1-L2) corresponds to the defect-free monolayer SNR. Fig. 4 shows the sum of the YM values obtained for each layer (cyan (magenta) up (down) triangles on line) of the B-SNR. Note that the sum of the YM values is equal to the YM obtained for the bilayer (up triangles, red on line). Nevertheless, the YM of the separated layers are smaller than those obtained for the monolayer SNRs, so the YM of B-SNRs depends on the interaction between layers as it was pointed out before. It is also observed that the YM of the first layer (mv1-L1) is slightly larger than the YM obtained for the second layer (mv1-L2). These results can be explained in terms of the atom stress distribution.
It is well known that when an uniaxial tension is applied, every single bond of the structure carries the same tensile stress, i.e., the stress is evenly distributed through the material. However, in the presence of vacancy defects, the tensile stress distribution will not remain uniform due to the missing bonds. Because of this, the vacancy area is not longer available to support the stress, so it must be distributed among the bonds of the atoms that surround it. It is important to highlight that the stress will not be uniformly distributed around these atoms, but it will be re-distributed unevenly. This phenomenon is known as “stress distribution”.
Stress distributions for the mv1 configuration of the ach3 relaxed structure, at three different z values, are shown in Fig. 7–9. Left (right) figure corresponds to the defective layer (defect-free layer) of the mv1 configuration. Note that the stress distributions are normalized to the maximum stress value, which corresponds to the stress distribution of the defect-free layer at z = 1.50 Å (see Fig. (7b)). To obtain the actual stress values determined by the molecular dynamics divide values by the value indicated on the top.
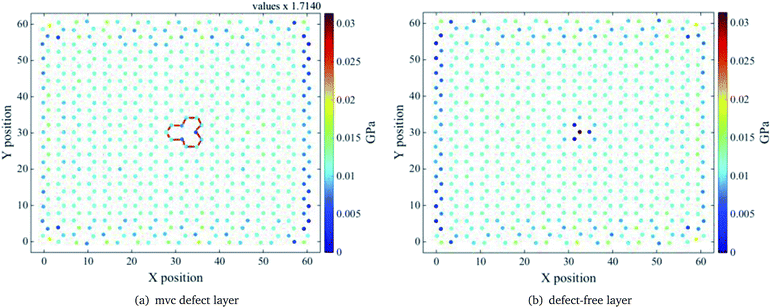 | ||
| Fig. 7 Relaxed ach3 B-SNR stress distribution for the mv1 configuration shown in Fig. 5. Interlayer distance z = 1.50 Å. Red lines indicate the mono-vacancy position. Notice that the pristine layer shows a larger stress on top of the vacancy, as if a defect were there. | ||
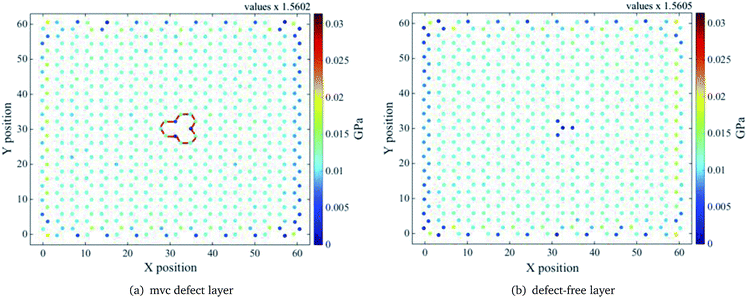 | ||
| Fig. 8 Relaxed ach3 B-SNR stress distribution for the mv1 configuration shown in Fig. 5. Interlayer distance z = 2.48 Å. Red lines indicate the mono-vacancy position. | ||
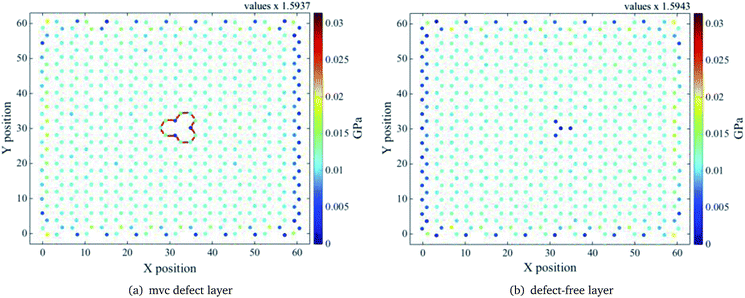 | ||
| Fig. 9 Relaxed ach3 B-SNR stress distribution for the mv1 configuration shown in Fig. 5. Interlayer distance z = 3.13 Å. Red lines indicate the mono-vacancy defect position. | ||
For the smallest z value, the defective layer presents a non uniform tensile stress distribution, as expected, due to the presence of the mvc defect. However, for the defect-free layer the stress distribution around the atoms on the top of the mv defect is not completely uniform, in spite of being a pristine layer, because the atom above the vacancy has also to support a part of the stress corresponding to the missing atom (see Fig. 7). This is due to the absence of the interlayer bond between the vacancy and the atom right above it and the strong interaction between layers. Because of this, the presence of the vacancy defect must influence the behaviour of the pristine layer. Based on the self-healing mechanism of vacancy defects,50 it is known that the atoms surrounding the vacancy move towards the centre of the vacancy and the dangling bonds are reoriented to close it. For a mono-vacancy, the three dangling bonds around it form bonds that are stable and have the same length. Thus, on the one hand the formation of these bonds helps the defective layer structure to support more deformations and on the other hand, as only one atom on the pristine layer has to carry more strain the bonds with its neighbour atoms are easier to deform. Thereby, the deformation resistance of this layer is lower, since the bonds above the vacancy area reach their breaking length more easily than the bonds around the vacancy. As a result, the defective layer YM is larger than the pristine one, as can be seen in Fig. 4. As shown in Fig. 8 and 9, as the interlayer distance increases the stress supported by the atom above the mono-vacancy tends to decrease, because the role of the interlayer interaction diminishes. So, at a greater interlayer distance the stress transferred to the atom above the vacancy is smaller and the stress that the missing atom should support is mostly distributed to the bonds of the pristine layer. Note that, the stress distributions of both layers are similar, i.e. at larger interlayer distances both layers carry almost the same stress. Therefore, YM of the separated layers are similar.
3.3 Failure response
It is worth noting that fracture mechanism in graphene-like materials shows a different fracture behaviour from their same bulk materials. Thus, the fracture behaviour of this kind of materials is still an open aim that needs further explorations. As failure response of silicene nanoribbons remains unexplored, we present some results about it below.Failure behaviour of free-defect and defective B-SNRs under uniaxial tension is shown in Fig. 10. As the mv1 and mv12 configurations do not show a significant difference in their mechanical behaviour, we only present the results of the mv1 configuration. The total number of atoms supports the mechanical response of the structure, as we mentioned in Section 3.2. Our results indicate that fracture stress of the free and defective bilayers decreases as the interlayer distance increases. As highlighted in Section 3.1, at smaller interlayer distances the bilayer structure tends to be flat, and in that sense our results suggest that the fracture stress is related to the buckling, decreasing as the latter one increases. This behaviour has been observed in two-silicon films composed of 2 plane- and 2 buckled-layers.20 Moreover, the fracture strains are around 13% and 12% for the defect-free and defective B-SNRs, respectively. It is worth mentioning that the fracture stress (strain) for pristine and defective (mvc) monolayer, with the same dimensions, are 12.23 GPa (∼12%) and 11.47 GPa (∼11%), respectively. As it can be seen in Fig. 10, pristine (defective) bilayers with separations smaller than ∼2.7 Å (∼2.8 Å) show larger failure stress than the pristine (defective) monolayers. Thereby, at smaller interlayer distances the B-SNRs fail easier. So, the use of a monolayer is preferred in applications that do not require larger failure stresses. Note that, like the YM, this mechanical property presents quadratic interlayer distance dependence. This non-linear behaviour may be due to factors such as: stress, energy release, non-linear deformations prior fracture and the phonon and atomic bonds instabilities.25–27
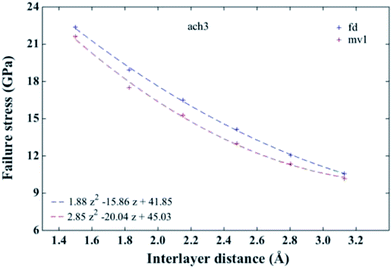 | ||
| Fig. 10 Failure stress for ach3 B-SNR vs. interlayer distance. fd and mv1 indicate the pristine and defective (Fig. 5) B-SNR, respectively. Fitted curves show the non-linear behaviour of the failure stress. | ||
4 Conclusions
With the aim to study the mechanical response of two silicene monolayers as they approach each other, we perform molecular dynamics simulations, at room temperature, to research the Young's modulus and failure response of pristine and defective bilayers silicene nanoribbons. For both cases, the YM of bilayer SNRs exhibits size dependence. Besides, YM values decreases as the distance between layers increases, as a result of a weaker inter-layer interaction, i.e., the formation of weaker interlayer bonds. Formation of these bonds is also explained in terms of the buckling distance. Firstly, when the layers are close enough the structure tends to be flat and as a result the atoms of the different layers bond strongly. Secondly, as the interlayer distance increases, the layers increases their buckling in order to conserve the bilayer structure, and the strength of the bonds between layers decreases. The quadratic behaviour of YM as a function of the interlayer distance suggests a elastic interaction among the layers. In general, defective bilayer SNRs present YM values slightly smaller than those obtained for the pristine ones, due to the number of missing bonds. We obtained the YM values of each layer that form the bilayer. These results show that, if the vacancy is set only in one layer, YM has slightly larger values than those obtained in the case where both layers have a mono-vacancy. When only one layer has a mono-vacancy defect, the atomic stress distribution of the pristine layer is also affected by the presence of the vacancy. Thus, pristine layer presents a larger stress concentration on the atom that is located just above the vacancy defect. This stress concentration on the atom deteriorates the pristine layer similar to that produced in the defective-layer, which can be considered as a “ghost vacancy”. In consequence YM of the defective-layer has values slightly larger than those obtained for the pristine layer. Nonetheless, as the interlayer-distance decreases the influence of the vacancy on the pristine layer is decreasing and the YM value of both layers tends to be similar. The specific analysis of the ach3 B-SNRs, with and without monovacancy defects, shows that at an interlayer distance around 2.5 Å, B-SNRs behave as a monolayer. These results show that YM of bilayers can also be modulated in a non-linear way by means of vacancies. Finally, the failure behaviour of pristine and defective SNRs shows that fracture stress and fracture strain are both larger in the first one. As a function of the interlayer distance failure stress shows a non-linear behavior indicating a complex failure response, which could depend on the non-linear deformations, bond atoms and phonon instability, stress and energy release. Note that because EDIP potential is not fitted to silicene experimental data our results are rather qualitative and they can be useful to tailor the mechanical properties of B-SNRs by means of ribbons's length, defects and the interlayer distance.Conflicts of interest
There are no conflicts of interest to declare.Acknowledgements
Partially supported by CONACYT and VIEP-BUAP, México.References
- K. S. Novoselov, A. K. Geim, S. V. Morozov, D. Jiang, Y. Zhang, S. V. Dubonos, I. V. Grigorieva and A. A. Firsov, Science, 2004, 306, 666–669 CrossRef CAS PubMed.
- A. K. Geim and K. S. Novoselov, Nat. Mater., 2007, 6, 183–191 CrossRef CAS PubMed.
- A. H. Castro Neto, F. Guinea, N. M. R. Peres, K. S. Novoselov and A. K. Geim, Rev. Mod. Phys., 2009, 81, 109–162 CrossRef CAS.
- G. G. Guzmán-Verri and L. C. Lew Yan Voon, Phys. Rev. B, 2007, 76, 075131 CrossRef.
- A. Kara, C. Léandri, M. E. Dávila, P. De Padova, B. Ealet, H. Oughaddou, B. Aufray and G. Le Lay, J. Supercond. Novel Magn., 2009, 22, 259–263 CrossRef CAS.
- B. Aufray, A. Kara, S. Vizzini, H. Oughaddou, C. Léandri, B. Ealet and G. L. Lay, Appl. Phys. Lett., 2010, 96, 183102 CrossRef.
- A. Kara, H. Enriquez, A. P. Seitsonen, L. L. Y. Voon, S. Vizzini, B. Aufray and H. Oughaddou, Surf. Sci. Rep., 2012, 67, 141 CrossRef CAS.
- S. Cahangirov, M. Topsakal, E. Aktürk, H. Sahin and S. Ciraci, Phys. Rev. Lett., 2009, 102, 236804 CrossRef CAS PubMed.
- N. D. Drummond, V. Zólyomi and V. I. Fal'ko, Phys. Rev. B, 2012, 85, 075423 CrossRef.
- G. G. Naumis, S. Barraza-Lopez, M. Oliva-Leyva and H. Terrones, Rep. Prog. Phys., 2017, 80, 096501 CrossRef PubMed.
- C. Si, Z. Sun and F. Liu, Nanoscale, 2016, 8, 3207–3217 RSC.
- B. Huang, H.-X. Deng, H. Lee, M. Yoon, B. G. Sumpter, F. Liu, S. C. Smith and S.-H. Wei, Phys. Rev. X, 2014, 4, 021029 Search PubMed.
- Y.-L. Song, Y. Zhang, J.-M. Zhang, D.-B. Lu and K.-W. Xu, J. Mol. Struct., 2011, 990, 75–78 CrossRef CAS.
- X. Yuan, G. Lin and Y. Wang, Mol. Simul., 2016, 42, 1157–1164 CrossRef CAS.
- Y. D. Kuang, L. Lindsay, S. Q. Shi and G. P. Zheng, Nanoscale, 2016, 8, 3760–3767 RSC.
- T. Zhang, Z.-Y. Zeng, Y. Cheng, X.-R. Chen and L.-C. Cai, New J. Phys., 2016, 18, 043001 CrossRef.
- E. Zaminpayma and P. Nayebi, Phys. E, 2016, 84, 555–563 CrossRef CAS.
- R. Li, Z. Liu, W. Ma and Y. Tan, AIP Adv., 2016, 6, 055204 CrossRef.
- N. Liu, J. Hong, R. Pidaparti and X. Wang, 2D Mater., 2016, 3, 035008 CrossRef.
- Y. He, H. Li, F. Wei, J. Qi, Q. Meng and Y. Sui, Comput. Mater. Sci., 2017, 134, 153–159 CrossRef CAS.
- N. Ding, H. Wang, X. Chen and C.-M. Lawrence Wu, RSC Adv., 2017, 7, 10306–10315 RSC.
- B. Mortazavi, O. Rahaman, M. Makaremi, A. Dianat, G. Cuniberti and T. Rabczuk, Phys. E, 2017, 87, 228–232 CrossRef CAS.
- T. Morishita, M. J. Spencer, S. P. Russo, I. K. Snook and M. Mikami, Chem. Phys. Lett., 2011, 506, 221–225 CrossRef CAS.
- M. R. Chávez-Castillo, M. A. Rodríguez-Meza and L. Meza-Montes, RSC Adv., 2015, 5, 96052–96061 RSC.
- L. Brochard, I. G. Tejada and K. Sab, J. Mech. Phys. Solids, 2016, 95, 632–646 CrossRef CAS.
- T. Li, Phys. Rev. B, 2012, 85, 235407 CrossRef.
- H. Wang, Q. Li, Y. Gao, F. Miao, X.-F. Zhou and X. G. Wan, New J. Phys., 2016, 18, 073016 CrossRef.
- F. Liu, P. Ming and J. Li, Phys. Rev. B, 2007, 76, 064120 CrossRef.
- J. Wu, B. Wang, Y. Wei, R. Yang and M. Dresselhaus, Mater. Res. Lett., 2013, 1, 200–206 CrossRef CAS.
- Q. Wei and X. Peng, Appl. Phys. Lett., 2014, 104, 251915 CrossRef.
- Q. Peng, X. Wen and S. De, RSC Adv., 2013, 3, 13772–13781 RSC.
- E. Gao, B. Xie and Z. Xu, J. Appl. Physiol., 2016, 119, 014301 CrossRef.
- J. E. Padilha and R. B. Pontes, J. Phys. Chem. C, 2015, 119, 3818–3825 CAS.
- J. F. Justo, M. Z. Bazant, E. Kaxiras, V. V. Bulatov and S. Yip, Phys. Rev. B, 1998, 58, 2539–2550 CrossRef CAS.
- S. Plimpton, J. Comp. Physiol., 1995, 117, 1–19 CAS.
- Y. Jing, Y. Sun, H. Niu and J. Shen, Phys. Status Solidi B, 2013, 250, 1505–1509 CrossRef CAS.
- M. Hu, X. Zhang and D. Poulikakos, Phys. Rev. B, 2013, 87, 195417 CrossRef.
- N. A. Marks, Phys. Rev. B, 2000, 63, 035401 CrossRef.
- N. Marks, J. Phys.: Condens. Matter, 2002, 14, 2901 CrossRef CAS.
- P. Vogt, P. De Padova, C. Quaresima, J. Avila, E. Frantzeskakis, M. C. Asensio, A. Resta, B. Ealet and G. Le Lay, Phys. Rev. Lett., 2012, 108, 155501 CrossRef PubMed.
- R. Ansari, S. Rouhi and S. Ajori, Superlattices Microstruct., 2014, 65, 64–70 CrossRef CAS.
- W. Luo, Y. Ma, X. Gong and H. Xiang, J. Am. Chem. Soc., 2014, 136, 15992–15997 CrossRef CAS PubMed.
- P. Pflugradt, L. Matthes and F. Bechstedt, Phys. Rev. B, 2014, 89, 205428 CrossRef.
- H. Zhao, K. Min and N. R. Aluru, Nano Lett., 2009, 9, 3012–3015 CrossRef CAS PubMed.
- G. A. Tritsaris, E. Kaxiras, S. Meng and E. Wang, Nano Lett., 2013, 13, 2258–2263 CrossRef CAS PubMed.
- S. Naji, B. Khalil, H. Labrim, M. Bhihi, A. Belhaj, A. Benyoussef, M. Lakhal and A. E. Kenz, J. Phys.: Conf. Ser., 2014, 491, 012006 CrossRef.
- C. Kamal, A. Chakrabarti, A. Banerjee and S. K. Deb, J. Phys.: Condens. Matter, 2013, 25, 085508 CrossRef CAS PubMed.
- C. Lian and J. Ni, AIP Adv., 2013, 3, 052102 CrossRef.
- M.-Q. Le and D.-T. Nguyen, Appl. Phys. A, 2015, 118, 1437–1445 CrossRef CAS.
- V. O. Özçelik, H. H. Gurel and S. Ciraci, Phys. Rev. B, 2013, 88, 045440 CrossRef.
Footnote |
| † Electronic supplementary information (ESI) available: Complementary results on the mechanical response obtained for the bilayer silicene nanoribbons. See DOI: 10.1039/c7ra12482a |
| This journal is © The Royal Society of Chemistry 2018 |

