 Open Access Article
Separation of bovine hemoglobin using novel magnetic molecular imprinted nanoparticles
Yujie Suab,
Bixia Qiu ab,
Cuihua Changab,
Xin Liab,
Mengqi Zhangab,
Bei Zhouc and
Yanjun Yang*ab
aState Key Laboratory of Food Science and Technology, Jiangnan University, Wuxi 214122, PR China
bSchool of Food Science and Technology, Jiangnan University, Lihu Avenue 1800, Wuxi, 214122, PR China. E-mail: yangyj@jiangnan.edu.cn; Fax: +86-510-85329080; Tel: +86-510-85329080
cJiangsu Kang De Egg Industry Co., Ltd., Nantong 226600, PR China
First published on 7th February 2018
Abstract
Magnetic molecular imprinted nanoparticles (MMIPs), combining the progressiveness of magnetic nanoparticles and surface molecular imprinting technology, have attracted increasing attention because of the high efficiency and specificity in isolation and enrichment of the target protein. This study focused on the preparation of bovine hemoglobin MMIPs with bovine hemoglobin (BHb) as the template protein and the molecular imprinted polymer covering the functional magnetic nanoparticles modified with silane and acrylic groups. The physicochemical characteristics as well as the dynamics and isothermal adsorption properties of the generated nanoparticles were investigated to determine their efficiency and specificity in the adsorption of target protein. The maximum adsorption of the target protein was 169.29 mg g−1 at a specific pH, which was much larger than those obtained in some other research reports. MMIPs showed favorable selectivity towards BHb in a mixture of three different proteins. The results indicated the significant effects and broad prospects of MMIPs in the isolation and enrichment of specific proteins in the field of food, medicine and biological research.
1. Introduction
Molecular imprinting is the strategy of complementary pairing between the matrix and the target molecule in terms of molecular size, morphological conformation, three-dimensional structure and active groups. The molecular imprinting technique (MIT), with the target molecule as a template that is combined with a functional monomer by adding a crosslinking agent, forms a type of polymer with cavities that are complementary with the target molecules through the polymerization reaction. After the template molecules are eluted, the cavities occur on the surface of the polymer with a fixed shape and a determined arrangement of functional groups. Currently, MIT is widely used in the identification and separation of small molecules, such as antibiotic determination,1 toxin detection,2 and drug release.3Various preparation methods have been investigated for molecularly imprinted polymers, including solution bulk polymerization,4 suspension polymerization,5,6 emulsion polymerization,7,8 seed expansion polymerization,9 precipitation polymerization10 and surface imprinting technology.11,12 Recently, surface molecular imprinting technology, consisting of self-assembled polymerization,13 distillation precipitation polymerization,14 surface-initiated atom and transfer radical polymerization,15 has attracted increasing attention due to its small mass transfer resistance, high imprinting efficiency and fast adsorption rate. The surface molecular imprinting technique refers to molecule imprinting polymerization on the surface of solid supporters, which includes two basic types. One is on the surface of pores inside the supporters, such as mesoporous materials; the other is on the surface of microspheres, such as silica particles, graphene particles, Fe3O4 magnetic nanoparticles and nanotubes.16 Although these surface imprinted materials display the characteristics of high imprinting efficiency, most of them are difficult to separate because of the hydrophilic groups and complicated precipitation process. Magnetic molecular imprinted nanoparticles (MMIPs) combining magnetic susceptibility with a surface molecular imprinted polymer not only achieve high selectivity and adsorption, but also promote the effective separation of the matrix from the solution, thus facilitating the capture of the target molecules.
It is well known that proteins showing impeded diffusion in traditional monolithic imprints, insolubility in common imprinting solvents, general flexibility and instability have restricted the application of the protein molecular imprinting technique.17 However, the recognition, adsorption, separation and enrichment of proteins by MMIPs have recently gained plenty of attention.18 Jing et al. have prepared multifunctional lysozyme-imprinted nanoparticles for lysozyme recognition and adsorption.19 Li et al. have successfully synthesized bovine hemoglobin surface-imprinted polystyrene (PS) nanoparticles with magnetic susceptibility20 and poly(3-amino-phenylboronic acid)-coated MMIPs21 with high adsorption capacity for the template protein BHb. Recent progress has been made in using MMIPs for preparing and analyzing food samples.22 Moreover, molecularly imprinted core–shell magnetic nanoparticles were applied for selective enrichment of proteins in MALDI-TOF MS analysis.23
In this study, magnetic nanoparticles, which were functionalized by silane and acrylic groups, were coated by the synthesized bovine hemoglobin (BHb) imprinted polymer. A transmission electron microscope (TEM) was used to observe the morphologies and structures of MMIPs. The chemical functionalities on the surface of the modified MMIPs were determined by Fourier transform infrared spectroscopy (FT-IR). The components and magnetic content of the MMIPs were investigated by thermo-gravimetric (TG) analysis.24 The dynamic adsorption, isothermal adsorption, reusability and the effect of different pH towards adsorption were investigated. In addition, the specific adsorption of MMIP towards BHb was determined by SDS-PAGE electrophoresis.
2. Materials and methods
2.1. Materials
The chemicals 25% ammonia solution (NH3·H2O), iron(II) sulfate heptahydrate (FeSO4·7H2O), iron(III) chloride hexahydrate (FeCl3·6H2O), ethanol (C2H5OH), tetraethyl orthosilicate (TEOS), acrylic acid (AA), methacrylic acid (MAA), and itaconic acid (IA) were all of analytical reagent grade and used without further purification. Ovalbumin (OVA), bovine serum albumin (BSA) and bovine hemoglobin (BHb) were purchased from Sinopharm Chemical Reagent Co. Ltd (Shanghai, China). Highly pure water with an electrical resistivity of 18.2 MΩ cm−1 was used throughout all the experiments.2.2. Synthesis of Fe3O4@SiO2-AA nanoparticles
According to the method of chemical precipitation of the Fe3O4 reported by Liu et al.25 and the decoration of the groups of O–Si–O and –COOH reported by Guo et al.,26 the Fe3O4@SiO2-AA nanoparticles were prepared as follows. Fe3O4·7H2O (0.80 g) and FeCl3·6H2O (1.17 g) were dissolved in deionized water (200 mL) and absolute ethanol (40 mL) in a four-neck flask with mechanical agitation of 900 rpm protected by nitrogen (N2) flow. Under stirring for 0.5 h at 60 °C, a 25% NH3·H2O aqueous solution (5 mL) was added to the mixture, changing the pH of the solution to 10–11, and transforming the solution color from orange to black.25 After 10 min, the reaction mixture of Fe3O4 was cooled to 30 °C, and a mixture of TEOS (1 mL) and ethanol (20 mL) was added dropwise to the solution. After reacting for 2 h with stirring at 900 rpm, the product Fe3O4@SiO2 was placed in an external magnetic field. The supernatant was removed when the magnetic nanoparticles were gathered. After washing several times with deionized water, the magnetic nanoparticles were dispersed in a mixture of AA (5 mL) and ethanol (160 mL), followed by reaction at 30 °C for 2 h. The functionalized superparamagnetic nanoparticles were then separated by a permanent magnet and washed several times with super pure water and ethanol, in sequence. Finally, the product Fe3O4@SiO2-AA was dried in vacuum.2.3. Preparation of magnetic molecular imprinted nanoparticles (MMIPs) and non-molecular imprinted nanoparticles (NMIPs)
With reference to the research reported by Guo et al.,26 the MMIPs and NMIPs were prepared in a convenient and rapid way as described below. Initially, 60 mg Fe3O4@SiO2-AA particles were mixed with methacrylic acid (MAA, 70 μL) and itaconic acid (IA, 25 mg) as functional monomers and N′,N-methylenebisacrylamide (N′,N-MBA, 16 mg) as a crosslinking agent, dispersed in 20 mL PBS aqueous solution (0.02 M, pH 7). After ultrasonic vibration for 20 min, the template protein BHb (10 mg) was added into the mixture to prepare the MMIPs. The mixed solution was stirred at 25 °C at a shaking bath speed of 150 rpm for 1 h to pre-assemble the mixtures, followed by purging with a nitrogen steam for 10 min. Then, 70 μL APS (20%) and 14 μL TEMED were added into the above suspension to initiate the reaction. After shaking at 25 °C at a speed of 150 rpm for 12 h, the precipitate was collected by a permanent magnet and cleaned by deionized water to remove the extra BHb and the unreacted monomers. The template proteins proceeded to be removed from the MMIPs using SDS-HAc aqueous (2%, 2%) as the eluent until the supernatant displayed no absorption at the detection wavelength of 406 nm. Then, the MMIPs were washed with deionized water to eliminate the residue eluent and then dried in vacuum. The NMIPs were prepared using the same procedures as described above except for the addition of the template protein BHb.262.4. Adsorption experiments of protein
The protein solution using phosphate buffer solution (PBS) as solvent was freshly prepared to determine the adsorption. The isothermal adsorption experiments were conducted by mixing 5 mg MMIPs and 2 mL BHb–PBS (0.02 M, pH 7) with different initial concentrations (0.2 mg mL−1, 0.4 mg mL−1, 0.6 mg mL−1, 0.8 mg mL−1, 1.0 mg mL−1, 1.2 mg mL−1, 1.4 mg mL−1, 1.6 mg mL−1, and 1.8 mg mL−1), stirred at 25 °C in a shaking bath at a speed of 150 rpm for 12 h. The supernatants before and after absorption were detected by a UV-vis spectrophotometer (UV-5300, Hitachi, Tokyo, Japan) at 406 nm for the concentration of BHb. The adsorption capacity (Q) of the protein to the MMIPs was calculated using the following formula:
 | (1) |
For the kinetics, 5 mg MMIPs and 2 mL BHb–PBS (0.02 M, pH 7) with an initial concentration of 1.0 mg mL−1 was mixed and stirred at 25 °C in a shaking bath at a speed of 150 rpm for different times (0.5 h, 1.0 h, 1.5 h, 2.0 h, 2.5 h, 3.0 h, 3.5 h, 4.0 h, 5.0 h, 6.0 h, 7.0 h, 8.0 h, 9.0 h, 10.0 h, 11.0 h, and 12.0 h).
To investigate the influence of pH on the adsorption capability, 5 mg MMIPs and 2 mL BHb (1 mg mL−1)–PBS (0.02 M) with different pH (5.4, 5.8, 6.2, 6.6, 7.0, 7.4, 7.8, and 8.2) was mixed and stirred at 25 °C in a shaking bath at a speed of 150 rpm for 12 h.
For the specific adsorption of MMIPs, 5 mg of both MMIPs and NMIPs were added into a 2 mL protein mixture of ovalbumin, bovine hemoglobin and bovine serum (concentration of 0.5 mg mL−1) for an oscillating adsorption experiment (12 h, PBS 0.02 M buffer solution). After 12 h, the supernatant was removed and used for SDS-PAGE electrophoresis experiments. After adsorption, both the MMIPs and NMIPs were eluted with 5 mL eluent (2% SDS) for 12 h and finally, the eluent was also used for SDS-PAGE electrophoresis experiments.
2.5. Characterization
The morphologies and structures of Fe3O4, MMIPs, and NMIPs were examined by TEM (JEM-1200EX, JEOL, Tokyo, Japan) operating at 120 kV. The chemical functionalities on the surface of the modified nanoparticles were determined with FT-IR (Nicolet iS10, Thermo Scientific Corporation Wisconsin, USA) over a range of 0–4000 cm−1. The components of the functional nanoparticles were investigated by TG analysis (Q50, TA Instruments, USA) with a heating rate of 20 °C min−1 from 30 °C to 800 °C. The PI of the nanoparticles was evaluated by a Zeta-sizer nano series (Nano-ZS, Malvern Instruments Ltd., UK) after the adjustment of pH with HCl (0.05 M) and NaOH (0.05 M).3. Results and discussion
3.1. Preparation of MMIPs
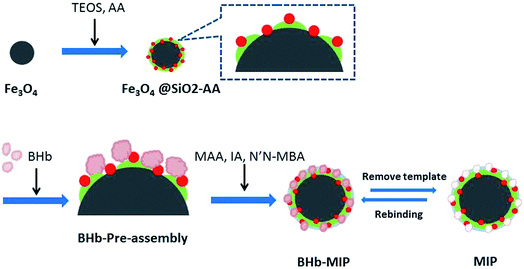
The synthesis route of MMIPs is illustrated in Scheme 1. Synthesized by chemical precipitation under high stir speed, the Fe3O4 particles are smaller with more special surface areas and magnetism. Accordingly, the naked Fe3O4 particles are easier to gather together by magnetic attraction. With the addition of TEOS, the O–Si–O groups were drawn onto the surface of the Fe3O4 particles and formed a silica shell to protect Fe3O4 from magnetic attraction and oxidation. The adoption of acrylic acid provides the vinyl groups and the carboxyl groups, which increase the amount of active groups on the surface of the particles and provide binding sites for the subsequent reaction.27 At the stage of BHb pre-assembly, the active groups of BHb such as –OH, –COOH and –NH2 combined with those of Fe3O4@SiO2-AA particles through hydrogen bonding, resulting in temporarily immobilization on the surface of Fe3O4@SiO2-AA. Using MAA and IA as functional monomers and N′,N-MBA as a crosslinker, the copolymerization occurred, forming the molecular imprinted polymers covering the surface of Fe3O4@SiO2-AA particles. After removing the template BHb in the polymers with eluent, the cavities were obtained in the polymers, which are complementary to the target proteins in morphological structure, size and functional group orientation.3.2. Characterization
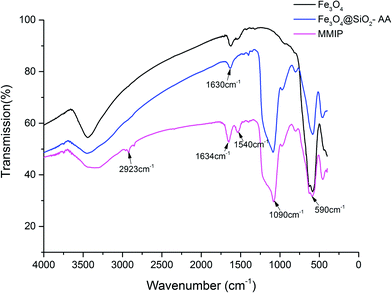
![[double bond, length as m-dash]](https://www.rsc.org/images/entities/char_e001.gif) O, suggesting that –C
O, suggesting that –C![[double bond, length as m-dash]](https://www.rsc.org/images/entities/char_e001.gif) O and –OH both existed on the MMIPs. The peak at 1540 cm−1 assigned to –NH2 and the peak at 2923 cm−1 attributed to C–H demonstrated the successful introduction and polymerization of the functional monomers and crosslinker.
O and –OH both existed on the MMIPs. The peak at 1540 cm−1 assigned to –NH2 and the peak at 2923 cm−1 attributed to C–H demonstrated the successful introduction and polymerization of the functional monomers and crosslinker.
3.2.2. TEM characterization
The size and morphological structure of naked Fe3O4, Fe3O4@SiO2-AA and MMIPs are illustrated in Fig. 2. The diameter of the Fe3O4 particles (Fig. 2A) was about 20 nm; the space between Fe3O4 particles was narrow. As shown in Fig. 2B, the diameter of MMIPs was supposed to be around 25 nm, which indicated that the molecular imprinted polymer coated on the MMIPs was sufficiently thin and suitable for the capture of BHb. As shown in Fig. 2, the MMIP (Fig. 2B) and NMIP (Fig. 2C) particles were more dispersive as compared to the Fe3O4 particles (Fig. 2A); thus, it can be concluded that the polymeric coating had appropriately shielded the magnetite and significantly reduced the aggregation of the particles.283.2.3. TGA analysis
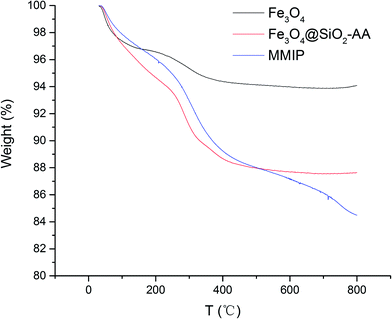
To analyze the components and the concentration of iron oxide in the functional nanoparticles, TGA analysis was performed; the resultant curves are illustrated in Fig. 3. When the temperature increased gradually from 30 to 250 °C, all of the Fe3O4, Fe3O4@SiO2-AA and MMIPs lost about 5.5% mass, which was caused by evaporation of water on the surface and the decomposition of some trace impurities. At the temperature range of 250–500 °C, the total weight loss increased to 12.3% of Fe3O4@SiO2-AA and MMIP, which indicated the loss of the silicone hydride group and acrylic acid group. In the temperature range of 500–800 °C, the curve of Fe3O4@SiO2-AA particles became stable, while the weight loss in this stage of MMIPs increased by 3.6%, suggesting the degradation of the molecular imprinted polymer on the MMIPs. As shown in Fig. 3, the magnetic content of MMIPs was about 84%, which was less than that of naked Fe3O4, but suitable for magnetic targeting and separation.253.2.4. Investigation on the PI of functional magnetic nanoparticles
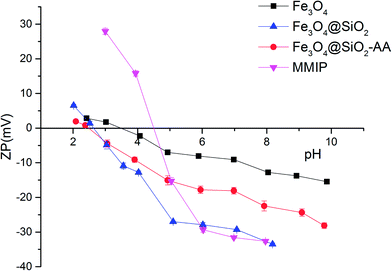
The changes in zeta potential of the different magnetic particles with the solution pH are shown in Fig. 4. When the zeta potential reached zero, the electrostatic charge of the magnetic particle surface was zero. At this point, the pH of the solution was the isoelectric point (PI) of the magnetic particle. As shown in Fig. 4, the PI of Fe3O4 was about 3.50. The PI of Fe3O4@SiO2 was about 2.50, while the PI of Fe3O4@SiO2-AA was about 2.75. This was because the silane modified on the surface of magnetic particles brought a large number of active –OH groups, while Fe3O4@SiO2-AA modified with acrylic acid introduced a certain amount of –COOH groups. The MMIPs formed by molecular imprinting had a PI of about 4.5, possibly because of the –NH2 provided by the crosslinker and partially due to the functional monomers. This also indirectly proved that the magnetic particles were successfully modified with functional groups and molecularly imprinted layers.3.3. Adsorption performance
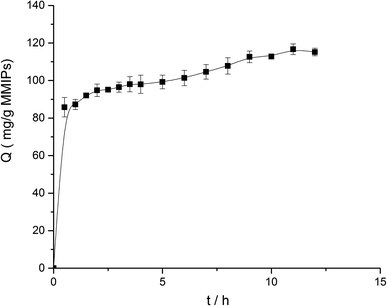
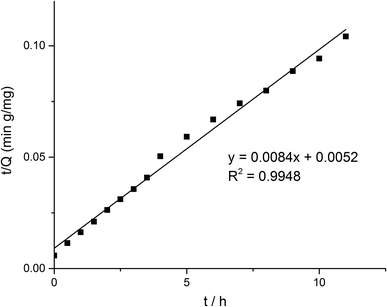
Some models were fitted to the variation of adsorption capacity with time. It was found that the adsorption process of MMIPs to BHb was more in line with the pseudo second-order kinetic model. The pseudo second-order kinetic formula can be expressed as follows:
 | (2) |
According to formula (2), the curve of t/Q versus time was obtained (Fig. 6). The fitting equation was y = 0.0084x + 0.0052. The correlation coefficient R2 was 0.9948, greater than 0.99, which indicated that the second-order kinetics is suitable for describing the adsorption process of MMIPs to BHb. From the fitted equation, the maximum adsorption capacity of MMIPs to BHb was 192.31 mg mL−1.
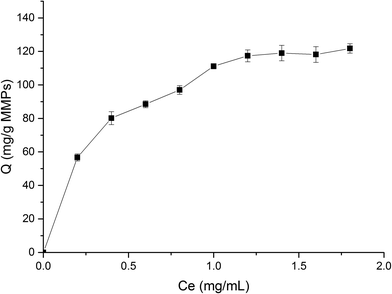
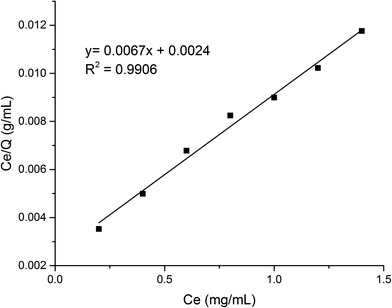
 | (3) |
As shown in Fig. 8, the fitting equation for the adsorption capability of MMIPs on BHb using Langmuir was y = 0.0067x + 0.0024; the maximum adsorption capacity of MMIPs on BHb was 149.25 mg mL−1 according to the equation, which was higher than that obtained by Gao et al.30 The correlation coefficient R2 obtained by fitting was 0.9906, which indicated that the adsorption process was well-described by the Langmuir adsorption model.
3.4. Reusability of MMIPs
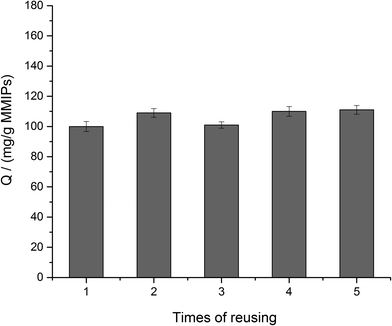
To investigate the reusability of MMIPs, the BHb absorbed on the MMIPs was eluted by a 2% SDS-HAc solution and then, the MMIPs were used to rebind the BHb several times repeatedly. Fig. 9 shows the high and stable adsorption of the MMIPs after five times of reuse, which reflected the favourable reusability of MMIPs.3.5. Effect of different pH on the adsorption of MMIPs
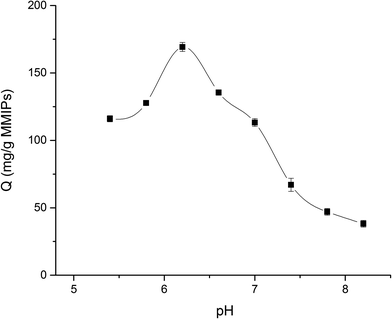
In this study, the equilibrium adsorption capacity of MMIPs on BHb was investigated at different pH at 25 °C (PBS buffer, 0.02 M). As shown in Fig. 10, when the pH of the BHb solution increased from 5.4 to 6.2, the adsorption capacity of MMIPs to BHb increased gradually. However, when the pH of the solution increased from 6.2 to 8.2, the adsorption of MMIPs to BHb decreased gradually. Therefore, the amount of BHb adsorbed by MMIPs reached a maximum of 169.29 mg g−1 at a solution pH of about 6.2. As previously concluded, the PI of MMIPs was about 4.5, while the PI of BHb was about 6.8. In the pH range of 4.5–6.8, increasing the pH gradually increases the negative charges on MMIPs, while the positive charges on BHb decreases gradually. Therefore, at a defined pH value the electrostatic adsorption between MMIPs and BHb reaches a maximum. This is why the MMIPs obtained a maximum adsorption capacity of BHb at pH 6.2. This also indicates that at a suitable pH value, the electrostatic interaction between MMIPs and BHb can promote the adsorption ability.3.6. Selective adsorption
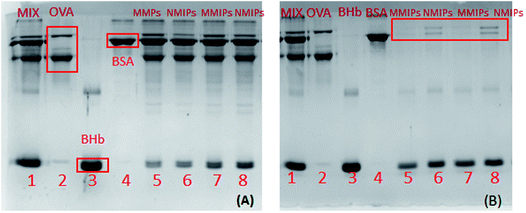
As shown in Fig. 11(A), in the protein mixture adsorbed by MMIPs, the color of the BHb band turned shallow, while there were no visible changes in the other protein bands (Lane 5 and 7 in Fig. 11A). Comparatively, in the mixed solution after adsorption by NMIPs, not only the band of BHb, but also the bands of OVA and BSA became shallow (Lane 6 and 8 in Fig. 11A). As shown in Fig. 11(B), in the solution of protein eluted from MMIPs, only the band of BHb can be observed (Lane 5 and 7 in Fig. 11B). For the eluent from NMIPs, all of the bands of BHb, OVA and BSA can be observed (Lane 6 and 8 in Fig. 11B). It can be adequately demonstrated that MMIPs can selectively adsorb the template protein. By comparison, the NMIPs, prepared by the same synthesis process as the MMIPs except for the imprinting of template protein, could not to achieve the specific adsorption of the template protein because of the lack of specific cavities that are complementary with the target protein.4. Conclusion
In this study, molecularly imprinted magnetic nanoparticles were prepared by using BHb as the template protein on the basis of core–shell functionalized nanoparticles modified with silyl and acrylate groups. The magnetic particles with small volume, large specific surface area, good dispersibility, and abundant cavities, complementary with template proteins in morphology, structure, size and binding groups, can achieve ample protein adsorption in short time with high specificity. In addition, MMIPs with high magnetic content can be rapidly separated from the solution under an applied magnetic field. Therefore, molecularly imprinted magnetic nanoparticles have significant effects and broad prospects in the isolation and enrichment of specific proteins in the food, medicine and biological research fields.Conflicts of interest
The authors declare that there are no conflicts of interest.Acknowledgements
This work was supported by the National Natural Science Foundation of China (No. 31501428) and the Jiangsu province “Collaborative Innovation Center for Food Safety and Quality Control” industry development program.References
- T. Y. Li, L. S. Fan, Y. F. Wang, X. B. Huang, J. G. Xu, J. X. Lu, M. Zhang and W. Xu, Anal. Chem., 2017, 89, 1453–1458 CrossRef CAS PubMed.
- Z. Altintas, M. J. Abdin, A. M. Tothill, K. Karim and I. E. Tothill, Anal. Chim. Acta, 2016, 935, 239–248 CrossRef CAS PubMed.
- S. A. Zaidi, RSC Adv., 2016, 6, 88807–88819 RSC.
- L. Mergola, S. Scorrano, R. Del Sole, M. R. Lazzoi and G. Vasapollo, Biosens. Bioelectron., 2013, 40, 336–341 CrossRef CAS PubMed.
- P. Lenain, J. D. Di Mavungu, P. Dubruel, J. Robbens and S. De Saeger, Anal. Chem., 2012, 84, 10411–10418 CrossRef CAS PubMed.
- R. J. Ansell and K. Mosbach, J. Chromatogr. A, 1997, 787, 55–66 CrossRef CAS.
- C. J. Tan, M. G. Chua, K. H. Ker and Y. W. Tong, Anal. Chem., 2008, 80, 683–692 CrossRef CAS PubMed.
- N. Sankarakumar and Y. W. Tong, RSC Adv., 2013, 3, 1519–1527 RSC.
- K. Hosoya, K. Yoshizako, N. Tanaka, K. Kimata, T. Araki and J. Haginaka, Chem. Lett., 1994, 1437–1438, DOI:10.1246/Cl.1994.1437.
- N. Phutthawong and M. Pattarawarapan, J. Appl. Polym. Sci., 2013, 128, 3893–3899 CrossRef CAS.
- W. M. Li, M. M. Chen, H. Y. Xiong, W. Wen, H. P. He, X. H. Zhang and S. F. Wang, New J. Chem., 2016, 40, 564–570 RSC.
- T. Zhu, D. Xu, Y. G. Wu, J. Li, M. M. Zhou, T. Tian, Y. Jiang, F. T. Li and G. T. Li, J. Mater. Chem. B, 2013, 1, 6449–6458 RSC.
- M. Zhang, X. H. Zhang, X. W. He, L. X. Chen and Y. K. Zhang, Nanoscale, 2012, 4, 3141–3147 RSC.
- J. L. Cao, X. H. Zhang, X. W. He, L. X. Chen and Y. K. Zhang, Chem.–Asian J., 2014, 9, 526–533 CrossRef CAS PubMed.
- X. D. Mao, H. Y. Sun, X. W. He, L. X. Chen and Y. K. Zhang, Anal. Methods, 2015, 7, 4708–4716 RSC.
- Y. R. Zhao, C. F. Bi, X. W. He, L. X. Chen and Y. K. Zhang, RSC Adv., 2015, 5, 70309–70318 RSC.
- D. E. Hansen, Biomaterials, 2007, 28, 4178–4191 CrossRef CAS PubMed.
- A. Bossi, F. Bonini, A. P. F. Turner and S. A. Piletsky, Biosens. Bioelectron., 2007, 22, 1131–1137 CrossRef CAS PubMed.
- T. Jing, H. R. Du, Q. Dai, H. A. Xia, J. W. Niu, Q. L. Hao, S. R. Mei and Y. K. Zhou, Biosens. Bioelectron., 2010, 26, 301–306 CrossRef CAS PubMed.
- L. Li, X. W. He, L. X. Chen and Y. K. Zhang, Sci. China, Ser. B: Chem., 2009, 52, 1402–1411 CrossRef CAS.
- L. Li, X. W. He, L. X. Chen and Y. K. Zhang, Chem.–Asian J., 2009, 4, 286–293 CrossRef CAS PubMed.
- J. Ashley, M. A. Shahbazi, K. Kant, V. A. Chidambara, A. Wolff, D. D. Bang and Y. Sun, Biosens. Bioelectron., 2017, 91, 606–615 CrossRef CAS PubMed.
- Y. B. Liu, S. M. Fang, J. Q. Zhai and M. P. Zhao, Nanoscale, 2015, 7, 7162–7167 RSC.
- Y. X. Li, Y. T. Chen, L. Huang, B. Y. Lou and G. N. Chen, Analyst, 2017, 142, 302–309 RSC.
- F. Liu, F. G. Niu, N. Peng, Y. J. Su and Y. J. Yang, RSC Adv., 2015, 5, 18128–18136 RSC.
- J. X. Guo, Y. Z. Wang, Y. J. Liu and Y. G. Zhou, Anal. Methods, 2015, 7, 10018–10025 RSC.
- X. Kong, R. Gao, X. He, L. Chen and Y. Zhang, J. Chromatogr. A, 2012, 1245, 8–16 CrossRef CAS PubMed.
- Y. F. Wang, H. X. Jin, Y. G. Wang, L. Y. Yang, X. K. OuYang and W. J. Wu, Molecules, 2016, 21, 915 CrossRef PubMed.
- G. Q. Fu, H. Y. He, Z. H. Chai, H. C. Chen, J. A. Kong, Y. Wang and Y. Z. Jiang, Anal. Chem., 2011, 83, 1431–1436 CrossRef CAS PubMed.
- R. X. Gao, L. L. Zhang, Y. Hao, X. H. Cui and Y. H. Tang, RSC Adv., 2014, 4, 64514–64524 RSC.
| This journal is © The Royal Society of Chemistry 2018 |

