 Open Access Article
Density functional theory calculations for evaluation of phosphorene as a potential anode material for magnesium batteries
Xinpeng Hana,
Cheng Liua,
Jie Sun *a,
Austin D. Sendek
 b and
Wensheng Yang
 c
c
aSchool of Chemical Engineering and Technology, Tianjin University, Tianjin, China. E-mail: jies@tju.edu.cn
bDepartment of Applied Physics, Stanford University, Stanford, California 94305, USA
cState Key Laboratory of Chemical Resource Engineering, Beijing University of Chemical Technology, Beijing 100029, P. R. China
First published on 13th February 2018
Abstract
We have systematically investigated black phosphorus and its derivative – a novel 2D nanomaterial, phosphorene – as an anode material for magnesium-ion batteries. We first performed Density Functional Theory (DFT) simulations to calculate the Mg adsorption energy, specific capacity, and diffusion barriers on monolayer phosphorene. Using these results, we evaluated the main trends in binding energy and voltage as a function of Mg concentration. Our studies revealed the following findings: (1) Mg bonds strongly with the phosphorus atoms and exists in the cationic state; (2) Mg diffusion on phosphorene is fast and anisotropic with an energy barrier of only 0.09 eV along the zigzag direction; (3) the theoretical specific capacity is 865 mA h g−1 with an average voltage of 0.833 V (vs. Mg/Mg2+), ideal for use as an anode. Given these results, we conclude that phosphorene is a very promising anode material for Mg-ion batteries. We then expand our simulations to the case of bulk black phosphorus, where we again find favorable binding energies. We also find that bulk black phosphorous must overcome a structural stress of 0.062 eV per atom due to a volumetric expansion of 33% during magnesiation. We found that the decrease in particle size is good to increase its specific capacity.
1. Introduction
As one of the most successful means for electrochemical energy storage, Li-ion batteries (LIBs) power most of the electronic devices used in today's information-rich mobile society.1 Recently, they have also been tested with success in hybrid, plug-in hybrid, and electric vehicles (EVs).2 Moreover, as the integration of intermittent renewable energy on the electrical grid increases, the demand for large-scale, inexpensive and efficient energy storage systems is increasing accordingly.3,4 However, LIBs are not ideal due to the high cost and scarcity of lithium. Sodium-ion batteries (SIBs)5–7 and magnesium-ion batteries (MIBs)8–11 have been proposed as potential alternatives for LIBs because of their low cost, large resources and availability, as shown in Table 1. While SIBs are attractive and are in fact already used for large-scale energy storage,12,13 their low gravimetric and volumetric capacities mean they are not suitable for the applications which require high energy density, such as electric vehicles and portable electronics. On the other hand, MIBs are currently emerging as a viable next generation rechargeable battery technology,9,10 with several companies in fact already working towards commercialization. MIBs have several advantages over LIBs and SIBs: (i) the divalent nature of the Mg ion results in the storage of up to two electrons per Mg atom versus only one for Li and Na, leading to a higher theoretical volumetric capacity, and a specific capacity comparable to those of Li; (ii) the atomic radius of Mg is smaller than Na and is comparable to Li, resulting in fast diffusion; and (iii) Mg can be electrodeposited rather smoothly without the dendrite formation problem14–19 that plagues metallic Li and Na.| Li | Na | Mg | |
|---|---|---|---|
| Ionic radius (pm) | 128 | 166 | 141 |
| Volumetric capacity (mA h cm−3) | 2062 | 1130 | 3832 |
| Gravimetric capacity (mA h g−1) | 3830 | 1165 | 2205 |
| Price ($ kg−1) | 1500 | 300 | 35 |
| Amount in Earth's crust | 0.0065% | 2.36% | 2.33% |
Most work on Mg batteries focuses on the development of cathode materials while simply using metallic Mg anodes.10,20,21 Despite this work, the cycling abilities of MIBs remain poor. Much of this poor performance is rooted in problems with the reaction of Mg metal with electrolyte species, resulting in the formation of a passivating surface film22,23 that inhibits any electrochemical reaction. In addition, electrode–electrolyte interactions also limit the achievable battery voltage.23 Thus, identifying superior anode materials to Mg metal is a critical step in improving MIBs. Even though phosphorus has been reported as attractive anode for LIBs24–28 and SIBs,29–34 the experimental and theoretical research has not focused on phosphorus as an anode for Mg-ion batteries.
When allowed to proceed to completion, phosphorus undergoes a conversion reaction with Mg to form Mg3P2, delivering a high theoretical specific capacity of 2596 mA h g−1 with a large volumetric expansion of 277%. As reported in experiments in LIBs and SIBs,25,29 the breaking of P–P bonds upon reaction with Mg is very exothermic and difficult to reverse, resulting in a huge irreversible capacity. To solve these problems, we can use layer-structure black phosphorus as anode and stop the reaction after intercalation, which does not require the breaking of P–P bonds and has minimal volumetric expansion, thus allowing longer life cycling.
Here, we report the theoretical studies of two new candidates for MIB anodes: bulk black phosphorus and monolayer phosphorene,35,36 which is exfoliated from black phosphorus. Although many important literatures about theoretical investigations of MIBs have been reported recently,37–39 the theoretical research has not focused on black phosphorus as an anode for MIBs. We use DFT to analyze Mg adsorption and diffusion in both of these materials. We find that bulk black phosphorus and monolayer phosphorene can store Mg atoms via insertion and adsorption with a binding energy of −1.366 eV and −0.716 eV, respectively, which is larger than the binding energy of the Mg2 dimer (−0.134 eV), indicating a strong interaction between Mg ion with phosphorene. The bulk and monolayer materials deliver a theoretical specific capacity of 433 and 865 mA h g−1, respectively. Moreover, we find Mg diffusion in phosphorene shows a strong directional anisotropy because of the puckered structure, with fast Mg diffusion along the zigzag direction. Furthermore, our results reveal that the Mg storage in phosphorene and black phosphorus has good stability. Due to these factors, and the large active surface area and space available for Mg diffusion, we conclude phosphorene is a promising candidate for Mg-ion battery anodes.
2. Computational details
First-principles calculations are performed within the density-functional theory (DFT) framework, as implemented in CASTEP package40,41 (in the Materials Studio version 5.5). The electron exchange and correlation interaction is described by the generalized gradient approximation (GGA) method using Perdew–Burke–Ernzerhof (PBE) pseudopotentials. The following valence electron configurations are used: P (3s23p3) and Mg (2s22p63s2). After checking for convergence, 500 eV was chosen as the cut-off energy of the plane-wave basis for the Kohn–Sham states. All atomic positions and lattice vectors were fully optimized using a conjugate gradient algorithm to obtain the unstrained configuration. Atomic relaxation was performed until the change of total energy was less than 0.01 meV and all the forces on each atom were smaller than 0.01 eV Å−1. For calculating the charge density difference between Mg atoms and phosphorene layer, the orbital calculations were performed in the DMol3 package.For the Mg adsorption and diffusion studies, we use a supercell containing 3 × 3 primitive cells of phosphorene, resulting in a Mg/P ratio of 0.028. We introduce a vacuum space of 25 Å between adjacent layers to avoid mirror interactions, and use 5 × 5 × 1 (monolayer phosphorene) and 5 × 5 × 5 (bulk black phosphorus) K-point meshes for the structure relaxation, denser meshes of 15 × 15 × 1 (monolayer) and 15 × 15 × 15 (bulk) for energy calculation, respectively. For Mg diffusion in phosphorene, we perform minimum energy path profiling using PBE method as implemented in the CASTEP transition state tools. The structural convergence criteria were similar to that used in the above-mentioned structure optimization.
3. Results and discussion
3.1. Adsorption of Mg on phosphorene surface
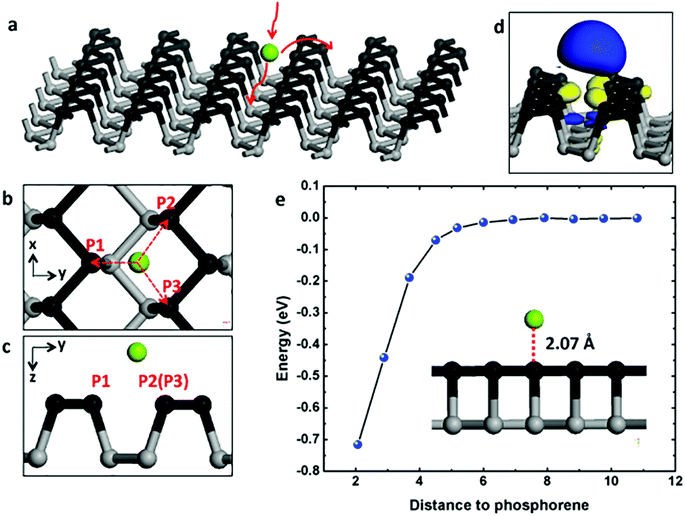
As illustrated in Fig. 1a, the Mg atoms are first loaded to phosphorene surface then diffuse along armchair or zigzag direction on the surface. As a consequence, we examine the surface loading (adsorption process) of an Mg atom on the phosphorene surface. We explore the phosphorene surface for Mg binding by placing one Mg atom at different sites above phosphorene before performing the structural relaxation and find that the most stable binding site is above the groove between two P “slifftops” as shown in Fig. 1b and c. Specifically, the distance between Mg and P1 atom is 2.731 Å, and the distances between Mg and the P2/P3 atoms is 2.881 Å. As an electrode material, it is essential for monolayer phosphorene to attract Mg with a relatively strong binding energy. The binding energy (Eb) can be evaluated with the following expression:| Eb = Etotal − EP − EMg | (1) |
The spatial distribution of the charge difference between Mg and phosphorene is illustrated in Fig. 1d. The large charge deficiency at Mg and charge excess around nearby P atoms indicates strong electron transfer from Mg to phosphorene. According to Bader charge population analysis, Mg possesses a unit positive charge with its 3s2 electron being completely transferred to phosphorene and thus exists in the cationic state. To test the distance dependence of the binding energy, we move the Mg atom vertically away from the phosphorene surface, with the separation distance to the phosphorene surface running from 2.07 Å (the most stable binding site) to about 1.1 nm. The change of binding energy with respect to the Mg–phosphorene surface distance is shown in Fig. 1e. For distances larger than 7 Å, the energy is effectively zero. This means that beyond 7 Å the total energy of the complex system does not change because Mg has no interactions with phosphorene; it essentially can be treated as an isolated Mg atom and an isolated phosphorene sheet. Within about 5 Å, however, the energy decreases dramatically, indicating a strong attractive interaction between Mg and P atoms. It is clear that there is no energy barrier in the Mg loading process.
3.2. Diffusion of Mg on phosphorene surface
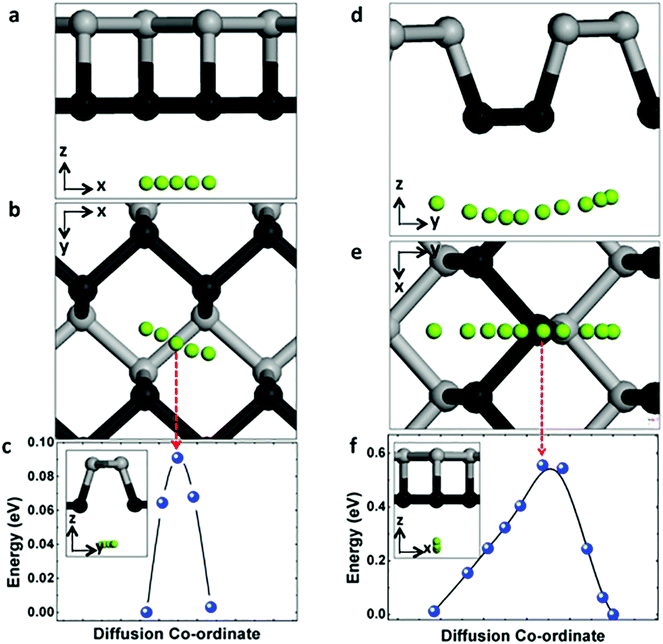
The charging and circuit rate performance of the MIBs is mainly determined by the Mg mobility on the electrode material. Hence it is desirable to quantify the diffusion of Mg on the surface of phosphorene. Distinct from the uniform sp2 hybridization of C atoms in graphene, phosphorene has a puckered structure with its atoms arranged in a honeycomb lattice when seen from the top view as shown in Fig. 1a–c. This structural anisotropy plays an important role in the migration of Mg atoms on its surface. Considering the symmetry of the primitive cell, there are only two unique (high-symmetry) paths connecting equilibrium sites. As illustrated in Fig. 2, these two diffusive pathways fall along the zigzag direction (Fig. 2a–c) and the armchair direction (Fig. 2d–f). Along the zigzag direction, the migration barrier is only 0.09 eV (in Fig. 2c), while for the armchair direction the barrier is 0.56 eV (in Fig. 2f). Thus Mg diffusion in phosphorene shows a strong directional anisotropy due to this puckered structure.Compared with the previous study of Sn anode for Mg ion insertion,42 the Mg diffusion barrier in α-Sn and β-Sn are 0.395 eV and 0.435 eV, respectively, which are much larger than the Mg diffusion barrier in phosphorene along the zigzag direction (0.09 eV). Another example, the Li diffusion barrier are 0.25 eV in MoS2 and 0.327 eV in graphene,43 respectively, which are much higher than 0.09 eV in phosphorene.
The temperature-dependent molecular transition rate can be evaluated by the Arrhenius equation from which the diffusion constant (D) of Mg follows:
 | (2) |
3.3. Theoretical capacity and voltage profile of magnesiation in phosphorene
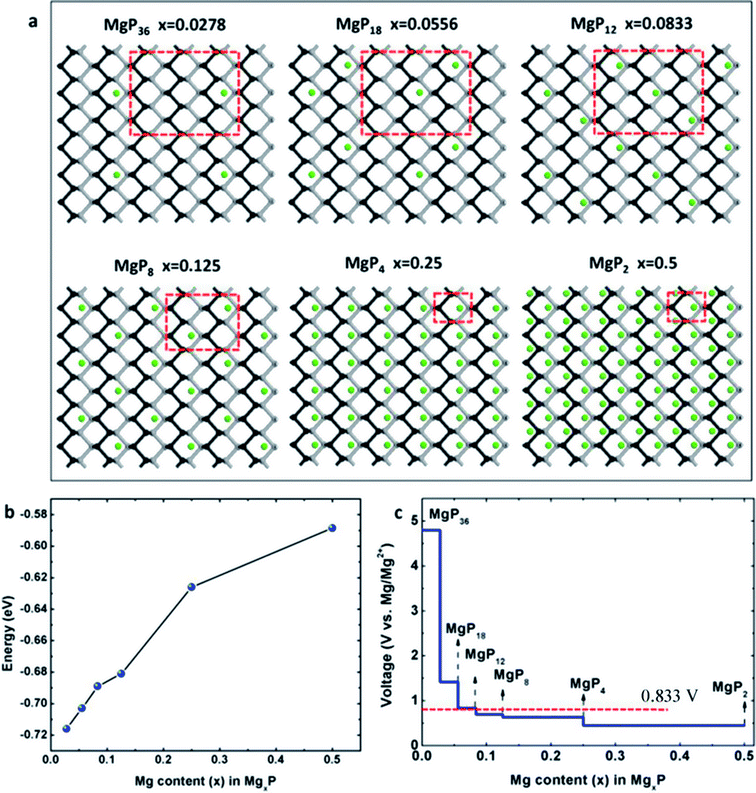
In this work, we consider a series of higher configurations with stoichiometry of MgxP (x = 0.0278, 0.0556, 0.0833, 0.125, 0.25 and 0.5), as shown in Fig. 3a, with one Mg atom binded on one side of a 3 × 3 supercell, two Mg atoms binded on one side of 3 × 3 supercell, three Mg atoms binded on one side of 3 × 3 supercell, two Mg atoms binded on one side of 2 × 2 supercell, one Mg atom binded on one side of 1 × 1 supercell, and two Mg atoms binded on the two sides of 1 × 1 supercell, respectively. We only consider Mg bonded on both sides of the phosphorene for the case of high Mg concentration, as we anticipate local electronic distortions fall of rapidly with distance and thus are unlikely to affect the total energy at low concentration – hence it should not matter what side of the layer the Mg is on. In the case of MgP2, the reason why we set up the Mg atoms on both sides of phosphorene instead of just one side is analyzed in Fig. 4. The binding energy of MgP2 with the Mg on two sides is −0.589 eV (Fig. 4c and d), slightly smaller than that of MgP36 (−0.716 eV). Compare this to a binding energy of 3.60 eV for MgP2 with the Mg on one side (Fig. 4a and b); this positive value indicates a very difficult reaction. This instability can be attributed to the pronounced electrostatic repulsive interactions between adjacent Mg cations, which have a separation distance of 1.781 Å, much shorter than that in Mg metal (3.197 Å). Thus, forcing higher concentrations of Mg insertion into phosphorene (i.e. more than one Mg atom on one side of the primitive cell, x > 0.5) will cause P–P bond breaking, disrupting the layered structure. As reported in the experiments in LIBs and SIBs,25,29 the breaking of P–P bonds cannot be rebuilt and hence the lithiation/delithiation or sodiation/desodiation process becomes irreversible. As a consequence, we limit our consideration to Mg concentrations for which x ≤ 0.5, equal to a capacity of 865 mA h g−1. The absolute value of the binding energy in MgxP decreases with increasing x. For all the concentrations (Fig. 3b), Mg has a binding energy lower than −0.59 eV. Notably, the slight discontinuity (from x = 0.0833 to 0.125) indicates that the complex becomes less stable due to the pronounced electrostatic repulsive interactions between adjacent Mg cations. This phenomenon also exists for lithiation44 and sodiation46 in phosphorene.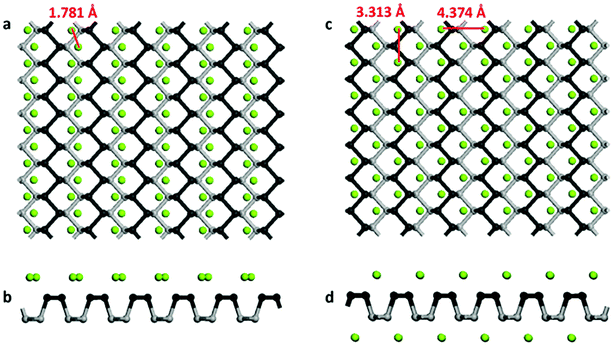 | ||
| Fig. 4 (a) Top and (b) side views of the schematics of MgP2 with Mg binded on one side; (c) top and (d) side views of the schematics of MgP2 with Mg binded on two side. | ||
Open-circuit-voltage data is widely used for characterizing the performance of batteries. In theory, the open circuit voltage curve can be obtained by calculating the average voltage over parts of the Mg composition domain. The average voltage of MgxP in the range of x1 ≤ x ≤ x2 is given as
 | (3) |
3.4. Theoretical capacity of magnesiation in black phosphorus
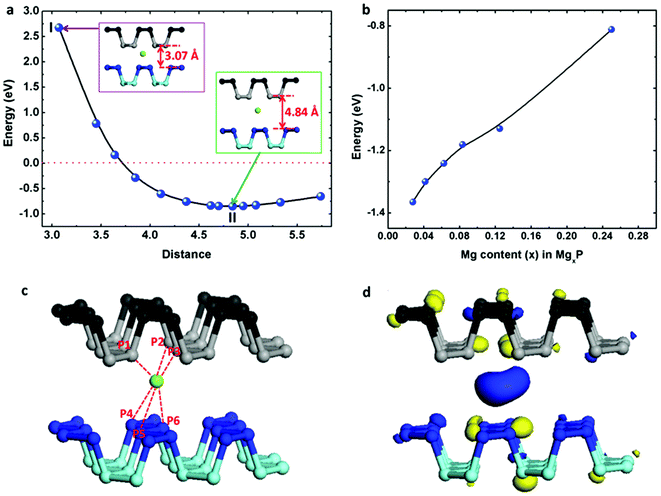
We have also loaded Mg atoms into the interlayers of bulk black phosphorus by placing one Mg atom at different sites before structural optimization and found that the most stable binding site is as shown in the insert (at II state) of Fig. 5a. We note that this site is close to the equilibrium monolayer site but displaced slightly. For the case of Mg insertion into the interlayers of black phosphorus, the binding energy (Eb) can be evaluated as following| Eb = Etotal − EP − EMg | (4) |
However, in reality the layers will expand to accommodate the Mg atom. Thus we optimize the distance between the two phosphorene layers symmetrically around the Mg atom, with the interlayer channel size running from 3 Å to 6 Å. The change of binding energy with respect to channel size is shown in Fig. 5a. As the channel increases, the binding energy drops dramatically. The weak binding seen for an interlayer channel size <4 Å indicates that the complex becomes less stable due to the pronounced electrostatic repulsive interactions between the positively charged Mg and the negatively charged phosphorene layer. The channel size of 4.84 Å has the most stable binding, corresponding to a 33% volumetric expansion compared to the original black phosphorus crystal. In this case, the binding energy of Mg inserted in bi-layered black phosphorus is −1.366 eV, slightly less than double the binding energy of the monolayer. As shown in Fig. 5c, the distance from the Mg atom to the surface of the top phosphorene layer P1 atom is 2.724 Å, and the distance to the P2/P3 atoms is 2.780 Å. The distance from Mg to the surface of the lower phosphorene layer P4/P5 atoms are 3.388 Å, and P6 is 2.736 Å. The spatial distribution of the charge difference between Mg and black phosphorus is illustrated in Fig. 5d. The large charge deficiency at Mg and charge excess around nearby P atoms indicate that, again, Mg exists in the cationic state. Additionally, we have studied the effect of Mg concentration in Fig. 5b. The absolute value of the binding energy in MgxP decreases with increasing x (0 < x < 0.25). For most of the concentrations, Mg has a binding energy lower than −0.8 eV. This indicates the final product of MgP4 is stable, contributing to a theoretical capacity of 433 mA h g−1.
In addition, we investigate the effect of black phosphorus particle size on Mg insertion. In the primitive cell, the volumetric expansion of 33% requires the crystal overcome a structural stress of 0.062 eV. If one Mg atom can insert in a black phosphorus nanoflake, the area (S) of the nanoflake was evaluated as following,
 | (5) |
4. Conclusions
To conclude, our results demonstrate that phosphorene and bulk black phosphorus can store Mg via adsorption and insertion while satisfying the crucial requirement of preserving the P–P bond. Phosphorene and bulk black phosphorus deliver high theoretical capacities of 865 mA h g−1 and 433 mA h g−1, respectively, which are double of that of LIBs and SIBs (Table 2). Due to its puckered structure, the diffusion of Mg on phosphorene is highly anisotropic with diffusion along the zigzag direction being highly energetically favorable, while diffusion along the armchair direction is essentially prohibited. The average voltage of the Mg adsorption in phosphorene is estimated to be 0.833 V, suitable for the application as anode in MIBs. We also find that Mg intercalation in bulk black phosphorus is accompanied by a volumetric expansion of 33%. To compensate for the stress of this volumetric expansion, decreasing the particle size can improve the Mg-storage performance.| Volumetric expansion | Theoretical specific capacity (mA h g−1) | |
|---|---|---|
| Small-size BP to MgP4 | 128% | 433 |
| Small-size BP to LiP4 | 120% | 216 |
| Small-size BP to NaP4 | 131% | 216 |
| Phosphorene to MgP2 | 290% | 865 |
| Phosphorene to LiP2 | 238% | 433 |
| Phosphorene to NaP2 | 310% | 433 |
Conflicts of interest
There are no conflicts to declare.Acknowledgements
We acknowledge the support by the U.S. Department of Energy, Office of Basic Energy Sciences, Materials Sciences and Engineering Division, under Contract DE-AC02-76-SFO0515. W. Y. acknowledges support from the National Natural Science Foundation of China under 51272020 and 21236003. H. W. L. acknowledges support from the Basic Science Research Program through the National Research Foundation of Korea (NRF) funded by the Ministry of Education, Science and Technology under NRF-2012R1A6A3A03038593.Notes and references
- R. V. Noorden, Nature, 2014, 507, 26–28 CrossRef PubMed.
- L. Lu, X. Han, J. Li, J. Hua and M. Ouyang, J. Power Sources, 2013, 226, 272–288 CrossRef CAS.
- J. Tarascon, Nat. Chem., 2010, 2, 510 CrossRef CAS PubMed.
- Z. Yang, J. Zhang, M. C. Kintner-Meyer, X. Lu, D. Choi, J. P. Lemmon and J. Liu, Chem. Rev., 2011, 111, 3577–3613 CrossRef CAS PubMed.
- S. W. Kim, D. H. Seo, X. Ma, G. Ceder and K. Kang, Adv. Energy Mater., 2012, 2, 710–721 CrossRef CAS.
- V. Palomares, P. Serras, I. Villaluenga, K. B. Hueso, J. Carretero-González and T. Rojo, Energy Environ. Sci., 2012, 5, 5884–5901 CAS.
- M. D. Slater, D. Kim, E. Lee and C. S. Johnson, Adv. Funct. Mater., 2013, 23, 947–958 CrossRef CAS.
- D. Aurbach, Z. Lu, A. Schechter and Y. Gofer, Nature, 2000, 407, 724 CrossRef CAS PubMed.
- D. Aurbach, Y. Gofer, Z. Lu, A. Schechter, O. Chusid, H. Gizbar, Y. Cohen, V. Ashkenazi, M. Moshkovich and R. Turgeman, J. Power Sources, 2001, 97, 28–32 CrossRef.
- P. Novák, R. Imhof and O. Haas, Electrochim. Acta, 1999, 45, 351–367 CrossRef.
- C. Pei, F. Xiong, J. Sheng, Y. Yin, S. Tan, D. Wang, C. Han, Q. An and L. Mai, ACS Appl. Mater. Interfaces, 2017, 9, 17060–17066 CAS.
- H. Pan, Y.-S. Hu and L. Chen, Energy Environ. Sci., 2013, 6, 2338–2360 CAS.
- B. Dunn, H. Kamath and J.-M. Tarascon, Science, 2011, 334, 928–935 CrossRef CAS PubMed.
- W. Xu, J. Wang, F. Ding, X. Chen, E. Nasybulin, Y. Zhang and J.-G. Zhang, Energy Environ. Sci., 2014, 7, 513–537 CAS.
- G. Zheng, S. W. Lee, Z. Liang, H.-W. Lee, K. Yan, H. Yao, H. Wang, W. Li, S. Chu and Y. Cui, Nat. Nanotechnol., 2014, 9, 618–623 CrossRef CAS PubMed.
- K. Yan, H.-W. Lee, T. Gao, G. Zheng, H. Yao, H. Wang, Z. Lu, Y. Zhou, Z. Liang and Z. Liu, Nano Lett., 2014, 14, 6016–6022 CrossRef CAS PubMed.
- N. Sa, T. L. Kinnibrugh, H. Wang, G. Sai Gautam, K. W. Chapman, J. T. Vaughey, B. Key, T. T. Fister, J. W. Freeland and D. L. Proffit, Chem. Mater., 2016, 28, 2962–2969 CrossRef CAS.
- N. Wu, Z. Z. Yang, H. R. Yao, Y. X. Yin, L. Gu and Y. G. Guo, Angew. Chem., Int. Ed., 2015, 54, 5757–5761 CrossRef CAS PubMed.
- L. Wang, K. Asheim, P. E. Vullum, A. M. Svensson and F. Vullum-Bruer, Chem. Mater., 2016, 28, 6459–6470 CrossRef CAS.
- J.-S. Kim, W.-S. Chang, R.-H. Kim, D.-Y. Kim, D.-W. Han, K.-H. Lee, S.-S. Lee and S.-G. Doo, J. Power Sources, 2015, 273, 210–215 CrossRef CAS.
- S. H. Lee, R. A. DiLeo, A. C. Marschilok, K. J. Takeuchi and E. S. Takeuchi, ECS Electrochem. Lett., 2014, 3, A87–A90 CrossRef CAS.
- S. Su, Z. Huang, Y. NuLi, F. Tuerxun, J. Yang and J. Wang, Chem. Commun., 2015, 51, 2641–2644 RSC.
- J. Muldoon, C. B. Bucur, A. G. Oliver, T. Sugimoto, M. Matsui, H. S. Kim, G. D. Allred, J. Zajicek and Y. Kotani, Energy Environ. Sci., 2012, 5, 5941–5950 CAS.
- Z. Yu, J. Song, M. L. Gordin, R. Yi, D. Tang and D. Wang, Adv. Sci., 2015, 2, 1400020 CrossRef PubMed.
- J. Sun, G. Zheng, H.-W. Lee, N. Liu, H. Wang, H. Yao, W. Yang and Y. Cui, Nano Lett., 2014, 14, 4573–4580 CrossRef CAS PubMed.
- C. M. Park and H. J. Sohn, Adv. Mater., 2007, 19, 2465–2468 CrossRef CAS.
- W.-C. Chang, K.-W. Tseng and H.-Y. Tuan, Nano Lett., 2017, 17, 1240–1247 CrossRef CAS PubMed.
- Z. Z. Luo, Y. Zhang, C. Zhang, H. T. Tan, Z. Li, A. Abutaha, X. L. Wu, Q. Xiong, K. A. Khor and K. Hippalgaonkar, Adv. Energy Mater., 2017, 7, 1601285 CrossRef.
- J. Song, Z. Yu, M. L. Gordin, S. Hu, R. Yi, D. Tang, T. Walter, M. Regula, D. Choi and X. Li, Nano Lett., 2014, 14, 6329–6335 CrossRef CAS PubMed.
- Y. Kim, Y. Park, A. Choi, N. S. Choi, J. Kim, J. Lee, J. H. Ryu, S. M. Oh and K. T. Lee, Adv. Mater., 2013, 25, 3045–3049 CrossRef CAS PubMed.
- W.-J. Li, S.-L. Chou, J.-Z. Wang, H.-K. Liu and S.-X. Dou, Nano Lett., 2013, 13, 5480–5484 CrossRef CAS PubMed.
- W. Li, S. Hu, X. Luo, Z. Li, X. Sun, M. Li, F. Liu and Y. Yu, Adv. Mater., 2017, 29, 1605820 CrossRef PubMed.
- J. Sun, H.-W. Lee, M. Pasta, H. Yuan, G. Zheng, Y. Sun, Y. Li and Y. Cui, Nat. Nanotechnol., 2015, 10, 980–985 CrossRef CAS PubMed.
- J. Sun, H.-W. Lee, M. Pasta, Y. Sun, W. Liu, Y. Li, H. R. Lee, N. Liu and Y. Cui, Energy Storage Mater., 2016, 4, 130–136 CrossRef.
- E. S. Reich, Nature, 2014, 506, 19 CrossRef PubMed.
- H. O. Churchill and P. Jarillo-Herrero, Nat. Nanotechnol., 2014, 9, 330–331 CrossRef CAS PubMed.
- L. D. Chen, J. K. Nørskov and A. C. Luntz, J. Phys. Chem. C, 2015, 119, 19660–19667 CAS.
- L. F. Wan and D. Prendergast, J. Phys. Chem. C, 2018, 122, 398–405 CAS.
- P. Canepa, S.-H. Bo, G. S. Gautam, B. Key, W. D. Richards, T. Shi, Y. Tian, Y. Wang, J. Li and G. Ceder, Nat. Commun., 2017, 8, 1759 CrossRef PubMed.
- C. Zhang, M. Shao, F. Ning, S. Xu, Z. Li, M. Wei, D. G. Evans and X. Duan, Nano Energy, 2015, 12, 231–239 CrossRef CAS.
- S.-T. Zhang, H. Yan, M. Wei, D. G. Evans and X. Duan, J. Phys. Chem. C, 2012, 116, 3421–3431 CAS.
- Z. Wang, Q. Su, J. Shi, H. Deng, G. Q. Yin, J. Guan, M. P. Wu, Y. L. Zhou, H. L. Lou and Y. Q. Fu, ACS Appl. Mater. Interfaces, 2014, 6, 6786–6789 CAS.
- C. Zhang, M. Yu, G. Anderson, R. R. Dharmasena and G. Sumanasekera, Nanotechnology, 2017, 28, 075401 CrossRef PubMed.
- W. Li, Y. Yang, G. Zhang and Y.-W. Zhang, Nano Lett., 2015, 15, 1691–1697 CrossRef CAS PubMed.
- O. I. Malyi, T. L. Tan and S. Manzhos, J. Power Sources, 2013, 233, 341–345 CrossRef CAS.
- K. Hembram, H. Jung, B. C. Yeo, S. J. Pai, S. Kim, K.-R. Lee and S. S. Han, J. Phys. Chem. C, 2015, 119, 15041–15046 CAS.
| This journal is © The Royal Society of Chemistry 2018 |

