
 Open Access Article
 This Open Access Article is licensed under a
 Creative Commons Attribution 3.0 Unported Licence
The promotion effect of manganese on Cu/SAPO for selective catalytic reduction of NOx with NH3
Chengkai Pang ,
Yuqun Zhuo*,
Qiyu Weng and
Zhenwu Zhu
,
Yuqun Zhuo*,
Qiyu Weng and
Zhenwu Zhu
Key Laboratory for Thermal Science and Power Engineering of Ministry of Education, Beijing Engineering Research Center for Ecological Restoration and Carbon Fixation of Saline-alkaline and Desert Land, Department of Thermal Engineering, Tsinghua University, Beijing 100084, China. E-mail: zhuoyq@tsinghua.edu.cn
First published on 6th February 2018
Abstract
The activity and hydrothermal stability of Cu/SAPO and xMn–2Cu/SAPO for low-temperature selective catalytic reduction of NOx with ammonia were investigated. An ion-exchanged method was employed to synthesize xMn–2Cu/SAPO, which was characterized by N2 adsorption, ICP-AES, X-ray diffraction (XRD), NH3-temperature programmed desorption (NH3-TPD), NO oxidation, X-ray photoelectron spectrum (XPS), UV-vis, H2-temperature programmed reduction (H2-TPR) and diffuse reflectance infrared Fourier transform spectra (DRIFTS). 2Mn–2Cu/SAPO and 4Mn–2Cu/SAPO showed the best SCR activity, in that at 150 °C NO conversion reached 76% and N2 selectivity was above 95% for the samples. NO oxidation results showed that the 2Mn–2Cu/SAPO had the best NO oxidation activity and the BET surface area decreased as manganese loading increased. XRD results showed that the metal species was well dispersed. NH3-TPD showed that the acid sites have no significant influence on the SCR activity of xMn–2Cu/SAPO. H2-TPR patterns showed good redox capacity for xMn–2Cu/SAPO. UV-vis and H2-TPR showed that the ratio of Mn4+ to Mn3+ increased as manganese loading increased. XPS spectra showed a significant amount of Mn3+ and Mn4+ species on the surface and addition of manganese increased the ratio of Cu2+. The promotion effect of manganese to 2Cu/SAPO comes from the generation of Mn3+ and Mn4+ species. Deduced from the DRIFTS spectra, the Elay–Rideal mechanism was effective on 4Mn–2Cu/SAPO.
1 Introduction
NOx consists of NO, NO2, N2O and their related derivatives, which can lead to numerous environmental and health hazards.1 By forming nitric acid, NOx can lead to the generation of acid rain; by forming ammonium nitrate, it can accelerate the generation of PM2.5; by reacting with hydrocarbons under sunlight, it can cause the generation of photo chemical smog and ozone; by infiltrating into lungs, it can result in respiratory morbidity, like impaired host defense and lung inflammation. Thus, legislations on NOx emission are now becoming more and more stringent. In China, according to the emission standard of air pollutants for thermal power plants (GB 13223-2011), the NOx emission limit is 100 mg m−3 for new natural gas-fired industrial boilers and all oil and coal-fired industrial boilers. For compression ignition and gas fueled positive ignition engines of vehicles, the NOx emission limit in Chinese National 5 standards is 57% of that in Chinese National 4 standards and 40% of that in Chinese National 3 standards.The treatment of environmentally harmful NOx compounds emitted from mobile or stationary sources remains a challenging task, especially for industrial applications such as cement plants or iron and steel plants, because the suitable process temperature for NOx abatement is usually around 150 °C, under which commercial SCR catalysts V2O5–MoO3 (WO3)/TiO2 cannot work well.
Manganese oxides were reported by Smirniotis et al. as potential catalysts for low-temperature NH3-SCR reactions.2–5 They studied the promoted manganese oxides supported on TiO2 systematically3–5 and found that the surface Mn4+ species was reported to be highly active for the SCR of NO reaction with ammonia at low temperatures.
Recently, copper modified zeolites with a CHA structure attracted much attention owing to their excellent activity, N2 selectivity and hydrothermal stability for low temperature NH3-SCR reaction.6–8
However for the Cu/SAPO-34 catalyst, the oxygen activation of transiently formed Cu pairs [CuI(NH3)2] to [(NH3)2CuII-O2-CuII(NH3)2] was rate-limiting in the catalytic cycle.8 Feng Gao9 also thought that the oxidation reaction of Cu+ to Cu2+ was the rate-determine step, so tuning the redox properties of the active site by introducing a second cation might be a promising approach. Li et al.10 and Chen et al.11 modified the Cu/SAPO catalyst with CeOx for SCR reaction; they found that the introduction of CeOx increased the SCR activity at high temperatures and cerium helped increase the amount of isolated Cu2+ ions.
Leistner et al.12 found that Cu in Cu/SAPO-34 was more easily reduced compared to Cu/SSZ-13, which could facilitate the redox processes and increase the SCR activity. Ma et al.13 also found that Cu-SAPO-34 showed higher DeNOx catalytic activity than Cu-SSZ-13. The usage of SAPO-34 in low-temperature SCR might be favored in low temperature SCR reactions. When manganese is introduced into the Cu/SAPO system, it not only promotes the oxidation reaction of Cu+, but also acts as an active site for low temperature SCR reaction. Thus the manganese modified Cu/SAPO-34 catalyst would probably show better SCR activity.
In this work, the treatment of exhaust from a gas-fired boiler which contains a high concentration of H2O and a very low concentration of SO2 was focused upon. xMn–Cu/SAPO catalysts with different manganese loadings were prepared and their performance in SCR reaction was discussed. Various characterization methods (XRD, XPS, H2-TPR, UV-vis) were used to probe the promotion effect of manganese on Cu/SAPO for low temperature SCR reaction.
2 Experimental
2.1 Catalyst preparation
xMn–2Cu/SAPO catalysts were prepared by an ion-exchange method. The alkali metals in commercial Na/SAPO-34 powder (Jiangsu XFNANO) would decrease SCR activities, so it was transformed to H+/SAPO as follows. Na/SAPO-34 powder was ion exchanged using 11% wt NH4NO3 (Aladdin, >98.5%) solution whose pH value was adjusted to 3.0–4.0 by 2 M ammonium hydroxide (Aladdin, 25–28%) solution at 80 °C for 4 h. It was then filtered and washed with distilled water three times. Finally, it was dried at 110 °C for 16 h and calcined at 550 °C for 3 h.xMn–2Cu/SAPO (x = 0, 1, 2, 4, 8) was prepared in two steps. Firstly, H+/SAPO was mixed with Cu(NO3)2 (across, >95%) solution at 80 °C for 6 h under vigorous stirring. Then it was dried and calcined at 550 °C for 3 h. In the second step, it was mixed with Mn(NO3)2 (across, >95%) solution at 80 °C for 6 h under vigorous stirring, and at last it was dried and calcined at 550 °C for 3 h.
2.2 SCR activity measurements
Catalytic activity evaluation was carried out using a flow-through powder reactor system equipped with a Fourier transform infrared (FT-IR) spectrometer (THERMO SCIENTIFIC IGS). In order to prevent condensation along upstream tubing, all the gas lines were heated and maintained at 120 °C. The gas mixture was 500 ppm NO + 500 ppm NH3 + 3% vol O2 balanced with N2. The gas hourly space velocity (GHSV) was 65![[thin space (1/6-em)]](https://www.rsc.org/images/entities/char_2009.gif) 000 h−1 for the standard SCR reaction. Prior to each activity measurement, the catalysts were pretreated at 500 °C for 30 min with 21% vol O2/N2 flow. Catalytic activities were measured in the temperature range of 120 to 210 °C. The typical time to achieve the steady state was 2.5 h. NO conversion, promotion effect, and (Ep) and N2 selectivity were calculated at steady state using the equation below:
000 h−1 for the standard SCR reaction. Prior to each activity measurement, the catalysts were pretreated at 500 °C for 30 min with 21% vol O2/N2 flow. Catalytic activities were measured in the temperature range of 120 to 210 °C. The typical time to achieve the steady state was 2.5 h. NO conversion, promotion effect, and (Ep) and N2 selectivity were calculated at steady state using the equation below:
 | (1) |
| Ep = (XxMn–2Cu/SAPO − X2Cu/SAPO) × 100% | (2) |
 | (3) |
2.3 Characterization
X-ray diffraction patterns were collected on a bruker D8 Advance X-ray diffractometer with a Ni-Filtered Cu Kα with a step size of 0.02 in the 2θ range of 5° to 40°.Ammonia temperature programmed desorption (NH3-TPD) experiments were carried out as follows. 150 mg sample was first pretreated in 21% vol O2/N2 at 500 °C for 30 min and then cooled to 100 °C in N2 and a total flow of 100 ml min−1 containing 2500 ppm NH3 in N2 was injected into the reactor for 2 hours to achieve a steady state. Once the catalyst was saturated, NH3 was switched off and the catalyst was swept by N2 overnight. Finally, the catalyst was heated in N2 at a temperature ramp to 700 °C with a heating rate of 10 °C min−1.
NO oxidation experiments were carried out as follows. 150 mg sample was first pretreated in 21% vol O2/N2 at 500 °C for 30 min and then cooled to 210 °C in N2. Then a total flow of 100 ml min−1 containing 500 ppm NO and 3% vol O2 was injected into the reactor for 30 min to achieve the steady state.
The contents of the elements were determined by ion coupled plasma (ICP) optical emission spectroscopy (Thermo IRIS Intrepid II) after microwave digestion.
The BET surface area, pore volume and pore size of the catalyst samples were measured by N2 adsorption using the MICROMERITICS ASAP 2020 surface area and porosity analyzer.
Diffuse reflectance UV-vis spectra were recorded in the range of 200–800 nm against a BaSO4 as a reference standard on a HitachiU-3900 UV-vis spectrophotometer equipped with an integration sphere.
H2-TPR experiments were performed using 20 mg sample as follows. The catalysts were first pretreated at 500 °C for 30 min in a highly pure O2 (40 ml min−1) stream. Then the furnace temperature was decreased to room temperature, and feed containing 5% vol H2 in N2 was fed at a flow rate of 40 ml min−1. H2-TPR runs were performed as the temperature increased from room temperature to 800 °C at a linear heating rate of 10 °C min−1 and then the temperature was kept constant for 30 min at 800 °C to ensure complete reduction. Hydrogen was measured by TCD.
X-ray photoelectron spectroscopy (XPS) analyses were performed using PHI quantera SXM Scanning ESCA Microprobe (Physical Electronics) with a hemispherical detector operating at a constant pass energy (PE = 55 eV). An X-ray source at 210 W (I = 15 mA, U = 14 kV) and Al Kα radiation (1486.6 eV) were used. Intensities were estimated from the integration of each peak, after smoothening, subtracting the L-shaped background, and fitting the experimental curve to a combination of Lorentzian and Gaussian lines of variable proportions. All binding energies were referenced to the C 1s line at 284.8 eV.
Diffuse reflectance infrared Fourier transform spectra (DRIFTS) were measured on an FT-IR spectrometer (Thermo Nicolet NEXUS870) with an MCT detector and high temperature reaction chamber (Harrick Scientific Praying Mantis) with ZnSe Windows, which was connected to a gas-dosing system. The powder sample was placed in a sample cup and heated by a cartridge heater underneath the sample. The temperature was adjusted using a K-type thermocouple connected to a Harrick temperature controller. Before each measurement, oxidation pretreatments were executed at 500 °C for 1 h. Background spectra were collected before adsorption for 32 scans with a resolution of 4 cm−1 in N2. DRIFTS spectra were recorded in the range of 4000–650 cm−1 for 32 scans with a resolution of 4 cm−1.
3 Results and discussion
3.1 Low temperature NH3-SCR activity and N2 selectivity
Fig. 1a shows the NO conversion of xMn–2Cu/SAPO. There was not much difference in the catalytic activity between 2Cu/SAPO and 1Mn–2Cu/SAPO, 2Mn–2Cu/SAPO and 4Mn–2Cu/SAPO. The activity of 8Mn–2Cu/SAPO was slightly lower than the activity of 2Mn–2Cu/SAPO. As manganese loading increased from 1% to 2%, the activity increased obviously and the SCR activity of 2Mn–2Cu/SAPO, 4Mn–2Cu/SAPO and 8Mn–2Cu/SAPO was much higher than that of 2Cu/SAPO and 1Mn–2Cu/SAPO.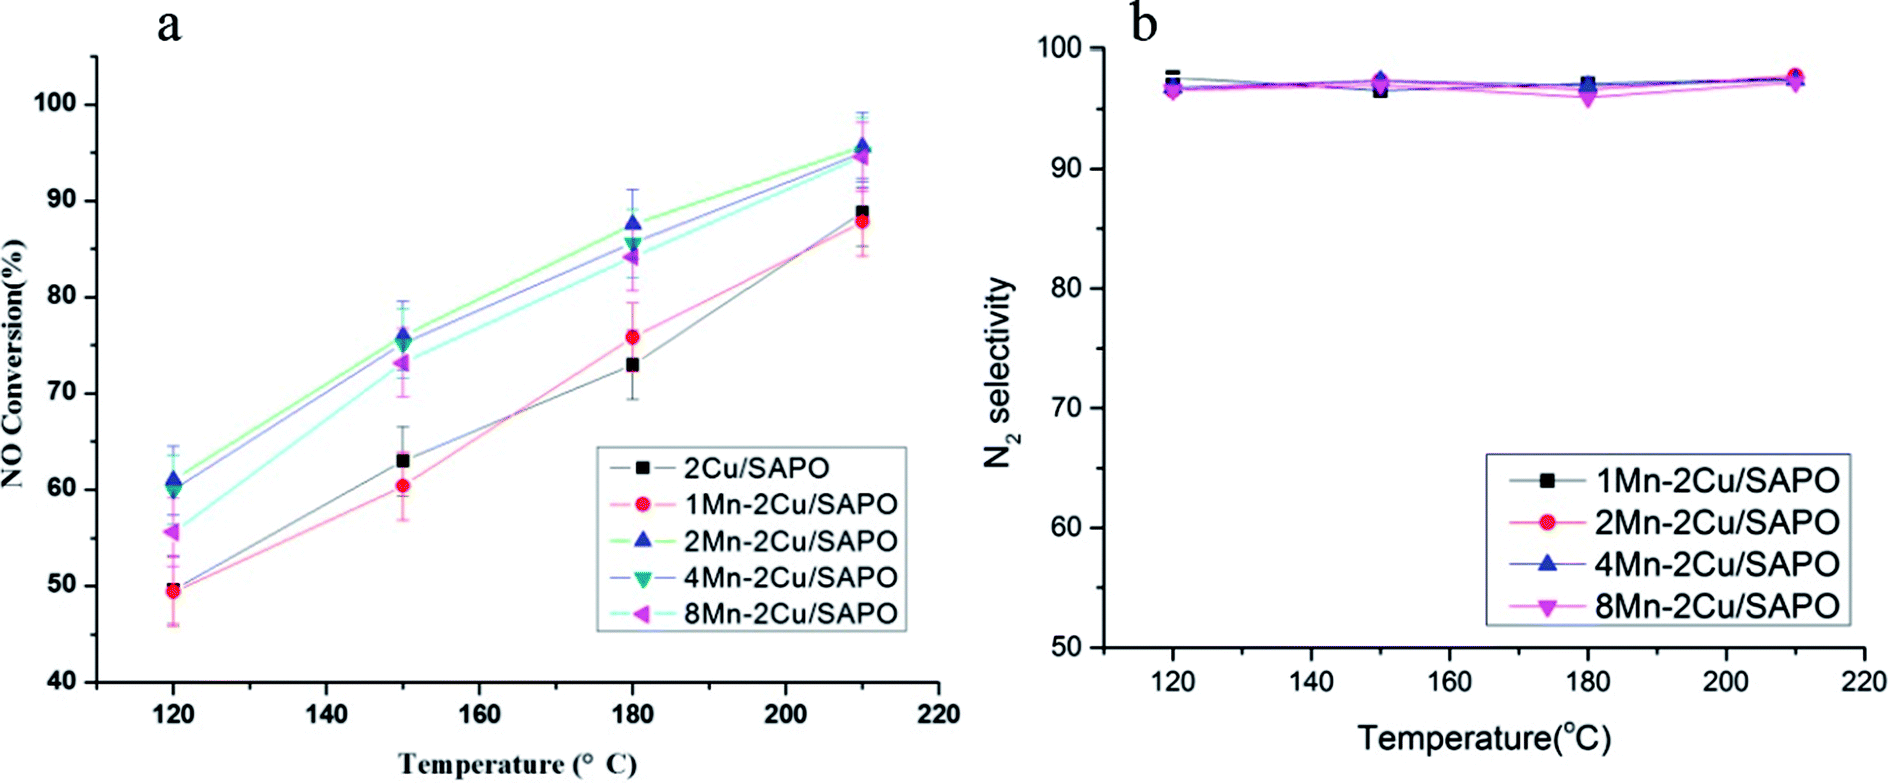 | ||
| Fig. 1 (a) Catalytic activity and (b) N2 selectivity of xMn–2Cu/SAPO. Conditions: 500 ppm NO + 500 ppm NH3 + 3% vol O2 + N2 balance, GHSV = 65000 h−1. | ||
For 2Mn–2Cu/SAPO and 4Mn–2Cu/SAPO, the conversion of NO at 120 °C was about 60%; as the temperature increased to 210 °C, the conversion reached 95%.
Fig. 1b shows the N2 selectivity of xMn–2Cu/SAPO. Good N2 selectivity was observed, being above 95% for all catalysts. Other researchers10,11 also found good N2 selectivity for the supported SAPO-34 catalysts.
Compared with xMn/SAPO (x = 1, 2, 4, 8), the previously prepared,14 xMn–2Cu/SAPO showed better SCR activities, especially for 2MN–2Cu/SAPO, indicating that the interactions between copper and manganese might increase its SCR activity.
3.2 Water resistance test
Fig. 2 shows the water resistance test of xMn–2Cu/SAPO. The poison effect of water might come from the reversible adsorption of H2O15 or irreversible dealumination process of zeolite.16 | ||
| Fig. 2 Water resistance test of xMn–2Cu/SAPO for low-temperature SCR. Conditions: 500 ppm NO + 500 ppm NH3 + 16.3% H2O + 3% vol O2 + N2 balance, GHSV = 65000 h−1. | ||
In Fig. 2, all catalysts showed strong resistance to water at high temperature. It could be caused by the lower adsorption capability of water at high temperature, since SAPO-34 was highly hydrothermally stable16 and the poison effect might originate from the competitive adsorption of water with ammonia.
3.3 NO oxidation activity and promotion effect
Fig. 3 showed the NO oxidation activity of xMn–2Cu/SAPO and the promotion effect. 2Mn–2Cu/SAPO had the best NO oxidation activity, indicating the interaction between copper and manganese elements, which accelerated the NO oxidation process. Good oxidation activity would certainly help the oxidation of Cu+ to Cu2+ in SCR reaction. The Ep profile was almost the same as the NO conversion profile, indicating that the increase in NO oxidation activity would promote the low-temperature SCR activity. Compared with the xMn/SAPO (x = 1, 2, 4, 8) previously prepared,14 the NO oxidation activities of xMn–2Cu/SAPO were much higher, which could be one reason for the increased SCR activity.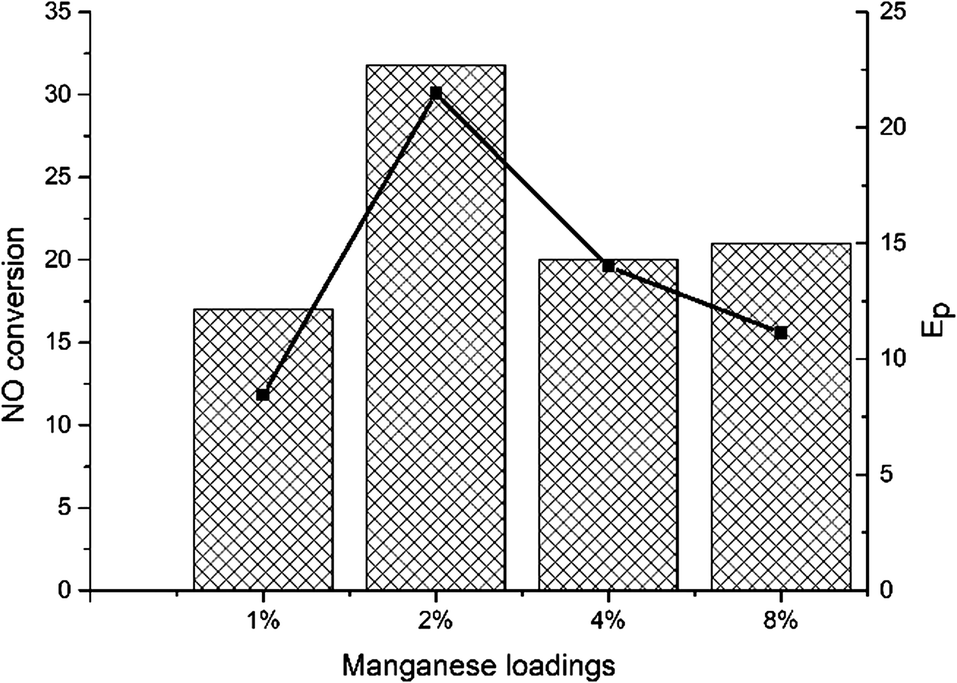 | ||
| Fig. 3 NO oxidation activity and promotion effect of manganese. | ||
3.4 Physicochemical properties
As showed in Table 1, the BET surface area and micro pore volume decreased gradually as manganese loading increased; the surface areas of 2Mn–2Cu/SAPO, 4Mn–2Cu/SAPO and 8Mn–2Cu/SAPO were similar. xMn/SAPO (x = 1, 2, 4, 8) previously prepared14 showed the same trend: the surface area and pore volume decreased as manganese loading increased.| Sample | BET surface area (m2 g−1) | Micro pore volume (cm3 g−1) | Micro pore width (nm) | Mn loadinga (wt%) | Cu loadinga (wt%) | Mn/Cu molar ratioa | Mn/Cu molar ratiob |
|---|---|---|---|---|---|---|---|
| a Determined by ICP.b Determined by XPS. | |||||||
| 2Cu/SAPO | 467 | 0.231 | 2.36 | 1.951 | |||
| 1Mn–2Cu/SAPO | 459 | 0.230 | 1.90 | 1.054 | 2.016 | 0.51 | 1.587 |
| 2Mn–2Cu/SAPO | 430 | 0.228 | 2.53 | 2.108 | 1.998 | 1.055 | 2.594 |
| 4Mn–2Cu/SAPO | 426 | 0.206 | 1.96 | 3.846 | 2.048 | 1.878 | 3.424 |
| 8Mn–2Cu/SAPO | 424 | 0.196 | 2.54 | 8.306 | 1.848 | 4.495 | 9.104 |
The manganese loading, copper loading and Mn/Cu molar ratio from ICP result were almost the same as the set values. Meanwhile the Mn/Cu molar ratio from the XPS results was quite different from that of ICP results. Since XPS and ICP reflect the elemental information of the surface phase and the bulk phase respectively, the difference might come from the enrichment of manganese on surface.
3.5 XRD
XRD patterns of xMn–2Cu/SAPO are depicted in Fig. 4. The diffraction peaks of chabazite phase with the space group of R![[3 with combining macron]](https://www.rsc.org/images/entities/char_0033_0304.gif) m were identified, indicating that the crystalline structure of SAPO-34 remained unchanged after catalyst preparation. When manganese loading increased from 0 to 4%, only the chabazite phase was detectable, indicating that the manganese species were well dispersed. As manganese loading reached 8%, the diffraction peaks of the Mn2O3 phase appeared, indicating the aggregation of manganese species and decreased manganese dispersity. On xMn/SAPO (x = 1, 2, 4, 8), which was previously prepared,14 there too were no peaks attributed to manganese oxides until manganese loading increased to 8%.
m were identified, indicating that the crystalline structure of SAPO-34 remained unchanged after catalyst preparation. When manganese loading increased from 0 to 4%, only the chabazite phase was detectable, indicating that the manganese species were well dispersed. As manganese loading reached 8%, the diffraction peaks of the Mn2O3 phase appeared, indicating the aggregation of manganese species and decreased manganese dispersity. On xMn/SAPO (x = 1, 2, 4, 8), which was previously prepared,14 there too were no peaks attributed to manganese oxides until manganese loading increased to 8%.
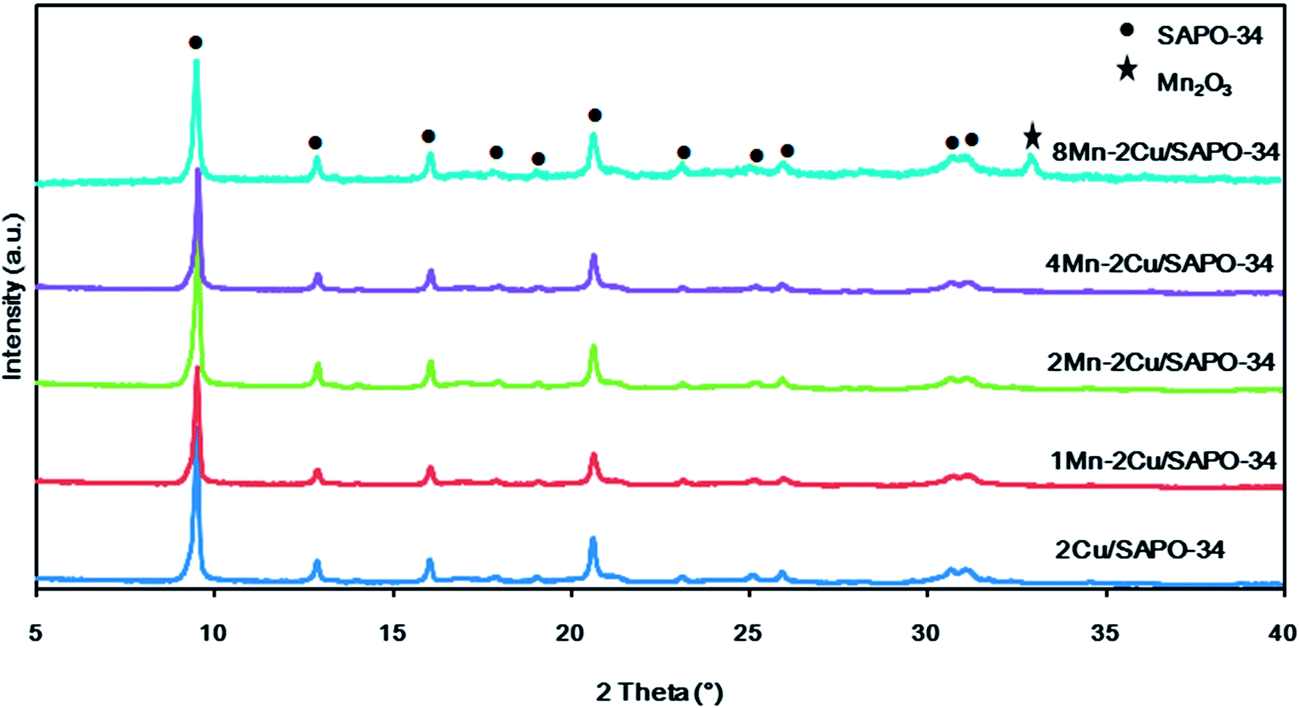 | ||
| Fig. 4 XRD patterns of xMn–2Cu/SAPO. | ||
3.6 NH3-TPD
Fig. 5 showed the effluent NH3 profiles during the NH3-TPD process. The amount of NH3 desorption was closely related to the amount of acid sites. As expected, when manganese loading increased, the amount of NH3 desorption decreased, which was caused by the replacement of H+ in the framework of SAPO by Mnx+ in the ion exchange process.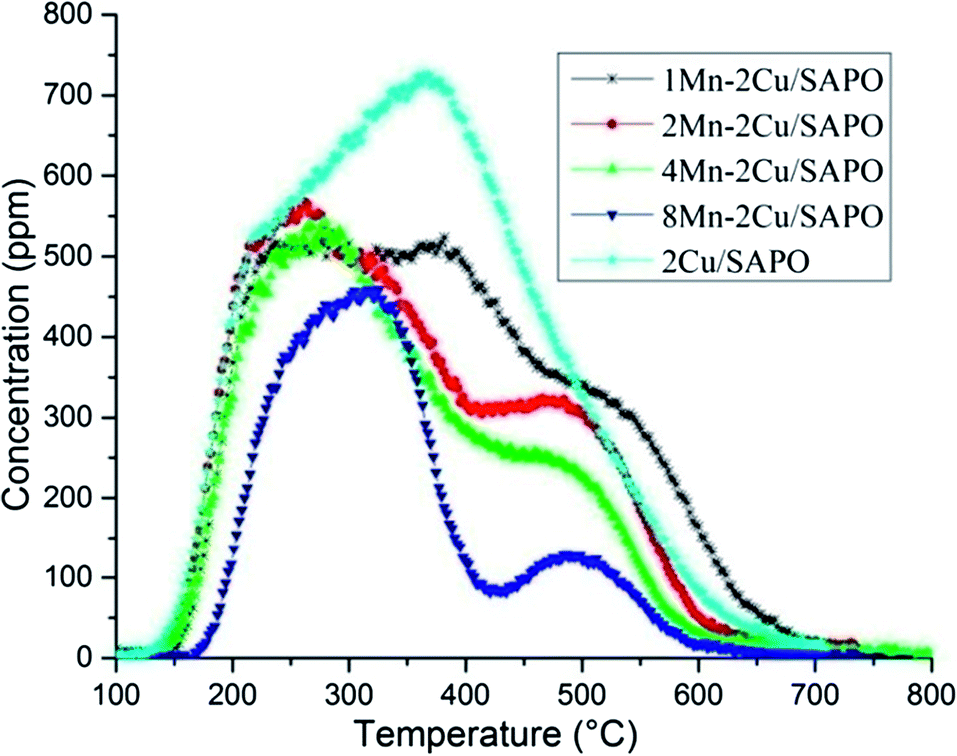 | ||
| Fig. 5 NH3-TPD of xMn–2Cu/SAPO. | ||
In Fig. 5 there are three NH3 desorption peaks, i.e. a low temperature peak at 250 °C, a middle temperature peak at 400 °C and a high temperature peak at 500 °C, which could be assigned to the weak acid site, the middle strong acid site and the strong acid site, respectively.17
The shapes of 1Mn–2Cu/SAPO, 2Mn–2Cu/SAPO and 4Mn–2Cu/SAPO were similar while the activity differed a lot, indicating that the related acid sites might not have significant influence on the SCR activity for xMn–2Cu/SAPO. For xMn/SAPO (x = 1, 2, 4, 8),14 the amount of ammonia desorption also decreased as manganese loading increased.
3.7 H2-TPR
The H2-TPR profiles of the four catalysts are depicted in Fig. 6. For 8Mn–2Cu/SAPO, there were two sharp peaks at 278 °C and 327 °C, respectively. The former indicated the reduction of MnO2 to Mn2O3, while the latter indicated the reduction of Mn2O3 to Mn3O4.3 Compared with Mn/TiO2,18,19 the reduction peaks moved to a lower temperature, indicating its good redox capacity.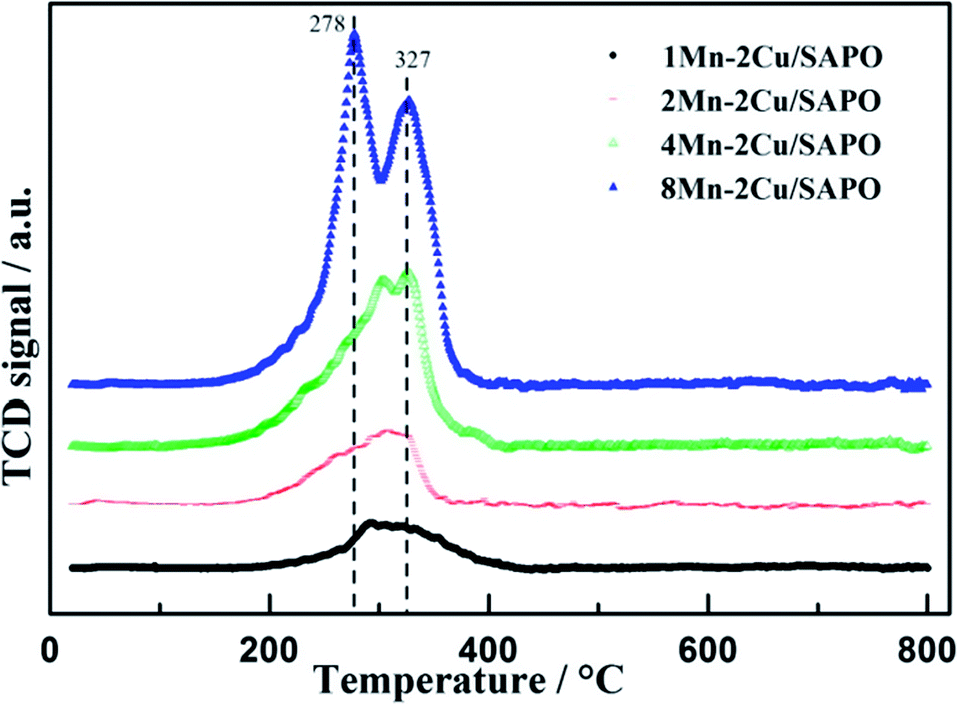 | ||
| Fig. 6 H2-TPR of xMn–2Cu/SAPO. | ||
In the TPR patterns, the reduction process of copper in SAPO-34 zeolite could be separated into two steps, i.e. the reduction of Cu2+ to Cu+ at about 300 °C and the reduction of Cu+ to Cu0 at about 440 °C,10 while in Fig. 6 the peak strength of 1Mn–2Cu/SAPO was relatively low, indicating that the peak strength of 2Cu/SAPO was even lower, making the assignation of copper species difficult and unreasonable, so the assignation of copper was not discussed. The hydrogen consumption amount of copper reduction was relatively low, so the ignorance of copper species would not influence the discussion of manganese species.
As manganese loading increased, the peaks at 278 °C and 327 °C increased, indicating that the proportion of Mn3+ and Mn4+ species increased. For 1Mn–2Cu/SAPO catalysts, only one broad peak between 250 and 400 °C was detectable, indicating that most of the manganese species were Mn2+ since Mn2+ cannot be reduced below 700 °C. Since Mn2+ species were inactive for SCR reaction, addition of manganese did not help increase the activity for 1Mn–2Cu/SAPO, which was consistent with Ep trends and NO oxidation results. For 2Mn–2Cu/SAPO the peaks belonging to Mn3+ and Mn4+ species started to generate, indicating its good redox capacity. For 4Mn–2Cu/SAPO and 8Mn–2Cu/SAPO, the peaks at 278 °C and 327 °C increased greatly, indicating that the ratio of Mn3+ and Mn4+ increased. When manganese loading was above 2%, Mn3+ and Mn4+ species began to generate, which is consistent with the Ep trends and NO oxidation results.
Compared with xMn/SAPO (x = 1, 2, 4, 8) previously prepared,14 for which the temperature peak of H2-TPR was about 353 °C and 442 °C, the peak temperature moved to a lower value, indicating that the interactions between copper and manganese species might accelerate oxidation reaction and increase the catalytic oxidation activity, which would promote low temperature SCR reaction.
Table 2 represents the hydrogen consumption of xMn–2Cu/SAPO during TPR processes. As manganese loading increased, hydrogen consumption increased gradually, while the actual hydrogen consumption was much lower than the theoretical value. The ratio of experimental hydrogen consumption to theoretical hydrogen consumption of 8Mn–2Cu/SAPO and 4Mn–2Cu/SAPO was similar, as well as that of 1Mn–2Cu/SAPO and 2Mn–2Cu/SAPO. Since the ratio of experimental hydrogen consumption to theoretical hydrogen consumption was highly related to the proportion of Mn3+ and Mn4+, the proportion of Mn3+ and Mn4+ for 1Mn–2Cu/SAPO and 2Mn–2Cu/SAPO were similar, as well as that of 8Mn–2Cu/SAPO and 4Mn–2Cu/SAPO.
| 8Mn–2Cu/SAPO | 4Mn–2Cu/SAPO | 2Mn–2Cu/SAPO | 1Mn–2Cu/SAPO | |
|---|---|---|---|---|
| a The actual hydrogen consumption calculated from TPR profiles.b The theoretical hydrogen consumption, assuming all of the Cu species are Cu2+ and reduced to Cu0, and all of the Mn species are Mn4+ and reduced to Mn2+ in TPR process. | ||||
| Hydrogen consumptiona (10−2 mmol) | 2.04 | 1.11 | 0.468 | 0.327 |
| Hydrogen consumptionb (10−2 mmol) | 3.53 | 2.08 | 1.35 | 0.989 |
| Hydrogen consumptiona/hydrogen consumptionb (%) | 57.8 | 53.4 | 35.7 | 33.1 |
3.8 DR UV-vis
The UV-vis spectra of the samples are given in Fig. 7. In Fig. 7, the absorption bands at 240 nm were related to the charge transfer processes between the framework aluminum and oxygen atoms of aluminophosphate.20 The band at 220 nm was attributed to the oxygen-to-metal charge-transfer of the isolated Cu+/Cu2+ bound on the framework of zeolites.21,22 The bands at 280–300 nm were assigned to copper oxide clusters.23,24 The bands at 700–800 nm were assigned to the d–d transition of isolated Cu2+ in weak disordered octahedral coordination of O-containing ligands.23,25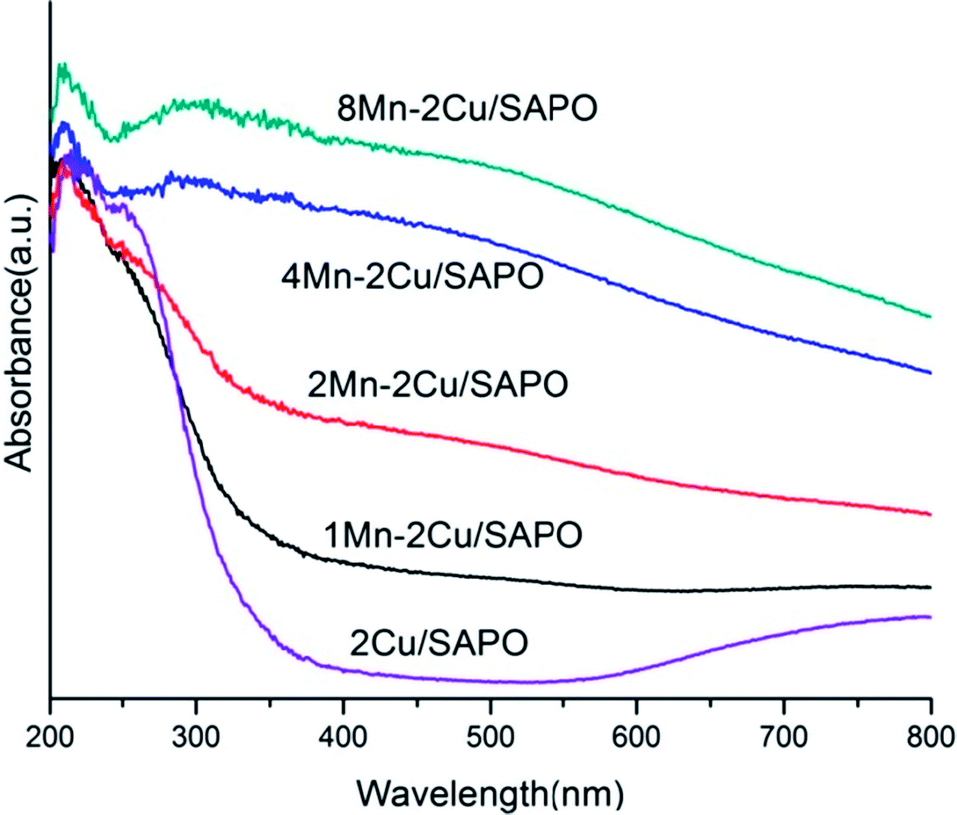 | ||
| Fig. 7 DR UV-vis spectra recorded under ambient atmosphere of xMn–2Cu/SAPO. | ||
The broad bands in the range 320–380 nm were attributed to the Mn3+ ← O2− charge transfer transition superimposed on the 5B1g → 5B2g crystal field d–d transition.26 The band at 322 nm was tentatively assigned to the Mn3+ ← O2− charge transfer in Mn3O4 in which manganese was octahedrally coordinated with oxygen.27–29 The band at 255–276 nm could be assigned to the Mn2+ ← O2− charge transfer transition in tetrahedral oxygen coordination.27,28 In the α-Mn2O3 structure, Mn3+ ions occupied octahedral sites and, if highly symmetric, a single spin-allowed absorption band in the d–d transition region was expected similarly to [Mn(H2O)6]3+ at 500 nm.
As manganese loading increased, the band at 320–380 nm increased gradually especially when the manganese loading changed from 2% to 4%, indicating that the percentage of Mn3+ increased.
Meanwhile the bands at 255–276 nm were generated, indicating that the percentage of Mn2+ decreased. Consistent with the H2-TPR result, the UV-vis results showed the partial oxidation of Mn2+ to Mn3+ or Mn4+, when manganese loading increased.
The UV-vis spectra of xMn–2Cu/SAPO were similar to that of xMn/SAPO (x = 1, 2, 4, 8)14 in that the percentage of Mn3+ increased suddenly as manganese loading increased from 2% to 4%, indicating that the distribution of manganese species might not have been influenced by the copper species.
3.9 XPS
Fig. 8a shows the XPS spectra of Mn 2P of xMn–2Cu/SAPO. Two main peaks assigned respectively to Mn 2P3/2 at 642.5 eV and Mn 2P1/2 at 654 eV were observed.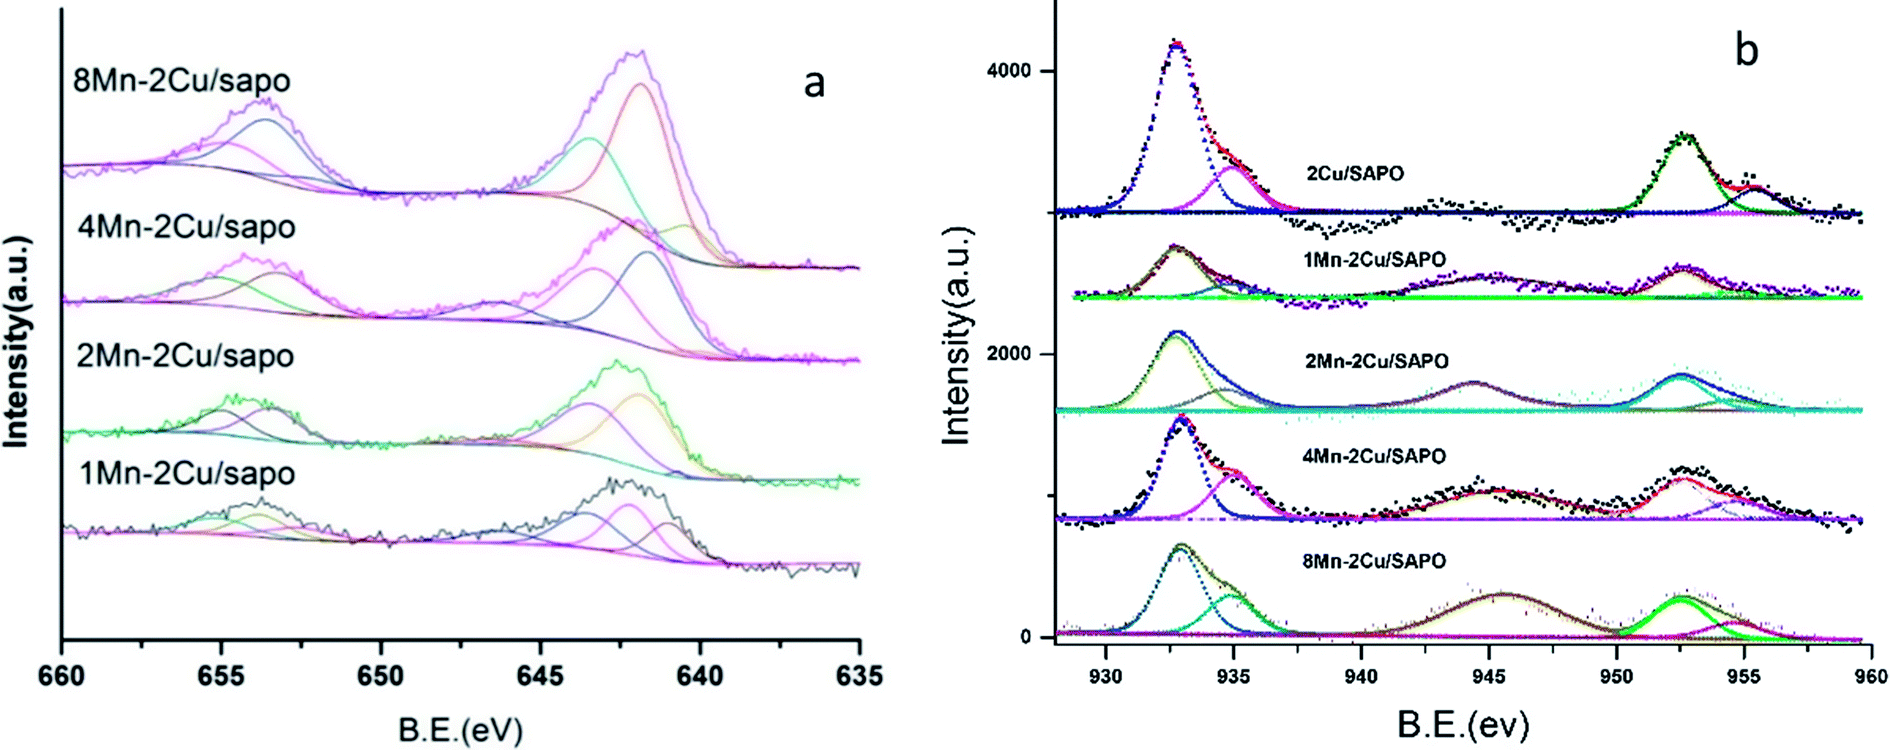 | ||
| Fig. 8 XPS spectra of (a) Mn 2P and (b) Cu 2P. | ||
By performing peak-fitting deconvolution, the Mn 2P3/2 peak could be separated into three peaks, i.e. 640.8–640.9 eV, 642.1–642.3 eV and 643.8–644.1 eV, which correspond to the Mn2+ species, Mn3+ species and Mn4+ species,3,30 respectively. The atomic percentages of manganese species in different valence states are shown in Table 3.
| Compound | Mn2+ | Mn3+ | Mn4+ | |||
|---|---|---|---|---|---|---|
| Peak (eV) | % | Peak (eV) | % | Peak (eV) | % | |
| 1Mn–2Cu/SAPO | 640.97 | 26.3 | 642.19 | 38.8 | 643.51 | 34.9 |
| 2Mn–2Cu/SAPO | 640.69 | 0.5 | 641.83 | 55.8 | 643.36 | 44.2 |
| 4Mn–2Cu/SAPO | 639.99 | 0.1 | 641.58 | 56.2 | 643.18 | 43.8 |
| 8Mn–2Cu/SAPO | 640.42 | 9.0 | 641.83 | 60.7 | 643.44 | 30.3 |
When manganese loading increased from 1% to 2%, the percentage of Mn3+ and Mn4+ increased and the percentage of Mn2+ decreased a lot, while when manganese loading kept increasing, the percentage of manganese species did not change much. This was consistent with the NO oxidation, H2 TPR and UV-vis results.
As manganese loading increased, the percentage of Mn3+ species increased, and the percentage of Mn4+ species also increased, except for 8Mn–2Cu/SAPO. This was consistent with the UV-vis and H2-TPR results. Though H2-TPR, UV-vis and XPS all showed that there were many Mn4+ and Mn3+ species on 8Mn–2Cu/SAPO, the XRD patterns showed the Mn2O3 phase, which indicated the aggregation of manganese species and decreased manganese dispersity, and the NH3-TPD results showed that there were much less acid sites. The decreased manganese dispersity and the less acid sites could lead to the lower SCR activity. The XPS spectra of xMn/SAPO (x = 1, 2, 4, 8)14 also showed that most of the manganese species were Mn3+ and Mn4+.
Fig. 8b shows the XPS spectra of Cu 2P; two peaks respectively attributed to Cu 2P3/2 at 932.6 eV and Cu 2P1/2 at 952.7 eV were observed. The shake-up satellite was found at about 945 eV, indicating the presence of Cu2+ species. As manganese loading increased, the shake-up satellite increased, indicating that the amount of Cu2+ species increased.
By performing peak-fitting deconvolution, the Cu 2P3/2 peak could be separated into two peaks, at about 932.7 eV and 934.8 eV respectively, which was ascribed to the Cu+ and Cu2+ species.31 The atom percentage of Cu+ and Cu2+ is shown in Table 4. As manganese loading increased, the ratio of Cu2+ increased, indicating that the addition of manganese might oxidize Cu+ into Cu2+, which was strong evidence that there was strong interaction between the copper and manganese species.
| Compound | Cu+ | Cu2+ | ||
|---|---|---|---|---|
| Peak (eV) | % | Peak (eV) | % | |
| 2Cu/SAPO | 932.75 | 78.3 | 934.93 | 21.7 |
| 1Mn–2Cu/SAPO | 932.75 | 79.9 | 934.81 | 20.1 |
| 2Mn–2Cu/SAPO | 932.64 | 75.6 | 934.56 | 24.4 |
| 4Mn–2Cu/SAPO | 932.84 | 65.7 | 934.93 | 34.3 |
| 8Mn–2Cu/SAPO | 932.82 | 67.2 | 934.80 | 32.7 |
According to the results above and referring to the mechanism of SCR on Cu/SAPO Feng Gao9 had put forward, the mechanism of SCR on 2Mn–2Cu/SAPO could be proposed. Fig. 9 showed the proposed low temperature SCR mechanism on 2Mn–2Cu/SAPO. In the catalytic cycle, Mnx+ acts as a catalyst for the oxidation step of Cu+ to Cu2+ in low temperature SCR reaction.
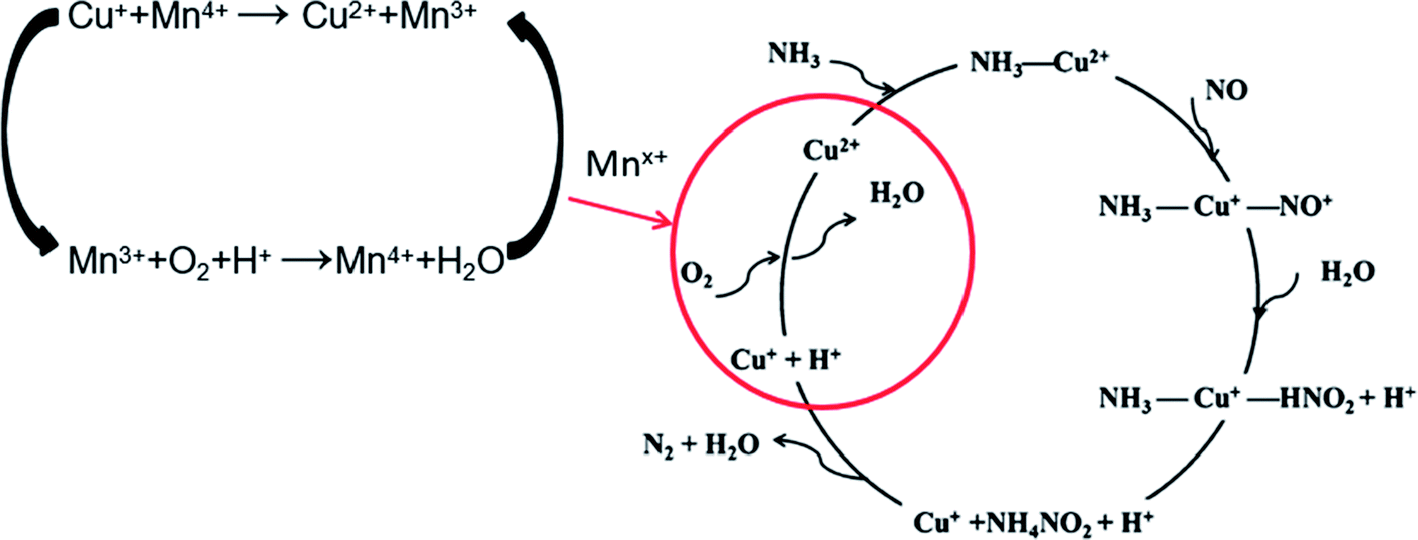 | ||
| Fig. 9 The proposed low temperature SCR mechanism on 2Mn–2Cu/SAPO. | ||
3.10 DRIFTS
In situ DRIFTS was performed to identify the adsorbed NO species. Fig. 10 shows the DRIFTS spectra of 4Mn–2Cu/SAPO at 150 °C exposed to different gas phases. In Fig. 10a, there was only one positive band at 1360 cm−1 in the range of 1200–1600 nm, which belongs to nitrite groups,32,33 suggesting that those NO species were nitrite groups. The negative bands at 3280 cm−1 and 2730 cm−1 might be attributed to the depletion of Brønsted base sites by the nitrite groups. Three bands at 3675 cm−1, 3623 cm−1 and 3598 cm−1 could be attributed to the appearance of O–H bond of nitrite groups (–N–O–H) in different chemical environments. When NH3 was introduced into the system, as shown in Fig. 10b, the bands associated with nitrite groups decreased rapidly, indicating reaction between NH3 and NO related species.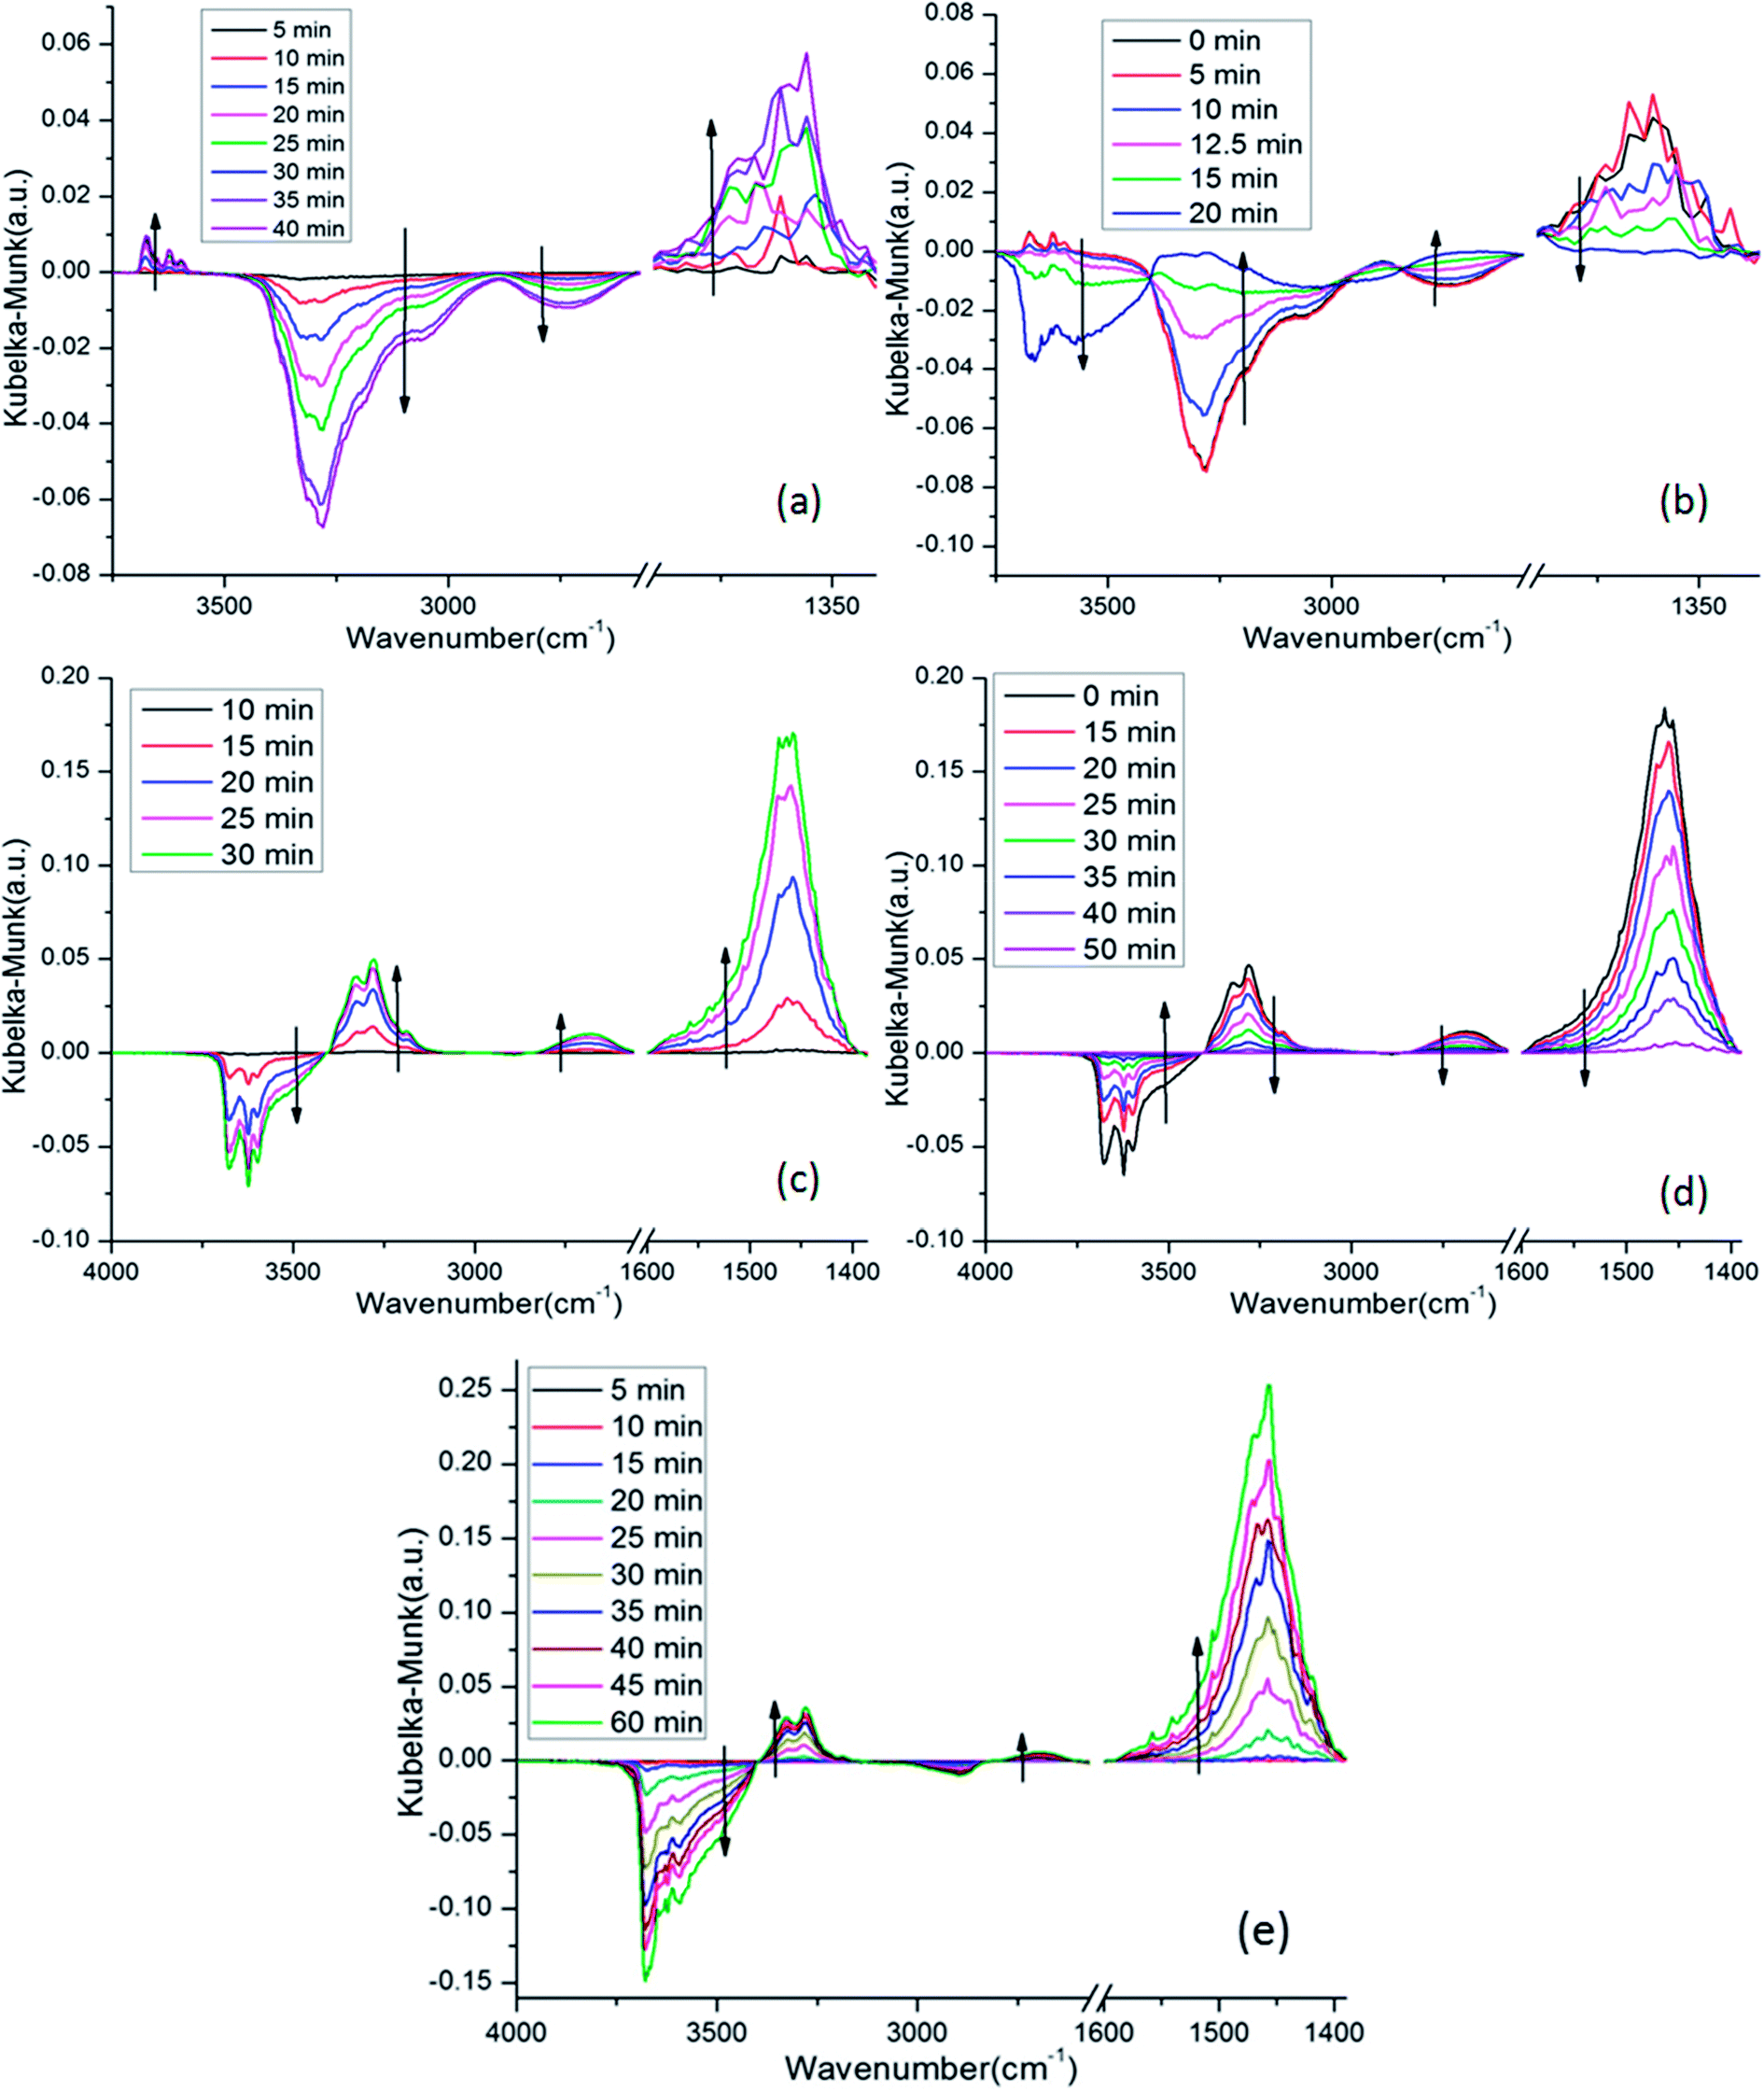 | ||
| Fig. 10 DRIFTS spectra of 4Mn–2Cu/SAPO at 150 °C exposed to gas phase of (a) 500 ppm NO + 3% vol O2 + N2 (balance); (b) 500 ppm NH3 + 3% vol O2 + N2 (balance) after saturation with NO; (c) 500 ppm NH3 + 3% vol O2 + N2 (balance); (d) 500 ppm NO + 3% vol O2 + N2 (balance) after saturation with NH3; (e) 500 ppm NO + 500 ppm NH3 + 3% vol O2 + N2 (balance). | ||
In Fig. 10c, when NH3 was introduced into the system, the bands at 1463 cm−1 increased greatly, indicating the generation of NH3 species on the Brønsted acid sites,22 while the bands at 1210 cm−1 increased slightly, which was consistent with the fact that most of the acid sites on SAPO-34 were Brønsted acid sites. The negative bands at 3681 cm−1, 3625 cm−1 and 3600 cm−1 were attributed to the depletion of Brønsted acid sites, which was caused by the adsorption of NH3. Specifically, the negative bands at 3681 cm−1 were assigned to the occupation of P–OH sites by NH3. The other two bands were related to the depletion of Si–OH–Al acid sites. The band at 3147–3396 cm−1 was attributed to the N–H stretching vibrations of NH4+.22 When NO was introduced into the system, as shown in Fig. 10d, the bands related to the NH3 species decreased gradually, which was caused by the reaction between NO and NH3.
Fig. 10e and c are similar in that only bands related to NH3 are visible, while no other bands appeared, especially the negative bands at 2700 cm−1 and 3000–3400 cm−1 were invisible.
This was strong evidence that only the Elay–Rideal mechanism was effective on the 4Mn–2Cu/SAPO at 150 °C. Since if Langmuir–Hinshelwood mechanism was effective, the adsorbed and well activated NO and NH3 related species would react with each other, while the NO species not well activated would accumulated and be detectable for DRIFTS, leading to the appearance of negative bands at 2700 and 3000–3400 nm−1, as Fig. 10a and b show. Due to the fact that those peaks were not observed in Fig. 10e, all these observations lead to the exclusion of the Langmuir–Hinshelwood mechanism and the assurance of the Elay–Rideal mechanism. In the Elay–Rideal mechanism, NO molecules from gas phase directly react with the well activated NH3 species adsorbed on the surface and leave as products to gas phase with the active site left.
4 Conclusion
In this work, the SCR activity and physicochemical properties of xMn–2Cu/SAPO were investigated. The H2-TPR, UV-vis and XPS results showed that Mn4+ and Mn3+ species began to appear when manganese loading reached 2%. The NO oxidation results showed that 2Mn–2Cu/SAPO had the best NO oxidation activity, indicating that good interaction existed between copper and manganese, which was consistent with the XPS results of Cu 2p binding energy.The graph of the promotion effect of manganese showed that for 2Mn–2Cu/SAPO, manganese had a good promotion effect on 2Cu/SAPO. According to H2-TPR, UV-vis, XPS and NO oxidation results, the promotion effect of manganese on 2Cu/SAPO comes from the generation of Mn3+ and Mn4+ species. The addition of manganese increased the ratio of Cu2+. The Mn3+ and Mn4+ species might take part in the catalytic cycle and accelerate the oxidation of Cu+ to Cu2+.
From the in situ DRIFTS results, the acid sites on the surface were mainly Brønsted acid sites, the main mechanism on 4Mn–2Cu/SAPO-34 at low temperature was the Elay–Rideal mechanism.
Conflicts of interest
There are no conflicts to declare.Acknowledgements
This research is sponsored by the China National Key Research and Development Program via Project No. 2016YFB0600603.References
- T. Boningari and P. G. Smirniotis, Impact of nitrogen oxides on the environment and human health: Mn-based materials for the NOx abatement, Curr. Opin. Chem. Eng., 2016, 13, 133–141 CrossRef.
- P. G. Smirniotis, D. A. PenÄ and B. S. Uphade, Low-Temperature Selective Catalytic Reduction (SCR) of NO with NH3 by Using Mn, Cr, and Cu Oxides Supported on Hombikat TiO2, Angew. Chem., Int. Ed., 2001, 40, 2479–2482 CrossRef CAS PubMed.
- P. R. Ettireddy, N. Ettireddy, T. Boningari, R. Pardemann and P. G. Smirniotis, Investigation of the selective catalytic reduction of nitric oxide with ammonia over Mn/TiO2 catalysts through transient isotopic labeling and in situ FT-IR studies, J. Catal., 2012, 292, 53–63 CrossRef CAS.
- B. Thirupathi and P. G. Smirniotis, Nickel-doped Mn/TiO2 as an efficient catalyst for the low-temperature SCR of NO with NH3: Catalytic evaluation and characterizations, J. Catal., 2012, 288, 74–83 CrossRef CAS.
- D. K. Pappas, T. Boningari, P. Boolchand and P. G. Smirniotis, Novel manganese oxide confined interweaved titania nanotubes for the low-temperature Selective Catalytic Reduction (SCR) of NOx by NH3, J. Catal., 2016, 334, 1–13 CrossRef CAS.
- P. R. Ettireddy and A. Kotrba, Low Temperature SCR Catalysts Optimized for Cold-Start and Low-Load Engine Exhaust Conditions, SAE Technical Paper 2015-01-1026, 2015 Search PubMed.
- C. Wang, J. Wang, J. Wang, T. Yu, M. Shen, W. Wang and W. Li, The effect of sulfate species on the activity of NH3-SCR over Cu/SAPO-34, Appl. Catal., B, 2017, 204, 239 CrossRef CAS.
- C. Paolucci, I. Khurana, A. A. Parekh and R. Gounder, et al. Dynamic multinuclear sites formed by mobilized copper ions in NOx selective catalytic reduction, Appl. Catal., B, 2018, 220, 161–170 CrossRef.
- F. Gao, J. Kwak, J. Szanyi and C. F. Peden, Current Understanding of Cu-Exchanged Chabazite Molecular Sieves for Use as Commercial Diesel Engine DeNOx Catalysts, Top. Catal., 2013, 56, 1441–1459 CrossRef CAS.
- X. Dong, J. Wang, H. Zhao and Y. Li, The promotion effect of CeOx on Cu-SAPO-34 catalyst for selective catalytic reduction of NOx with ammonia, Catal. Today, 2015, 258, 28–34 CrossRef CAS.
- Y. Cao, S. Zou, L. Lan, Z. Yang, H. Xu, T. Lin, M. Gong and Y. Chen, Promotional effect of Ce on Cu-SAPO-34 monolith catalyst for selective catalytic reduction of NOx with ammonia, J. Mol. Catal. A: Chem., 2015, 398, 304–311 CrossRef CAS.
- K. Leistner, O. Mihai, K. Wijayanti, A. Kumar, K. Kamasamudram, N. W. Currier, A. Yezerets and L. Olsson, Comparison of Cu/BEA, Cu/SSZ-13 and Cu/SAPO-34 for ammonia-SCR reactions, Catal. Today, 2015, 258, 49–55 CrossRef CAS.
- L. Ma, Y. Cheng, G. Cavataio, R. W. McCabe, L. Fu and J. Li, In situ DRIFTS and temperature-programmed technology study on NH3-SCR of NOx over Cu-SSZ-13 and Cu-SAPO-34 catalysts, Appl. Catal., B, 2014, 156–157, 428–437 CrossRef CAS.
- C. Pang, Y. Zhuo and Q. Weng, Mn/SAPO-34 as an efficient catalyst for the low-temperature selective catalytic reduction of NOx with NH3, RSC Adv., 2017, 7, 32146–32154 RSC.
- G. Qi and R. T. Yang, Low-temperature selective catalytic reduction of NO with NH3 over iron and manganese oxides supported on titania, Appl. Catal., B, 2003, 44, 217–225 CrossRef CAS.
- D. Wang, Y. Jangjou, Y. Liu, M. K. Sharma, J. Luo, J. Li, K. Kamasamudram and W. S. Epling, A comparison of hydrothermal aging effects on NH3-SCR of NOx over Cu-SSZ-13 and Cu-SAPO-34 catalysts, Appl. Catal., B, 2015, 165, 438–445 CrossRef CAS.
- D. Wang, L. Zhang, J. Li, K. Kamasamudram and W. S. Epling, NH3-SCR over Cu/SAPO-34 – Zeolite acidity and Cu structure changes as a function of Cu loading, Catal. Today, 2014, 231, 64–74 CrossRef CAS.
- D. K. Pappas, T. Boningari, P. Boolchand and P. G. Smirniotis, Novel manganese oxide confined interweaved titania nanotubes for the low-temperature Selective Catalytic Reduction (SCR) of NOx by NH3, J. Catal., 2016, 334, 1–13 CrossRef CAS.
- D. A. Peña, B. S. Uphade and P. G. Smirniotis, TiO2-supported metal oxide catalysts for low-temperature selective catalytic reduction of NO with NH3: I. Evaluation and characterization of first row transition metals, J. Catal., 2004, 221, 421–431 CrossRef.
- M. A. Zanjanchi and M. K. Rashidi, Structural charge transfer in the aluminophosphate molecular sieves by diffuse reflectance spectroscopy, Spectrochim. Acta, Part A, 1999, 55, 947–954 CrossRef.
- S. Bennici, A. Gervasini, N. Ravasio and F. Zaccheria, Optimization of tailoring of CuOx Species of silica alumina supported catalysts for the selective catalytic reduction of NOx, J. Phys. Chem. B, 2003, 107, 5168–5176 CrossRef CAS.
- J. Y. Luo, H. Oh, C. Henry and W. Epling, Effect of C3H6 on selective catalytic reduction of NOx by NH3 over a Cu/zeolite catalyst: A mechanistic study, Appl. Catal., B, 2012, 123–124, 296–305 CrossRef CAS.
- S. A. Yashnik, Z. R. Ismagilov and V. F. Anufrienko, Catalytic properties and electronic structure of copper ions in Cu-ZSM-5, Catal. Today, 2005, 110, 310–322 CrossRef CAS.
- O. P. Taran, S. A. Yashnik, A. B. Ayusheev, A. S. Piskun, R. V. Prihod'ko, Z. R. Ismagilov, V. V. Goncharuk and V. N. Parmon, Cu-containing MFI zeolites as catalysts for wet peroxide oxidation of formic acid as model organic contaminant, Appl. Catal., B, 2013, 140–141, 506–515 CrossRef CAS.
- S. Bennici, A. Gervasini, N. Ravasio and F. Zaccheria, Optimization of tailoring of CuOx species of silica alumina supported catalysts for the selective catalytic reduction of NOx, J. Phys. Chem. B, 2003, 107, 5168–5176 CrossRef CAS.
- T. Kharlamova, G. Mamontov, M. Salaev, V. Zaikovskii, G. Popova, V. Sobolev, A. Knyazev and O. Vodyankina, Structural charge transfer in the aluminophosphate molecular sieves by diffuse reflectance spectroscopy, Appl. Catal., A, 2013, 467, 519–529 CrossRef CAS.
- Q. Tang, S. Hu, Y. Chen, Z. Guo, Y. Hu, Y. Chen and Y. Yang, Highly dispersed manganese oxide catalysts grafted on SBA-15: synthesis, characterization and catalytic application in trans-stilbene epoxidation, Microporous Mesoporous Mater., 2010, 132, 501–509 CrossRef CAS.
- I. Spassova, T. Tsontcheva, N. Velichkova, M. Khristova and D. Nihtianova, Catalytic reduction of NO with decomposed methanol on alumina-supported Mn–Ce catalysts, J. Colloid Interface Sci., 2012, 374, 267–277 CrossRef CAS PubMed.
- Z. Qu, Y. Bu, Y. Qin, Y. Wang and Q. Fu, The improved reactivity of manganese catalysts by Ag in catalytic oxidation of toluene, Appl. Catal., B, 2013, 132–133, 353–362 CrossRef CAS.
- T. Boningari, P. R. Ettireddy, A. Somogyvari, Y. Liu, A. Vorontsov, C. A. McDonald and P. G. Smirniotis, Influence of elevated surface texture hydrated titania on Ce-doped Mn/TiO2 catalysts for the low-temperature SCR of NOx under oxygen-rich conditions, J. Catal., 2015, 325, 145–155 CrossRef CAS.
- T. Boningari, D. K. Pappas, P. R. Ettireddy, A. Kotrba and P. G. Smirniotis, Influence of SiO2 on M/TiO2 (M = Cu, Mn, and Ce) Formulations for Low-Temperature Selective Catalytic Reduction of NOx with NH3: Surface Properties and Key Components in Relation to the Activity of NOx Reduction, Ind. Eng. Chem. Res., 2015, 54, 2261–2273 CrossRef CAS.
- C. Lamberti, S. Bordiga, M. Salvalaggio, G. Spoto and A. Zecchina, XAFS, IR, and UV-vis Study of the CuI Environment in CuI-ZSM-5, J. Phys. Chem. B, 1997, 101, 344–360 CrossRef CAS.
- M. Iwasaki and H. Shinjoh, NO evolution reaction with NO2 adsorption over Fe/ZSM-5: in situ FT-IR observation and relationships with Fe sites, J. Catal., 2010, 273, 29–38 CrossRef CAS.
| This journal is © The Royal Society of Chemistry 2018 |