 Open Access Article
Creative Commons Attribution 3.0 Unported Licence
An investigation on 3-acetyl-7-methoxy-coumarin Schiff bases and their Ru(II) metallates with potent antiproliferative activity and enhanced LDH and NO release†
G. Kalaiarasia,
S. Rex Jeya Rajkumarb,
S. Dharania,
J. G. Małeckic and
R. Prabhakaran *a
*a
aDepartment of Chemistry, Bharathiar University, Coimbatore 641 046, India. E-mail: rpnchemist@gmail.com; Fax: +91-422-2422387; Tel: +91-422-2428319
bDepartment of Biosciences and Technology, Karunya University, Coimbatore 641 114, India
cDepartment of Crystallography, Silsian University, Szkolna 9, 40-006 Katowice, Poland
First published on 4th January 2018
Abstract
New cyclometallated ruthenium(II) complexes of 3-acetyl-7-methoxycoumarin-4N-substituted thiosemicarbazones were synthesized and characterized by analytical and spectral techniques. The crystal structures of the ligands H2L1–3 and complexes (1, 2 and 4) were confirmed by X-ray crystallography. The analysis showed that the ligands have undergone C–H activation at the C(4) carbon of the pyrone ring and acted in a tridentate fashion by binding through C, N and S atoms. CT-DNA and protein (BSA/HSA) binding studies were carried out to analyze their interaction with biomolecules. Good binding affinity with DNA was observed with intercalative binding mode, which was further confirmed by EB displacement and viscosity measurement studies. The quenching mechanism with BSA/HSA was found to be static. Three dimensional (3D) fluorescence measurements were carried out to validate the micro environmental changes in the serum albumins. Their antioxidant propensity and antimicrobial study insisted that the compounds displayed good spectrum of activity. Evaluation of their anticancer potential against MCF-7 (human breast cancer) and A549 (human lung carcinoma) cell lines revealed that the complexes exhibited better activity than the ligands and cisplatin. Further, the results of LDH and NO release assays supported the cytotoxic nature of the compounds. The non-toxic nature of the compounds was established by testing against the non-cancerous cell line HaCaT (human normal keratinocyte).
Introduction
Thiosemicarbazides are a versatile class of compounds with indispensable properties such as antitumor, antifungal, antibacterial, antiviral, antiparasitic, etc.1–6 They are N, S donor ligands whose activity can be greatly enhanced by the presence of additional donor sites and a variety of coordination modes can be shown by these systems.7–9 Potential ligands are formed by attaching thiosemicarbazides with carbonyl compounds having a heterocyclic moiety. A good deal of research can be possible on such ligands and their metal complexes.10 It is already reported that the cytotoxicity of thiosemicarbazones is mostly related with their parent aldehyde or ketone, metal chelation efficacy and terminal amino substitution.11,12 Coumarin is one among the natural products found extensively in plants, which exhibits various pharmacological activities.13,14 Coumarin derived antibiotics such as novobiocin, clorobiocin and coumermycin A1 are commercialized.15,16 Their ability to inhibit human immunodeficiency virus integrase made them to be analysed in the treatment of HIV.17 Reports are available for testing coumarin derivatives against various tumor18 and neuronal cell lines.19 Generation of satisfactory clinical compounds is one of the promising approaches to attain effective and less toxic chemodrugs. The present scenario of inorganic research faces difficulties in raising highly active metal based drugs, the main criteria of which being less toxic and target specific. Among others, cancer stands as the most threatening disease and consistent attempts are made to develop appropriate chemotherapeutic drugs. Successful application of cisplatin as an anticancer agent provoked the chemists to search for other active metal complexes.20,21 Recently, ruthenium complexes have come into the lime light since two such complexes namely NAMI-A22 and KP1019![[thin space (1/6-em)]](https://www.rsc.org/images/entities/char_2009.gif) 23 entered into clinical trials, attesting the efficiency of ruthenium in the treatment of cancer. Moreover, exhibition of diverse coordination modes, stable oxidation states (from −2 to 8) and mimicking iron in binding biomolecules makes ruthenium a better alternative for platinum.24 Sufficient number of articles are available in the literature reporting the anticancer efficiency of ruthenium complexes including those by Garza-Ortiz et al.,25 and Juinn Chow et al.26
23 entered into clinical trials, attesting the efficiency of ruthenium in the treatment of cancer. Moreover, exhibition of diverse coordination modes, stable oxidation states (from −2 to 8) and mimicking iron in binding biomolecules makes ruthenium a better alternative for platinum.24 Sufficient number of articles are available in the literature reporting the anticancer efficiency of ruthenium complexes including those by Garza-Ortiz et al.,25 and Juinn Chow et al.26
Considering the foregoing facts and our continuous investigation on thiosemicarbazone complexes of various transition metals, herein we report the synthesis, spectral characterization, X-ray diffraction analysis, DNA/protein binding, antioxidant, antimicrobial and anticancer studies of 3-acetyl-7-methoxycoumarin-4N-substituted thiosemicarbazones and their cyclometallated ruthenium(II) complexes.
Results and discussion
Synthesis and characterization
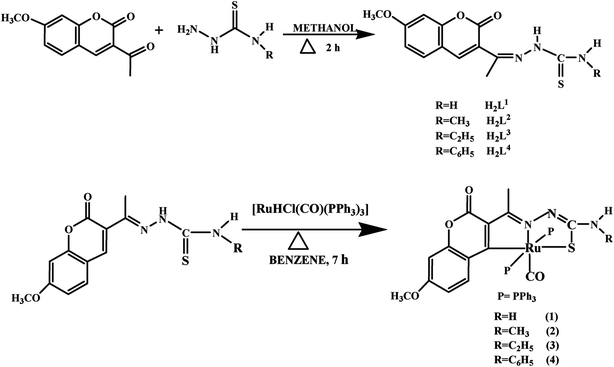
The ligands H2L1–4 were synthesized by the reaction of 3-acetyl-7-methoxy-2H-chromene-2-one with 4(N)-substituted thiosemicarbazides in methanol, which was precipitated as yellow solid from the reaction mixture. Reacting an equimolar mixture of these Schiff base ligands with [RuHClCO(PPh3)3] in benzene under reflux for 7 h afforded a reddish orange solution (Scheme 1). Characterization of the ligands and complexes were done by using elemental analyses, infrared spectroscopy, UV-Vis and NMR spectroscopy. The structures of the ligands H2L1–3 and complexes (1, 2 and 4) were confirmed by X-ray crystallographic study. X-ray crystal structural determination clearly showed that the ligands have undergone C–H activation at the ortho position of H3C–C![[double bond, length as m-dash]](https://www.rsc.org/images/entities/char_e001.gif) N and acted in a tridentate, bianionic manner binding through CNS atoms. Both the ligands and complexes are air stable and soluble in ethanol, chloroform, dichloromethane, toluene, methanol, DMSO and DMF. By using UV-visible spectroscopic techniques, the stability of the compounds in aqueous solutions was confirmed (Fig. S1 in the ESI†). The spectra recorded immediately and after 24 h did not show any appreciable change in the intensity and the position of the bands.
N and acted in a tridentate, bianionic manner binding through CNS atoms. Both the ligands and complexes are air stable and soluble in ethanol, chloroform, dichloromethane, toluene, methanol, DMSO and DMF. By using UV-visible spectroscopic techniques, the stability of the compounds in aqueous solutions was confirmed (Fig. S1 in the ESI†). The spectra recorded immediately and after 24 h did not show any appreciable change in the intensity and the position of the bands.
Assignments of selected characteristic IR band positions provided significant indication for the formation of 3-acetyl-7-methoxycoumarin-4(N)-substituted thiosemicarbazone ligands and their ruthenium complexes (Fig. S2–S10†). A band in the region 1600–1644 cm−1 is assigned to the ν(C![[double bond, length as m-dash]](https://www.rsc.org/images/entities/char_e001.gif) N),27 whereas the shifting of this band to 1606–1607 cm−1 revealed the coordination of azomethine nitrogen atom to the metal ion.28,29 A band appeared at 826–835 cm−1 in the ligands due to vibration of the C
N),27 whereas the shifting of this band to 1606–1607 cm−1 revealed the coordination of azomethine nitrogen atom to the metal ion.28,29 A band appeared at 826–835 cm−1 in the ligands due to vibration of the C![[double bond, length as m-dash]](https://www.rsc.org/images/entities/char_e001.gif) S group, which disappeared in the spectra of the complexes and a new band corresponding to the C–S group appeared at 744–745 cm−1 indicating that the other coordination is through thiolate sulphur after enolization followed by deprotonation.30 In all the complexes, terminally coordinated carbonyl group appeared as a strong band in the region 1918–1925 cm−1.29,30 The stretching frequencies of triphenylphosphine group were observed around 1404–1434, 1087–1090, 694–696 cm−1.30,31
S group, which disappeared in the spectra of the complexes and a new band corresponding to the C–S group appeared at 744–745 cm−1 indicating that the other coordination is through thiolate sulphur after enolization followed by deprotonation.30 In all the complexes, terminally coordinated carbonyl group appeared as a strong band in the region 1918–1925 cm−1.29,30 The stretching frequencies of triphenylphosphine group were observed around 1404–1434, 1087–1090, 694–696 cm−1.30,31
The electronic spectra of the ligands H2L1–4 and complexes 1–4 were recorded in DMSO. In the spectra of the free ligands, the higher energy absorption bands appeared around 275–282 nm have been assigned to (π → π*) transitions and the bands observed at 352–356 nm have been assigned to (n → π*) transitions.32 In the complexes 1–4, the high energy absorption band observed in the region 268–337 nm has been assigned to intra ligand transitions, the lowest energy band in the region 357–380 nm has been attributed to the ligand to metal charge transfer (LMCT) transitions.7
The 1H NMR spectra of 3-acetyl-7-methoxy-coumarin, 3-acetyl-7-methoxy-coumarin-4(N)-substituted thiosemicarbazone ligands H2L1–4 and their Ru(II) complexes (1–4) showed the signals in the expected regions (Fig. S11–S19†). The singlets that appeared at δ 10.26–10.77 ppm were assigned to the hydrazinic proton of the free ligands, these signals were absent in the complexes (1–4), supporting the enolization and deprotonation of the NH–C![[double bond, length as m-dash]](https://www.rsc.org/images/entities/char_e001.gif) S group upon coordination of the thiolate sulfur to the Ru(II) ion.7,30 The singlet due to the N
S group upon coordination of the thiolate sulfur to the Ru(II) ion.7,30 The singlet due to the N![[double bond, length as m-dash]](https://www.rsc.org/images/entities/char_e001.gif) C–CH3 proton appeared at δ 2.24–2.33 ppm in the spectra of free ligand, which underwent an upfield shift in the spectra of the complexes to δ 1.88–2.09 ppm, suggesting that the coordination occurred via the nitrogen atom of N
C–CH3 proton appeared at δ 2.24–2.33 ppm in the spectra of free ligand, which underwent an upfield shift in the spectra of the complexes to δ 1.88–2.09 ppm, suggesting that the coordination occurred via the nitrogen atom of N![[double bond, length as m-dash]](https://www.rsc.org/images/entities/char_e001.gif) C–CH3 group.29,33,34 The spectra of the ligands H2L1–4 displayed a singlet at δ 7.98–8.45 ppm, which is corresponding to the hydrogen atom at C(4) carbon, however, for complexes 1–4 no resonance could be attributed to C4(H), which indicated that the C(4) carbon atom of the pyrone ring is coordinated to the metal after deprotonation. In addition, the spectra of all the ligands and complexes exhibited a series of signals for aromatic protons at δ 6.29–7.74 ppm
C–CH3 group.29,33,34 The spectra of the ligands H2L1–4 displayed a singlet at δ 7.98–8.45 ppm, which is corresponding to the hydrogen atom at C(4) carbon, however, for complexes 1–4 no resonance could be attributed to C4(H), which indicated that the C(4) carbon atom of the pyrone ring is coordinated to the metal after deprotonation. In addition, the spectra of all the ligands and complexes exhibited a series of signals for aromatic protons at δ 6.29–7.74 ppm![[thin space (1/6-em)]](https://www.rsc.org/images/entities/char_2009.gif) 7,30 and a singlet for –OCH3 protons around δ 3.74–3.93 ppm.35
7,30 and a singlet for –OCH3 protons around δ 3.74–3.93 ppm.35
X-ray crystallography
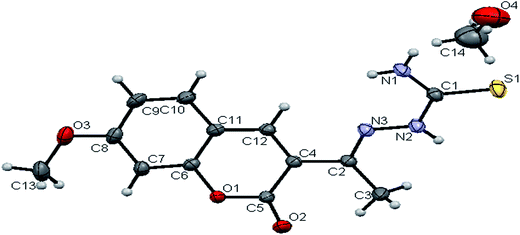
![[1 with combining macron]](https://www.rsc.org/images/entities/char_0031_0304.gif) space group. The monomeric units of the ligand H2L1 were arranged in a dimeric manner by the weaker N(1)–H(1)⋯O(1) hydrogen bonds (Fig. S20, Table S2†). The ligand H2L2 crystallized in the trigonal system with P
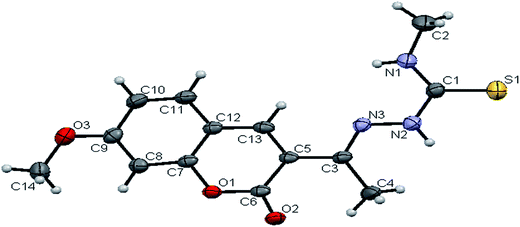
space group. The monomeric units of the ligand H2L1 were arranged in a dimeric manner by the weaker N(1)–H(1)⋯O(1) hydrogen bonds (Fig. S20, Table S2†). The ligand H2L2 crystallized in the trigonal system with P![[3 with combining macron]](https://www.rsc.org/images/entities/char_0033_0304.gif) space group. Six crystallographically independent molecules were present in the unit cell. In ligand H2L2, we found the donor–acceptor distance as 3.013 Å corresponding to the N(1)–O(1) and O(1)–N(1) bond between the two molecules (Fig. 2). This interaction gave a pseudo bimolecular appearance to the ligand H2L2 (Fig. S21†). The X-ray single crystal structure of the ligand H2L3 is shown in Fig. 3. From the symmetry of the reflections and solution of the structures, it is clear that the crystals belong to the triclinic P
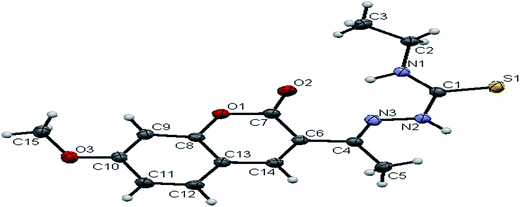
space group. Six crystallographically independent molecules were present in the unit cell. In ligand H2L2, we found the donor–acceptor distance as 3.013 Å corresponding to the N(1)–O(1) and O(1)–N(1) bond between the two molecules (Fig. 2). This interaction gave a pseudo bimolecular appearance to the ligand H2L2 (Fig. S21†). The X-ray single crystal structure of the ligand H2L3 is shown in Fig. 3. From the symmetry of the reflections and solution of the structures, it is clear that the crystals belong to the triclinic P![[1 with combining macron]](https://www.rsc.org/images/entities/char_0031_0304.gif) space group. H-Bonding in this structure is distinctly different from that observed in H2L1 and H2L2. The ligand H2L3 involved an intramolecular dipolar interaction between coumarin oxygen (O2) and azomethine nitrogen (N3) atoms as shown in Fig. S22 (Table S2†).
space group. H-Bonding in this structure is distinctly different from that observed in H2L1 and H2L2. The ligand H2L3 involved an intramolecular dipolar interaction between coumarin oxygen (O2) and azomethine nitrogen (N3) atoms as shown in Fig. S22 (Table S2†).
| Identification code | [H2-7MAC-tsc] | [H2-7MAC-mtsc] | [H2-7MAC-etsc] |
| Empirical formula | C13H13N3O3S·CH3OH | C14H15N3O3S | C15H17N3O3S |
| Formula weight | 323.36 | 305.35 | 319.38 |
| Temperature | 295(2) K | 295(2) K | 295(2) K |
| Wavelength | 0.7107 Å | 0.7107 Å | 0.7107 Å |
| Crystal system | Triclinic | Trigonal | Triclinic |
| Space group | P![[1 with combining macron]](https://www.rsc.org/images/entities/char_0031_0304.gif) |
P![[3 with combining macron]](https://www.rsc.org/images/entities/char_0033_0304.gif) |
P![[1 with combining macron]](https://www.rsc.org/images/entities/char_0031_0304.gif) |
| Unit cell dimensions | |||
| a | 8.3702 (6) Å | 17.5595 (9) Å | 7.5260 (6) Å |
| B | 8.8979(8) Å | 17.5595 (9) Å | 8.0281 (6) Å |
| C | 12.4669 (9) Å | 8.6657 (7) Å | 13.5383 (10) Å |
| α | 97.411 (7)° | 90° | 89.670 (6)° |
| β | 106.008 (6)° | 90° | 87.437 (6)° |
| γ | 113.670 (8)° | 120° | 67.782 (7)° |
| Volume | 786.53 (12) Å3 | 2314.0 (3) Å3 | 756.43 (11) Å3 |
| Z | 2 | 6 | 2 |
| Density | 1.365 mg m−3 | 1.315 mg m−3 | 1.402 mg m−3 |
| Absorption coefficient | 0.227 mm−1 | 0.223 mm−1 | 0.230 mm−1 |
| F(000) | 340 | 960 | 336 |
| Crystal size | 0.02 × 0.08 × 0.34 mm | 0.06 × 0.08 × 0.31 mm | 0.13 × 0.14 × 0.38 mm |
| Crystal shape | Needle | Needle | Prism |
| θ range for data collection | 4.223 to 27.424° | 4.003 to 25.505° | 4.100 to 28.715° |
| Limiting indices | −11 ≤ h ≤ 11, −12 ≤ k ≤ 12, −16 ≤ l ≤ 17 | −22 ≤ h ≤ 24, −24 ≤ k ≤ 23, −7 ≤ l ≤ 11 | −10 ≤ h ≤ 10, −11 ≤ k ≤ 10, −17 ≤ l ≤ 17 |
| Reflections collected | 2480 | 2007 | 2619 |
| Independent reflections | 3726 (R(int) = 0.0307) | 3576 (R(int) = 0.0321) | 3626 (R(int) = 0.0427) |
| Completeness to θ | 26.32° | 26.32° | 26.32° |
| Absorption correction | Multi-scan | Multi-scan | Multi-scan |
| Refinement method | Full-matrix least-squares on F2 | Full-matrix least-squares on F2 | Full-matrix least-squares on F2 |
| Data/restraints/parameters | 3726/0/215 | 3576/0/201 | 3626/0/203 |
| Goodness-of-fit on F2 | 1.042 | 1.007 | 1.055 |
| Final R indices [I > 2σ(I)] | R1 = 0.0841, wR2 = 0.1760 | R1 = 0.0553, wR2 = 0.1094 | R1 = 0.0889, wR2 = 0.2249 |
| R indices (all data) | R1 = 0.0984, wR2 = 0.2032 | R1 = 0.1141, wR2 = 0.1298 | R1 = 0.1151, wR2 = 0.2422 |
The existence of thione form in the ligands is confirmed by the C![[double bond, length as m-dash]](https://www.rsc.org/images/entities/char_e001.gif) S bond lengths, which are of 1.696 (3) Å, 1.677 (3) Å and 1.671 (4) Å for H2L1, H2L2 and H2L3 respectively and the bond length of C
S bond lengths, which are of 1.696 (3) Å, 1.677 (3) Å and 1.671 (4) Å for H2L1, H2L2 and H2L3 respectively and the bond length of C![[double bond, length as m-dash]](https://www.rsc.org/images/entities/char_e001.gif) N group (C(2)–N(3) = 1.289(3) Å for H2L1, C(3)–N(3) = 1.285(3) Å for H2L2, C(4)–N(3) = 1.273(5) Å for H2L3) is in agreement with a formal C
N group (C(2)–N(3) = 1.289(3) Å for H2L1, C(3)–N(3) = 1.285(3) Å for H2L2, C(4)–N(3) = 1.273(5) Å for H2L3) is in agreement with a formal C![[double bond, length as m-dash]](https://www.rsc.org/images/entities/char_e001.gif) N bond length.36 In the ligands H2L1–3, the thione sulfur atom S(1) is trans to the N(3) nitrogen atom of C
N bond length.36 In the ligands H2L1–3, the thione sulfur atom S(1) is trans to the N(3) nitrogen atom of C![[double bond, length as m-dash]](https://www.rsc.org/images/entities/char_e001.gif) N group about C(1)–N(2) bond, this structural arrangement corresponds to E-isomer, which is confirmed by a torsion angle of S(1)–C(1)–N(2)–N(3) bond, 179.6(2) for H2L1, 178.1(2) for H2L2 and 176.6(3) for H2L3. The bond distances in the 3-acetyl-7-methoxy-4(N)-thiosemicarbazones H2L1–3 agree well with the values observed for other thiosemicarbazones.27,37,38
N group about C(1)–N(2) bond, this structural arrangement corresponds to E-isomer, which is confirmed by a torsion angle of S(1)–C(1)–N(2)–N(3) bond, 179.6(2) for H2L1, 178.1(2) for H2L2 and 176.6(3) for H2L3. The bond distances in the 3-acetyl-7-methoxy-4(N)-thiosemicarbazones H2L1–3 agree well with the values observed for other thiosemicarbazones.27,37,38
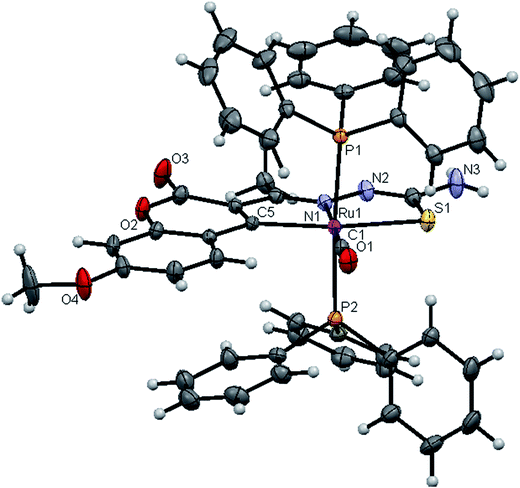
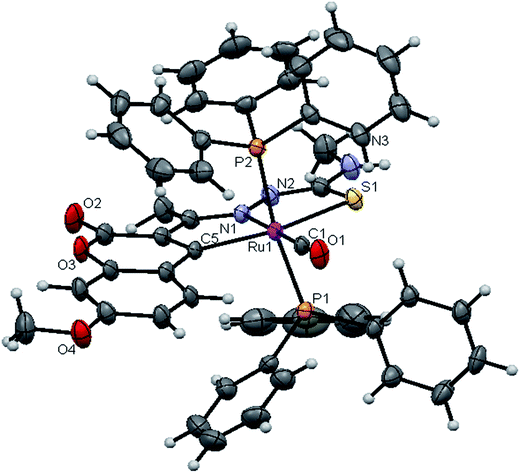
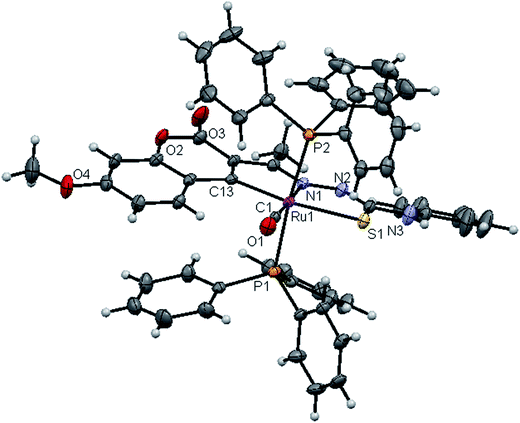
![[1 with combining macron]](https://www.rsc.org/images/entities/char_0031_0304.gif) space group. In the complexes, the ligands coordinated to the ruthenium ion through the N(1) nitrogen, pyrone carbon C(3) and thiolate sulphur atoms, forming two five member chelate rings with a bite angle N(1)–Ru(1)–S(1) of 78.39(6)° for complex 1, 78.90(1)° for complex 2, 79.38(6)° for complex 4, and a bite angle of C(5)–Ru(1)–N(1) of 78.58(8)° for complex 1, 78.10(2)° for complex 2, C(13)–Ru(1)–N(1) of 78.18(9)° for complex 4. The fourth site is occupied by the carbon atom of the carbonyl group to form a CNSC square-plane. The carbonyl group occupied the site trans to the N1 nitrogen, which is confirmed from the bond angle N(1)–Ru(1)–C(1) of 179.0(1)° for complex 1, 177.5(2)° for complex 2, and 178.10(2)° for complex 4 and bond length of Ru(1)–C(1) distances of 1.846(2) Å for complex 1, 1.853(4) Å for complex 2 and 1.848(2) Å for complex 4 found similar to the reported complexes.29 The remaining axial coordination sites are filled up by phosphorous atoms of two triphenylphosphine ligands, which are mutually trans to each other with Ru(1)–P(1) and Ru(1)–P(2) distances of 2.379(8) Å and 2.376(8) Å for complex 1, 2.365(1) Å and 2.383(1) Å for complex 2 and 2.376(8) Å and 2.376(8) Å for complex 4 and are slightly bent towards the carbonyl group due to the steric requirements of somewhat bulky chelating ligand, causing a slight deviation from a linear trans arrangement, which is evident from the bond angle of P(1)–Ru(1)–C(1) 89.41(8)° for complex 1, 88.3(1)° for complex 2, 90.17(8)° for complex 4, are smaller than bond angle of P(1)–Ru(1)–N(1) = 90.25(6)° for complex 1, P(1)–Ru(1)–N(1) = 93.3(1)° for complex 2, P(1)–Ru(1)–N(1) = 90.94(6)° for complex 4, and P(2)–Ru(1)–N(1) = 93.40(6)° for complex 1, P(2)–Ru(1)–N(1) = 89.2(1)° for complex 2, P(2)–Ru(1)–N(1) = 89.94(6)° for complex 4. The observed bond distances of Ru–P are comparable with those found in other reported ruthenium complexes containing triphenylphosphine.7,29,30,39–41 The bond distances of Ru(1)–P(1) and Ru(1)–P(2) are comparatively longer than those observed for basal planar bonds, such as Ru(1)–N(1) [2.077–2.097 Å], Ru(1)–Cpyrone [2.062–2.077 Å] and Ru(1)–C(1) [1.851–1.87 Å]. Due to the variation in the bond length and bond angles, ruthenium(II) ion sitting in a CNOSP2 coordination environment and adopted a distorted octahedral geometry. The selected bond distances of complexes (1, 2 and 4) such as Ru–P, Ru–O, Ru–S, Ru–N and Ru–C and bond angles agree very well with the similar reported ruthenium(II) complexes.7,29–31,37,39–41
space group. In the complexes, the ligands coordinated to the ruthenium ion through the N(1) nitrogen, pyrone carbon C(3) and thiolate sulphur atoms, forming two five member chelate rings with a bite angle N(1)–Ru(1)–S(1) of 78.39(6)° for complex 1, 78.90(1)° for complex 2, 79.38(6)° for complex 4, and a bite angle of C(5)–Ru(1)–N(1) of 78.58(8)° for complex 1, 78.10(2)° for complex 2, C(13)–Ru(1)–N(1) of 78.18(9)° for complex 4. The fourth site is occupied by the carbon atom of the carbonyl group to form a CNSC square-plane. The carbonyl group occupied the site trans to the N1 nitrogen, which is confirmed from the bond angle N(1)–Ru(1)–C(1) of 179.0(1)° for complex 1, 177.5(2)° for complex 2, and 178.10(2)° for complex 4 and bond length of Ru(1)–C(1) distances of 1.846(2) Å for complex 1, 1.853(4) Å for complex 2 and 1.848(2) Å for complex 4 found similar to the reported complexes.29 The remaining axial coordination sites are filled up by phosphorous atoms of two triphenylphosphine ligands, which are mutually trans to each other with Ru(1)–P(1) and Ru(1)–P(2) distances of 2.379(8) Å and 2.376(8) Å for complex 1, 2.365(1) Å and 2.383(1) Å for complex 2 and 2.376(8) Å and 2.376(8) Å for complex 4 and are slightly bent towards the carbonyl group due to the steric requirements of somewhat bulky chelating ligand, causing a slight deviation from a linear trans arrangement, which is evident from the bond angle of P(1)–Ru(1)–C(1) 89.41(8)° for complex 1, 88.3(1)° for complex 2, 90.17(8)° for complex 4, are smaller than bond angle of P(1)–Ru(1)–N(1) = 90.25(6)° for complex 1, P(1)–Ru(1)–N(1) = 93.3(1)° for complex 2, P(1)–Ru(1)–N(1) = 90.94(6)° for complex 4, and P(2)–Ru(1)–N(1) = 93.40(6)° for complex 1, P(2)–Ru(1)–N(1) = 89.2(1)° for complex 2, P(2)–Ru(1)–N(1) = 89.94(6)° for complex 4. The observed bond distances of Ru–P are comparable with those found in other reported ruthenium complexes containing triphenylphosphine.7,29,30,39–41 The bond distances of Ru(1)–P(1) and Ru(1)–P(2) are comparatively longer than those observed for basal planar bonds, such as Ru(1)–N(1) [2.077–2.097 Å], Ru(1)–Cpyrone [2.062–2.077 Å] and Ru(1)–C(1) [1.851–1.87 Å]. Due to the variation in the bond length and bond angles, ruthenium(II) ion sitting in a CNOSP2 coordination environment and adopted a distorted octahedral geometry. The selected bond distances of complexes (1, 2 and 4) such as Ru–P, Ru–O, Ru–S, Ru–N and Ru–C and bond angles agree very well with the similar reported ruthenium(II) complexes.7,29–31,37,39–41
| Identification code | [Ru(7-MAC-tsc)(CO)(PPh3)2] (1) | [Ru(7-MAC-mtsc)(CO)(PPh3)2] (2) | [Ru(7-MAC-ptsc)(CO)(PPh3)2] (4) |
| Empirical formula | C50H41N3O4P2RuS·CH3OH | C51H43N3O4P2RuS | C56H45N3O4P2RuS |
| Formula weight | 974.97 | 956.95 | 1019.02 |
| Temperature | 295(2) K | 295(2) K | 295(2) K |
| Wavelength | 0.7107 Å | 0.7107 Å | 0.7107 Å |
| Crystal system | Triclinic | Triclinic | Triclinic |
| Space group | P![[1 with combining macron]](https://www.rsc.org/images/entities/char_0031_0304.gif) |
P![[1 with combining macron]](https://www.rsc.org/images/entities/char_0031_0304.gif) |
P![[1 with combining macron]](https://www.rsc.org/images/entities/char_0031_0304.gif) |
| Unit cell dimensions | |||
| a | 13.0569 (5) Å | 12.2016 (7) Å | 13.3038 (5) Å |
| B | 13.7232 (5) Å | 13.4519 (7) Å | 13.4870 (5) Å |
| C | 13.8479 (5) Å | 15.1541 (9) Å | 14.3074 (5) Å |
| α | 89.094 (3)° | 82.857 (4)° | 85.881 (5)° |
| β | 75.301 (3)° | 79.550 (5)° | 85.582 (5)° |
| γ | 70.576 (3)° | 65.934 (5)° | 69.949 (3)° |
| Volume | 2257.10 (15) Å3 | 2229.9 (2) Å3 | 2401.56 (16) Å3 |
| Z | 2 | 2 | 2 |
| Density | 1.435 mg m−3 | 1.425 mg m−3 | 1.409 mg m−3 |
| Absorption coefficient | 0.516 mm−1 | 0.520 mm−1 | 0.487 mm−1 |
| F(000) | 1004 | 984 | 1048 |
| Crystal size | 0.02 × 0.15 × 0.24 mm | 0.08 × 0.22 × 0.26 mm | 0.01 × 0.13 × 0.31 mm |
| Crystal shape | Plate | Plate | Plate |
| θ range for data collection | 3.793 to 28.999° | 3.605 to 28.757° | 3.857 to 29.163° |
| Limiting indices | −15 ≤ h ≤ 17, −17 ≤ k ≤ 18, −14 ≤ l ≤ 18 | −15 ≤ h ≤ 16, −17 ≤ k ≤ 18, −18 ≤ l ≤ 19 | −17 ≤ h ≤ 17, −18 ≤ k ≤ 18, −19 ≤ l ≤ 15 |
| Reflections collected | 8354 | 7740 | 8210 |
| Independent reflections | 10![[thin space (1/6-em)]](https://www.rsc.org/images/entities/char_2009.gif) 636 (R(int) = 0.0334) 636 (R(int) = 0.0334) |
10![[thin space (1/6-em)]](https://www.rsc.org/images/entities/char_2009.gif) 577 (R(int) = 0.067) 577 (R(int) = 0.067) |
11![[thin space (1/6-em)]](https://www.rsc.org/images/entities/char_2009.gif) 129 (R(int) = 0.0376) 129 (R(int) = 0.0376) |
| Completeness to θ | 26.32° | 26.32° | 26.32° |
| Absorption correction | Multi-scan | Multi-scan | Multi-scan |
| Refinement method | Full-matrix least-squares on F2 | Full-matrix least-squares on F2 | Full-matrix least-squares on F2 |
| Data/restraints/parameters | 10![[thin space (1/6-em)]](https://www.rsc.org/images/entities/char_2009.gif) 636/0/580 636/0/580 |
10![[thin space (1/6-em)]](https://www.rsc.org/images/entities/char_2009.gif) 577/0/562 577/0/562 |
11![[thin space (1/6-em)]](https://www.rsc.org/images/entities/char_2009.gif) 129/0/610 129/0/610 |
| Goodness-of-fit on F2 | 1.034 | 1.092 | 1.016 |
| Final R indices [I > 2σ(I)] | R1 = 0.0390, wR2 = 0.0833 | R1 = 0.0839, wR2 = 0.2024 | R1 = 0.0425, wR2 = 0.0824 |
| R indices (all data) | R1 = 0.0582, wR2 = 0.0924 | R1 = 0.1085, wR2 = 0.2330 | R1 = 0.0689, wR2 = 0.0916 |
While dealing with the hydrogen-bonding interactions, in the complexes 2 and 4, we found the donor–acceptor distance (2.954 for (2), 3.054 Å for (4)) corresponding to the O(4)–O(4) bond between the carbonyl oxygen atom of the first molecule and with the second molecule. This interaction gave a pseudo binuclear structural appearance to the complex (2) and (4) (Fig. S23–S24; Table S2†).
DNA binding studies
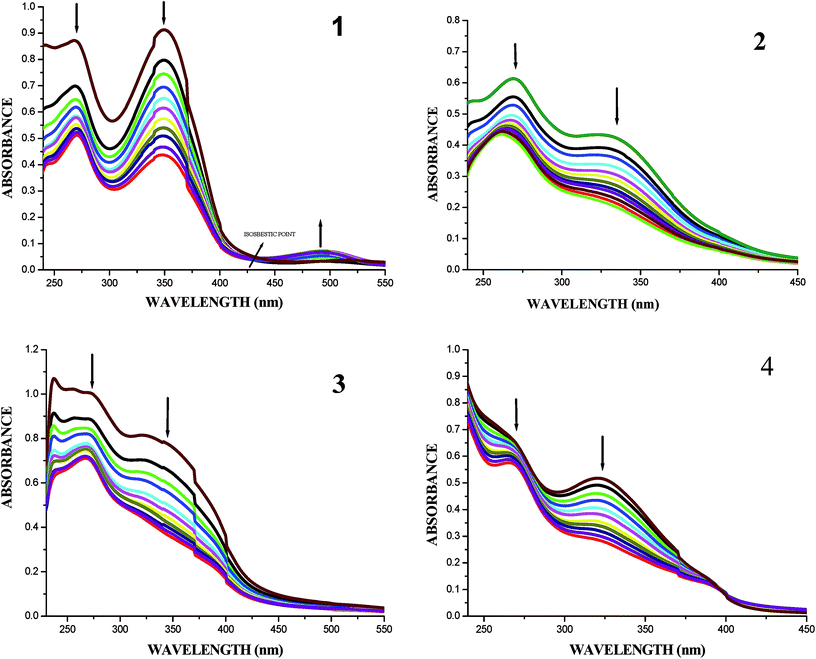 | ||
| Fig. 7 Absorption titration spectra of complexes (1–4) with increasing concentrations (2.5–25 μM) of CT-DNA (Tris–HCl buffer, pH 7.2). | ||
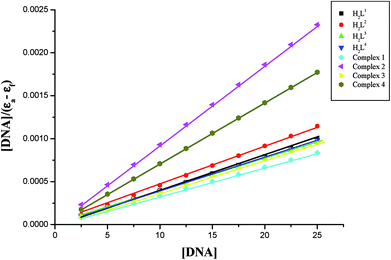
In order to compare the DNA-binding affinities of the ligands and their metal complexes quantitatively, their intrinsic binding constants Kbin were obtained according to eqn (S1).† The binding constant value was calculated from the plot of [DNA]/(εa − εf) versus [DNA] and the data were given in Table 3 (Fig. 8). From the results, the intrinsic DNA-binding constants Kbin were found to be in the order Complex 3 > Complex 2 > Complex 1 > Complex 4 > H2L3 > H2L2 > H2L1 > H2L4. This may be due to the presence of different substituents in the terminal nitrogen atom of the ligands. These results are comparable with earlier reports describing the intercalative mode of various ruthenium intercalators.30,31,44
| Compounds | Binding constant Kbin (M−1) | Quenching constant KSV (M−1) |
|---|---|---|
| H2L1 | 2.1246 ± 0.308 × 10⁵ | 2.79 ± 0.005 × 10³ |
| H2L2 | 3.4346 ± 0.306 × 10⁵ | 3.14 ± 0.002 × 10³ |
| H2L3 | 7.1852 ± 0.304 × 10⁵ | 3.95 ± 0.009 × 10³ |
| H2L4 | 2.1058 ± 0.288 × 10⁵ | 2.91 ± 0.005 × 10³ |
| Complex 1 | 1.2544 ± 0.304 × 10⁶ | 4.16 ± 0.002 × 10³ |
| Complex 2 | 1.3958 ± 0.320 × 10⁶ | 5.52 ± 0.009 × 10³ |
| Complex 3 | 1.4428 ± 0.279 × 10⁶ | 5.62 ± 0.003 × 10³ |
| Complex 4 | 1.0636 ± 0.334 × 10⁶ | 4.00 ± 0.002 × 10³ |
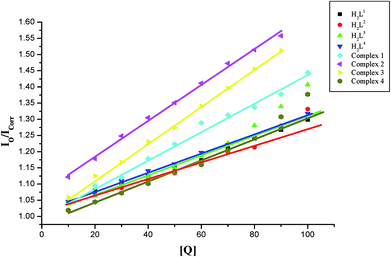
Further quantitative measurement of the magnitude of interaction was ascertained by the classical Stern–Volmer equation. Quenching constant KSV is used to evaluate the quenching efficiency and is obtained from the slope of Io/I versus [Q] (Fig. 9) and given in Table 3. The experimental results showed that all the Ru(II) complexes bind to DNA more strongly than their free ligands and the quenching constant value increased in the order 3 > 2 > 1 > 4 which also validated the electronic absorption spectral results. Further, the calculated KSV values of the compounds are significant when compared to the reported values.30,31
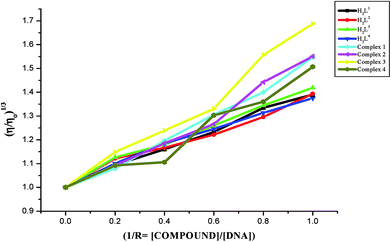
On the basis of above spectroscopic studies along with the viscosity measurements, it is revealed that the ligands and their organoruthenium(II) complexes can bind to CT DNA via an intercalative mode and the new Ru(II) complexes bind to CT DNA strongly than their free ligands alone.
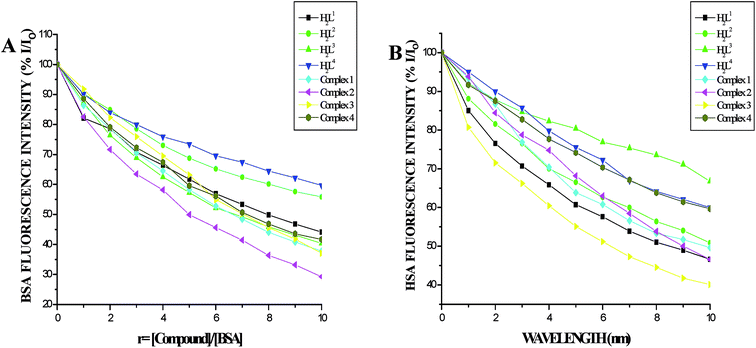 | ||
| Fig. 12 (A) Plot of % relative fluorescence intensity (% I/Io) vs. r (r = [compound]/[BSA]) (B) plot of % relative fluorescence intensity (% I/Io) vs. r (r = [compound]/[HSA]). | ||
| Compounds | Stern–Volmer KSV/M−1 | Quenching constant kq/M−1 s−1 | Binding constant Kbin/M−1 | n |
|---|---|---|---|---|
| BSA | ||||
| (H2L1) | 1.193 ± 0.024 × 10⁴ | 1.193 ± 0.024 × 10¹² | 1.971 ± 0.042 × 10³ | 0.8075 ± 0.029 |
| (H2L2) | 7.730 ± 0.009 × 10³ | 0.773 ± 0.009 × 10¹² | 3.003 ± 0.010 × 10³ | 0.8915 ± 0.011 |
| (H2L3) | 1.464 ± 0.018 × 10⁴ | 1.464 ± 0.018 × 10¹² | 14.11 ± 0.030 × 10³ | 0.9947 ± 0.010 |
| (H2L4) | 6.660 ± 0.012 × 10³ | 0.666 ± 0.012 × 10¹² | 1.111 ± 0.018 × 10³ | 0.8039 ± 0.021 |
| Complex 1 | 1.674 ± 0.040 × 10⁴ | 1.674 ± 0.040 × 10¹² | 2.251 ± 0.029 × 10⁴ | 1.0408 ± 0.030 |
| Complex 2 | 2.382 ± 0.011 × 10⁴ | 2.382 ± 0.011 × 10¹² | 3.323 ± 0.027 × 10⁴ | 1.0478 ± 0.031 |
| Complex 3 | 1.756 ± 0.080 × 10⁴ | 1.756 ± 0.080 × 10¹² | 17.49 ± 0.030 × 10⁴ | 1.266 ± 0.0290 |
| Complex 4 | 1.454 ± 0.030 × 10⁴ | 1.454 ± 0.030 × 10¹² | 2.178 ± 0.019 × 10⁴ | 1.0486 ± 0.019 |
![[thin space (1/6-em)]](https://www.rsc.org/images/entities/char_2009.gif) |
||||
| HSA | ||||
| (H2L1) | 1.073 ± 0.014 × 10⁴ | 1.073 ± 0.014 × 10¹² | 2.095 ± 0.036 × 10³ | 0.8166 ± 0.010 |
| (H2L2) | 0.909 ± 0.010 × 10⁴ | 0.909 ± 0.010 × 10¹² | 2.549 ± 0.016 × 10³ | 0.8599 ± 0.017 |
| (H2L3) | 1.424 ± 0.016 × 10⁴ | 1.424 ± 0.016 × 10¹² | 2.615 ± 0.019 × 10³ | 0.8130 ± 0.021 |
| (H2L4) | 0.377 ± 0.010 × 10⁴ | 0.377 ± 0.010 × 10¹² | 1.165 ± 0.018 × 10³ | 0.8702 ± 0.018 |
| Complex 1 | 0.741 ± 0.010 × 10⁴ | 0.741 ± 0.010 × 10¹² | 2.273 ± 0.017 × 10⁴ | 1.1329 ± 0.018 |
| Complex 2 | 1.088 ± 0.030 × 10⁴ | 1.088 ± 0.030 × 10¹² | 6.341 ± 0.039 × 10⁴ | 1.1859 ± 0.004 |
| Complex 3 | 1.189 ± 0.030 × 10⁴ | 1.189 ± 0.030 × 10¹² | 7.194 ± 0.041 × 10⁴ | 1.2027 ± 0.030 |
| Complex 4 | 0.675 ± 0.008 × 10⁴ | 0.675 ± 0.008 × 10¹² | 0.297 ± 0.024 × 10⁴ | 0.9118 ± 0.025 |
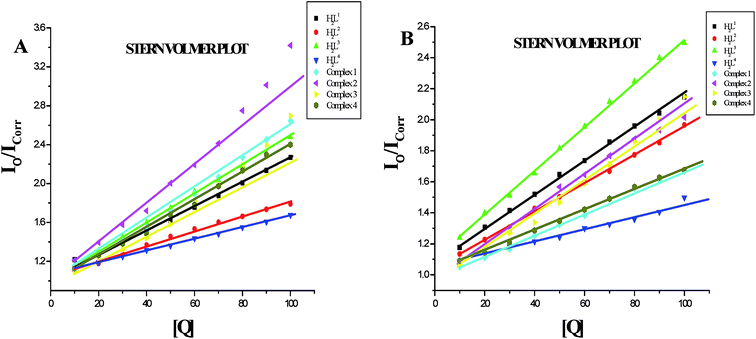
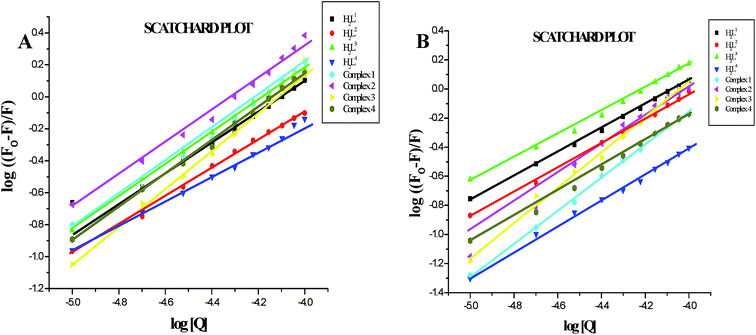
Furthermore, the equilibrium binding constant and number of binding sites were evaluated by using the Scatchard equation. The Kbin values were derived from the graph between log[(Fo − F)/F] and log[Q] (Fig. 14) and are given in Table 4. From the results, we confirmed that the Ru(II) complexes having a large hydrophobic area can interact more efficiently than the ligands with serum albumins via a static pathway. The higher binding affinity of the complexes over the ligands may be due to the efficient binding of protein moiety with the complexed metal ions. Here, the binding affinities of the complexes with serum albumins followed the same order as those with DNA binding studies, complex 3 > complex 2 > complex 1 > complex 4 > H2L3 > H2L2 > H2L1 > H2L4. Variation in the binding affinity of the compounds with serum albumins depends on the electron-donating ability of the ligand, i.e. the substitution on the N-terminal nitrogen atom. The binding capability of the compounds to serum albumins increased with the increase in electron-donating ability of the substituent on the terminal nitrogen of the coordinated thiosemicarbazone ligand. The obtained quenching constant and binding constant values of these new cyclometallated ruthenium(II) complexes agree well with those reported for other ruthenium(II) complexes.31,44,54–56
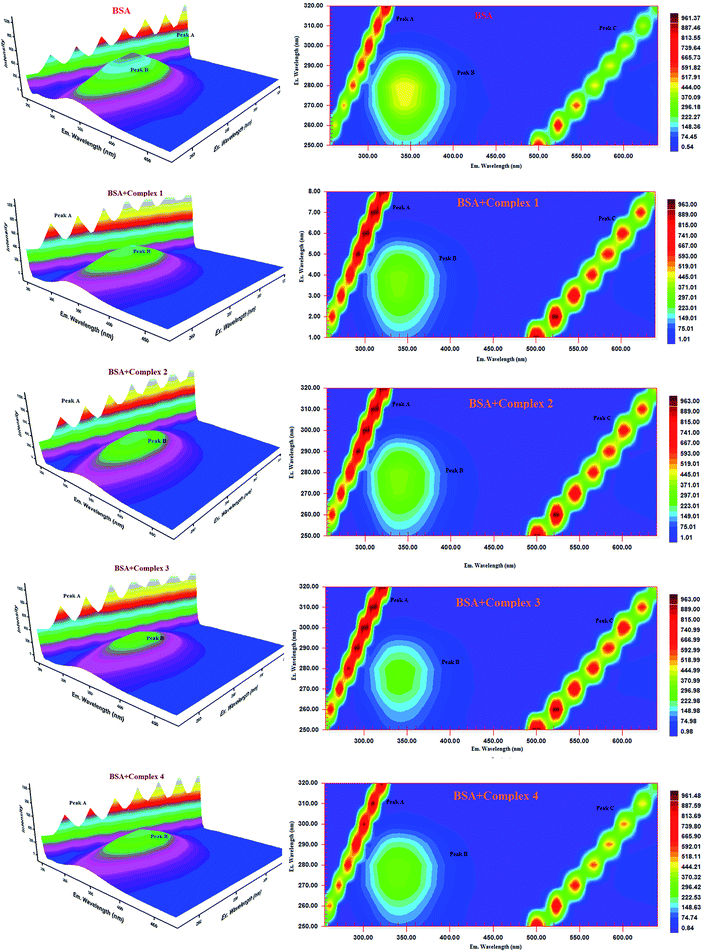 | ||
| Fig. 15 Three-dimensional fluorescence spectra of BSA in the absence and presence of ruthenium(II) complexes 1–4 (pH 7.4, 298 K, [BSA] = 10 μM, [complex] = 10 μM). | ||
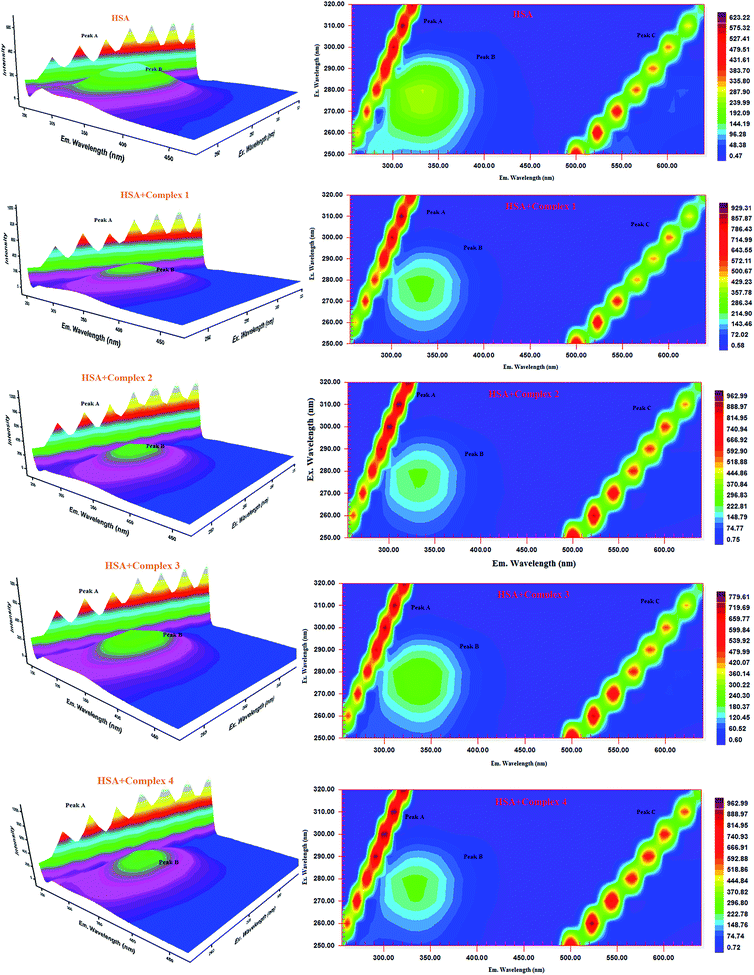 | ||
| Fig. 16 Three-dimensional fluorescence spectra of HSA in the absence and presence of ruthenium(II) complexes 1–4 (pH 7.4, 298 K, [HSA] = 10 μM, [complex] = 10 μM). | ||
| Compounds | Rayleigh scattering peaks | Fluorescence peaks | ||||
|---|---|---|---|---|---|---|
| Peak position λex/λem (nm nm−1) | Stokes Δλ (nm) | Intensity (F) | Peak position λex/λem (nm nm−1) | Stokes Δλ (nm) | Intensity (F) | |
| BSA | ||||||
| BSA | 280/280 | 0 | 637.73 | 280/343 | 63 | 514.37 |
| BSA + H2L1 | 280/280 | 0 | 681.98 | 280/340 | 60 | 436.40 |
| BSA + H2L2 | 280/280 | 0 | 704.90 | 280/342 | 62 | 437.11 |
| BSA + H2L3 | 280/280 | 0 | 764.34 | 280/342 | 62 | 415.28 |
| BSA + H2L4 | 280/280 | 0 | 751.37 | 280/342 | 62 | 486.41 |
| BSA + complex 1 | 280/280 | 0 | 867.32 | 280/338 | 58 | 395.56 |
| BSA + complex 2 | 280/280 | 0 | 837.83 | 280/339 | 59 | 372.76 |
| BSA + complex 3 | 280/280 | 0 | 958.23 | 280/339 | 59 | 304.43 |
| BSA + complex 4 | 280/280 | 0 | 741.59 | 280/340 | 60 | 368.76 |
![[thin space (1/6-em)]](https://www.rsc.org/images/entities/char_2009.gif) |
||||||
| HSA | ||||||
| HSA | 280/280 | 0 | 480.02 | 280/333 | 53 | 289.67 |
| HSA + H2L1 | 280/280 | 0 | 563.09 | 280/335 | 55 | 281.73 |
| HSA + H2L2 | 280/280 | 0 | 647.85 | 280/332 | 52 | 278.16 |
| HSA + H2L3 | 280/280 | 0 | 582.94 | 280/336 | 56 | 275.92 |
| HSA + H2L4 | 280/280 | 0 | 659.33 | 280/334 | 54 | 281.01 |
| HSA + complex 1 | 280/280 | 0 | 652.04 | 280/335 | 55 | 268.14 |
| HSA + complex 2 | 280/280 | 0 | 790.59 | 280/331 | 51 | 269.53 |
| HSA + complex 3 | 280/280 | 0 | 612.58 | 280/337 | 57 | 266.21 |
| HSA + complex 4 | 280/280 | 0 | 830.46 | 280/332 | 52 | 276.12 |
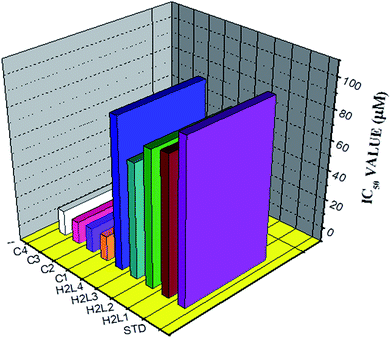 | ||
| Fig. 17 The DPPH radical scavenging activity of the ligands, [RuHClCO(PPh3)3] and new Ru(II) complexes. | ||
| Compounds | μg ascorbic acid equivalents/ml |
|---|---|
| H2L1 | 33.98 ± 0.29 |
| H2L2 | 37.10 ± 0.43 |
| H2L3 | 40.01 ± 0.27 |
| H2L4 | 32.90 ± 0.57 |
| [RuHClCO(PPh3)3] | 07.02 ± 0.08 |
| Complex 1 | 54.13 ± 0.28 |
| Complex 2 | 58.27 ± 0.46 |
| Complex 3 | 62.71 ± 0.37 |
| Complex 4 | 54.99 ± 0.65 |
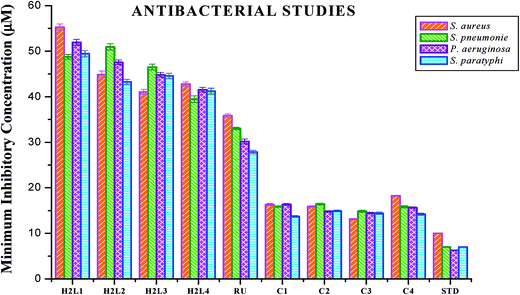 | ||
| Fig. 18 Antibacterial activity of ligands H2L1–4, [RuHClCO(PPh3)3] and new Ru(II) complexes (1–4). Error bars represent the standard deviation of the mean (n = 3). | ||
| Compounds | IC50 values (μM) | ||
|---|---|---|---|
| MCF-7 | A549 | HaCaT | |
| Cisplatin | 16.79 ± 0.08 | 15.10 ± 0.05 | >40 |
| H2L1 | 13.06 ± 0.29 | 12.64 ± 0.17 | >40 |
| H2L2 | 12.12 ± 0.32 | 12.12 ± 0.16 | >40 |
| H2L3 | 11.27 ± 0.21 | 11.63 ± 0.15 | >40 |
| H2L4 | 13.11 ± 0.25 | 13.83 ± 0.18 | >40 |
| [RuHClCO(PPh3)3] | 20.10 ± 0.18 | 15.96 ± 0.21 | >40 |
| Complex 1 | 2.86 ± 0.17 | 2.96 ± 0.07 | >40 |
| Complex 2 | 2.62 ± 0.07 | 2.93 ± 0.07 | >40 |
| Complex 3 | 2.53 ± 0.10 | 2.37 ± 0.04 | >40 |
| Complex 4 | 3.02 ± 0.05 | 3.05 ± 0.12 | >40 |
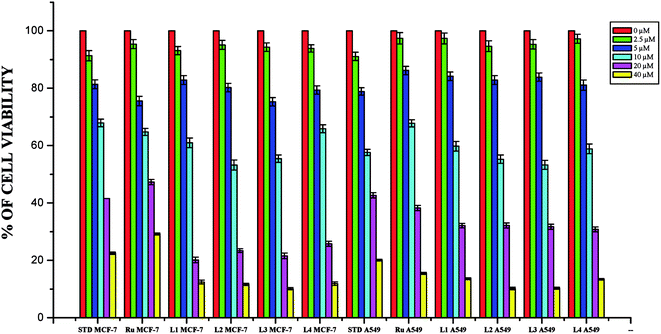
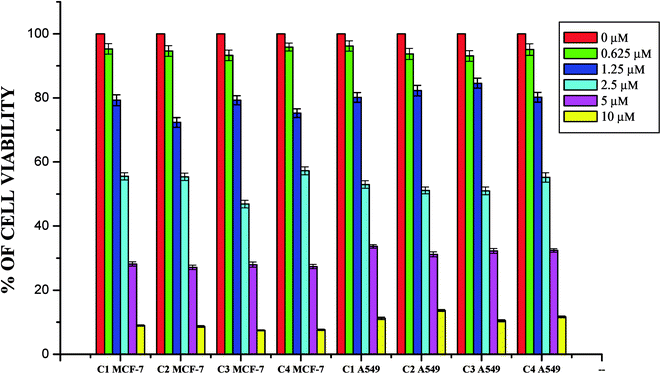
Whilst most of the Schiff bases did not display good anticancer activity, the coumarin appended thiosemicarbazones H2L1–4 against MCF-7 cell line exhibited IC50 values of 13.06 ± 0.29 μM, 12.12 ± 0.32 μM, 11.27 ± 0.21 μM and 13.11 ± 0.25 μM respectively, which were lower than that of cisplatin, indicating ligands showed good activity over cisplatin. Against the human breast cancer cell line MCF-7, the antiproliferative activity of Ru(II) complexes 1–4 was higher than that of their parent ligands and cisplatin with lower IC50 values of 2.86 ± 0.17 for complex 1, 2.62 ± 0.07 for complex 2, 2.53 ± 0.10 for complex 3 and 3.02 ± 0.05 for complex 4.
The ligands H2L1–4 and complexes exhibited high cytotoxic effects on lung cancer cells with low IC50 values indicating their efficiency in killing cancer cells even at low concentrations. In A549, the anticancer activity of the compounds follows the order ruthenium precursor (15.96 ± 0.21) < cisplatin (15.10 ± 0.05) < H2L4 (13.83 ± 0.18) < H2L1 (12.64 ± 0.24) < H2L2 (12.12 ± 0.16) < H2L3 (11.63 ± 0.15) < complex 4 (3.05 ± 0.12) < complex 1 (2.96 ± 0.07) < complex 2 (2.93 ± 0.07) < complex 3 (2.37 ± 0.04).
From this study, we concluded that the coumarin-appended Schiff base derivatives had potent activity than cisplatin used to treat human breast cancer and human lung cancer. In addition, the coordination of the ligands to the Ru(II) ion increases the anticancer activity of the complexes to six times greater than the ligands and eight times greater than the cisplatin against both the cell lines. Thus, the presence of the substituent at N-terminal nitrogen seems to be important for varying the order of activity of the compounds. In both MCF-7 and A549 cell lines, ruthenium(II) complex 3 containing more electron donating ethyl group at N-terminal nitrogen exhibited high activity followed by complex 2 (NH–Me), complex 1 (NH–H) and complex 4, which has electron withdrawing phenyl group at terminal nitrogen atom of the ligand. On the basis of the results, the antiproliferative activity of these compounds has been arranged in the order 3 > 2 > 1 > 4 > H2L3 > H2L2 > H2L1 > H2L4. Interestingly, this observation is in agreement with their previous biological studies, suggesting that the anticancer activities of the tested compounds against cancer cell lines may be related to their ability to intercalate the base pairs of the DNA and/or their free radical scavenging activity.
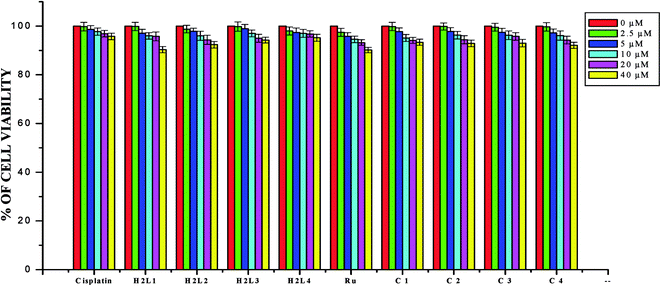
In order to investigate the selectivity of the compounds for cancer cells rather than normal cell lines, the compounds were also screened for their anticancer activity on the human normal keratinocyte cells (HaCaT). In the noncancerous cell line, all the compounds showed their nontoxic nature. Furthermore, the IC50 values exhibited by the complexes showed a higher cytotoxic effect when compared to the other reported Ru(II) complexes.24,26,30,31,44,66,67
Conclusion
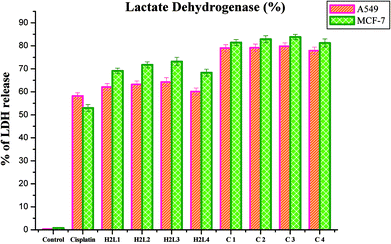
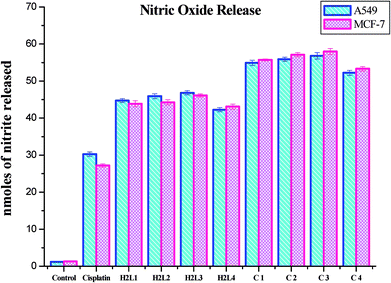
A series of ligands 3-acetyl-7-methoxycoumarin-4N-substituted thiosemicarbazones were prepared and consecutively made to undergo complexation with ruthenium precursor [RuHCl(CO)(PPh3)3]. The reactions ended up in cyclometallated organometallic Ru(II) complexes. Analytical and spectral studies accounted for the formation of the complexes. The ligands acted in a tridendate manner by bonding through C, N and S atoms. A systematic study on their DNA/protein binding properties and antioxidant activities was carried out. Experimental results suggest that the ligands and complexes can bind to DNA via an intercalation mode and a static quenching with proteins. Evaluation of their inhibitory potency against bacterial and fungal pathogens revealed that the compounds possess a good spectrum of antimicrobial activity. The in vitro cytotoxic activity of the complexes was ascertained via MTT assay and the IC50 values were found in the range of 2.53 ± 0.10–3.02 ± 0.05 μM and 2.37 ± 0.04–3.05 ± 0.12 μM for MCF-7 and A549 cancerous cell lines, respectively. Moreover, LDH and NO release assays confirm the anticancer potential of the tested compounds. The results validated that complex 3 is a potent chemotherapeutic drug among others. This may be attributed to the more electron donating ability of the N-terminal ethyl group. In addition, the present investigation lights up the potent antiproliferative effect of ruthenium complexes by inhibiting the viability of A549 and MCF-7 cells. Hence, further studies on animal models to elucidate the clear mechanism of action of the complexes are highly warranted to unveil the ruthenium complexes as anticancer drugs.Experimental section
Materials and methods
All the reagents used were of analytically or chemically pure grade. Solvents were purified and dried according to standard procedures.69 The metal precursor [RuHCl(CO)(PPh3)3]70 and 3-acetyl-7-methoxy-chromene-2-one (3-acetyl-7-methoxy coumarin)71 were prepared according to the literature procedure. Doubly distilled water was used to prepare buffers. Ethidium bromide (EB), serum albumins (BSA/HSA), calf thymus DNA (CT-DNA) and 3-(4,5-dimethyl thiazol-2-yl)-2,5-diphenyltetrazolium bromide (MTT) were purchased from HiMedia (Mumbai, India) and used as received. Human lung cancer cell lines A549, human breast cancer cell lines MCF-7 and human normal keratinocyte cells (HaCaT) were obtained from the National Center for Cell Science (NCCS), Pune, India. Melting points were measured in a Lab India apparatus. Infrared spectra were measured as KBr pellets on a JASCO FT-IR 4100 instrument between 400–4000 cm−1. Elemental analysis of carbon, hydrogen, nitrogen and sulfur was determined by using Vario EL III CHNS at the Department of Chemistry, Bharathiar University, Coimbatore, India. The electronic spectra of the compounds were recorded with a JASCO V-630 spectrophotometer using DMSO as the solvent in 800–200 nm range. Emission spectra were recorded by using JASCO FP 6600 Spectrofluorimeter. 1H NMR spectra were recorded in DMSO at room temperature with a Bruker 400 MHz instrument, chemical shift relative to tetramethylsilane. The stability of the compounds was performed in 1% aqueous DMSO and phosphate buffer–DMSO (99![[thin space (1/6-em)]](https://www.rsc.org/images/entities/char_2009.gif) :
:![[thin space (1/6-em)]](https://www.rsc.org/images/entities/char_2009.gif) 1). The stability was analyzed by monitoring the electronic spectra over 24 h at room temperature on a JASCO 4100 spectrophotometer.
1). The stability was analyzed by monitoring the electronic spectra over 24 h at room temperature on a JASCO 4100 spectrophotometer.
X-ray crystallography
Suitable single crystals for the ligands H2L1–3 and complexes (1, 2 and 4) were obtained from methanol and dichloromethane/methanol medium respectively. Single crystal data collections and corrections for the ligands (H2L1–3) and new Ru(II) complexes (1, 2 and 4) were carried out with a Gemini Xcaliber Atlas four circle diffractometer using graphite monochromated Mo Kα (λ = 0.71073 Å) radiation at 295 K. All the calculations were done by using SHELXS-200, SHELXL-2015/7 and Olex-2 programs.72Preparation of 3-acetyl-7-methoxy-2H-chromen-2-one71
An ethanolic solution (10 cm3) of 4-methoxysalicylaldehyde (1.22 g, 1 mmol) was taken along with the catalytic amount of piperidine and ethylacetoacetate (1.95 g, mmol) and was refluxed for 5 h with continuous stirring. The reaction mixture was then cooled to room temperature, which afforded yellow precipitate. The crude product was filtered, washed with ethanol (3 × 10 cm3) and recrystallized from ethanol to yield an yellow crystalline product. Yield = 89%. Mp 118–120 °C; anal. calcd for C12H10O4: C, 66.11; H, 4.63; found: C, 66.08; H, 4.61; UV-Vis (DMSO), λmax (ε): 354 (26![[thin space (1/6-em)]](https://www.rsc.org/images/entities/char_2009.gif) 868) nm (dm3 mol−1 cm−1); IR (ν, cm−1): ν(C
868) nm (dm3 mol−1 cm−1); IR (ν, cm−1): ν(C![[double bond, length as m-dash]](https://www.rsc.org/images/entities/char_e001.gif) O lactone) 1731, ν(C
O lactone) 1731, ν(C![[double bond, length as m-dash]](https://www.rsc.org/images/entities/char_e001.gif) O acetyl group) 1681. 1H NMR (400 MHz, DMSO-d6, δ ppm, J Hz): δ 8.628 (s, 1H, C4–H), δ 7.857–7.877 (d, J = 8, 1H, C8–H), δ 6.996–7.057 (m, 2H, C5–H and C6–H), δ 3.894 (s, 3H, −OCH3), δ 2.573 (s, 3H, −CH3).
O acetyl group) 1681. 1H NMR (400 MHz, DMSO-d6, δ ppm, J Hz): δ 8.628 (s, 1H, C4–H), δ 7.857–7.877 (d, J = 8, 1H, C8–H), δ 6.996–7.057 (m, 2H, C5–H and C6–H), δ 3.894 (s, 3H, −OCH3), δ 2.573 (s, 3H, −CH3).
Synthesis of ((1E)-1-(1-(7-methoxy-2-oxo-2H-chromen-3-yl)ethylidene) thiosemicarbazone) [H2-7MAC-tsc] (H2L1)71
Thiosemicarbazide (0.417 g, 4.58 mmol) was dissolved in 30 cm3 of methanol with continuous stirring and gently heated for a period of 30 min. This was added to a methanolic solution (20 cm3) of 3-acetyl-7-methoxy-2H-chromen-2-one (1 g, 4.58 mmol). To this, few drops of glacial acetic acid were added and the mixture was refluxed for 2 h with continuous stirring. The mixture was then cooled to room temperature whereby a yellow crystalline compound precipitated. This was collected by filtration, washed well with cold methanol and dried under vacuum. The compound was recrystallized from DMF–methanol (1![[thin space (1/6-em)]](https://www.rsc.org/images/entities/char_2009.gif) :
:![[thin space (1/6-em)]](https://www.rsc.org/images/entities/char_2009.gif) 9 v/v). Yellow colored fine single crystals suitable for X-ray analysis were collected. Yield: 72%. Mp: 213 °C. Anal. calcd for C13H13N3O3S: C, 53.58; H, 4.50; N, 14.42; S, 11.00. Found: C, 53.56; H, 4.47; N, 14.41; S, 11.00%. FT-IR (ν, cm−1) in KBr: ν(C
9 v/v). Yellow colored fine single crystals suitable for X-ray analysis were collected. Yield: 72%. Mp: 213 °C. Anal. calcd for C13H13N3O3S: C, 53.58; H, 4.50; N, 14.42; S, 11.00. Found: C, 53.56; H, 4.47; N, 14.41; S, 11.00%. FT-IR (ν, cm−1) in KBr: ν(C![[double bond, length as m-dash]](https://www.rsc.org/images/entities/char_e001.gif) O lactone) 1728, ν(C
O lactone) 1728, ν(C![[double bond, length as m-dash]](https://www.rsc.org/images/entities/char_e001.gif) N) 1644, ν(–NH2) 3279, ν(–NH) 3136, ν(C
N) 1644, ν(–NH2) 3279, ν(–NH) 3136, ν(C![[double bond, length as m-dash]](https://www.rsc.org/images/entities/char_e001.gif) S) 831. UV-Vis (DMSO), λmax (ε): 276 (20
S) 831. UV-Vis (DMSO), λmax (ε): 276 (20![[thin space (1/6-em)]](https://www.rsc.org/images/entities/char_2009.gif) 943) nm (dm3 mol−1 cm−1); 354 (30
943) nm (dm3 mol−1 cm−1); 354 (30![[thin space (1/6-em)]](https://www.rsc.org/images/entities/char_2009.gif) 488) nm (dm3 mol−1 cm−1). 1H NMR (400 MHz, DMSO-d6, δ ppm, J Hz): δ 7.986 (s, 1H, C4–H), δ 7.719–7.740 (d, 1H, J = 8.4, C5–H), 7.039–7.094 (m, 2H, Ar–H), δ 3.931 (s, 3H, –OCH3), δ 2.302 (s, 3H, –CH3), δ 10.424 (s, 1H, NH–C
488) nm (dm3 mol−1 cm−1). 1H NMR (400 MHz, DMSO-d6, δ ppm, J Hz): δ 7.986 (s, 1H, C4–H), δ 7.719–7.740 (d, 1H, J = 8.4, C5–H), 7.039–7.094 (m, 2H, Ar–H), δ 3.931 (s, 3H, –OCH3), δ 2.302 (s, 3H, –CH3), δ 10.424 (s, 1H, NH–C![[double bond, length as m-dash]](https://www.rsc.org/images/entities/char_e001.gif) S), δ 8.477 & 8.409 (2 br s, 2H, –NH2).
S), δ 8.477 & 8.409 (2 br s, 2H, –NH2).
The very similar method was followed to synthesize the following compounds.
Synthesis of ((1E)-1-(1-(7-methoxy-2-oxo-2H-chromen-3-yl)ethylidene) 4(N)-methyl thiosemicarbazone) [H2-7MAC-mtsc] (H2L2)
The ligand [H2-7MAC-mtsc] was prepared from 4-(N)-methylthiosemicarbazide (0.481 g, 4.58 mmol) and 3-acetyl-7-methoxy-2H-chromen-2-one (1 g, 4.58 mmol) in the presence of glacial acetic acid. Single crystals suitable for X-ray diffraction studies were obtained by recrystallisation of ligand H2L2 in methanol. Yield: 73%. Mp: 117 °C anal. calcd for C14H15N3O3S: C, 55.05; H, 4.96; N, 13.76; S, 10.49. Found: C, 55.03; H, 4.93; N, 13.71; S, 10.48%. FT-IR (ν, cm−1) in KBr: ν(C![[double bond, length as m-dash]](https://www.rsc.org/images/entities/char_e001.gif) O lactone) 1714, ν(C
O lactone) 1714, ν(C![[double bond, length as m-dash]](https://www.rsc.org/images/entities/char_e001.gif) N) 1608, ν(terminal –NH) 3262, ν(–NH) 3210, ν(C
N) 1608, ν(terminal –NH) 3262, ν(–NH) 3210, ν(C![[double bond, length as m-dash]](https://www.rsc.org/images/entities/char_e001.gif) S) 834. UV-Vis (DMSO), λmax (ε): 275 (24
S) 834. UV-Vis (DMSO), λmax (ε): 275 (24![[thin space (1/6-em)]](https://www.rsc.org/images/entities/char_2009.gif) 094) nm (dm3 mol−1 cm−1); 352 (33
094) nm (dm3 mol−1 cm−1); 352 (33![[thin space (1/6-em)]](https://www.rsc.org/images/entities/char_2009.gif) 647) nm (dm3 mol−1 cm−1). 1H NMR (400 MHz, DMSO-d6, δ ppm, J Hz): δ 8.314 (s, 1H, C4–H), δ 7.684–7.705 (d, J = 8.4, 1H, C5–H), 6.985–7.029 (m, 2H, Ar–H), δ 3.879 (s, 3H, –OCH3), δ 2.244 (s, 3H, –CH3), δ 10.377 (s, 1H, NH–C
647) nm (dm3 mol−1 cm−1). 1H NMR (400 MHz, DMSO-d6, δ ppm, J Hz): δ 8.314 (s, 1H, C4–H), δ 7.684–7.705 (d, J = 8.4, 1H, C5–H), 6.985–7.029 (m, 2H, Ar–H), δ 3.879 (s, 3H, –OCH3), δ 2.244 (s, 3H, –CH3), δ 10.377 (s, 1H, NH–C![[double bond, length as m-dash]](https://www.rsc.org/images/entities/char_e001.gif) S), δ 8.465–8.490 (q, 1H, terminal –NH), δ 3.027–3.037 (d, J = 4, 1H, terminal –NH–CH3).
S), δ 8.465–8.490 (q, 1H, terminal –NH), δ 3.027–3.037 (d, J = 4, 1H, terminal –NH–CH3).
Synthesis of ((1E)-1-(1-(7-methoxy-2-oxo-2H-chromen-3-yl)ethylidene) 4(N)-ethyl thiosemicarbazone) [H2-7MAC-etsc] (H2L3)
The ligand [H2-7MAC-etsc] was prepared from 4-(N)-ethylthiosemicarbazide (0.546 g, 4.58 mmol) and 3-acetyl-7-methoxy-2H-chromen-2-one (1 g, 4.58 mmol) in the presence of glacial acetic acid. The compound was recrystallised by using methanol to yield suitable yellow crystals for X-ray analysis. Yield: 76%. Mp: 174 °C. Anal. calcd for C15H17N3O3S: C, 56.40; H, 5.37; N, 13.15; S, 10.05. Found: C, 56.37; H, 5.34; N, 13.11; S, 10.01%. FT-IR (ν, cm−1) in KBr: ν(C![[double bond, length as m-dash]](https://www.rsc.org/images/entities/char_e001.gif) O lactone) 1725, ν(C
O lactone) 1725, ν(C![[double bond, length as m-dash]](https://www.rsc.org/images/entities/char_e001.gif) N) 1606, ν(terminal –NH) 3241, ν(–NH) 3155, ν(C
N) 1606, ν(terminal –NH) 3241, ν(–NH) 3155, ν(C![[double bond, length as m-dash]](https://www.rsc.org/images/entities/char_e001.gif) S) 835. UV-Vis (DMSO), λmax (ε): 276 (14
S) 835. UV-Vis (DMSO), λmax (ε): 276 (14![[thin space (1/6-em)]](https://www.rsc.org/images/entities/char_2009.gif) 245) nm (dm3 mol−1 cm−1); 353 (21
245) nm (dm3 mol−1 cm−1); 353 (21![[thin space (1/6-em)]](https://www.rsc.org/images/entities/char_2009.gif) 388) nm (dm3 mol−1 cm−1). 1H NMR (400 MHz, DMSO-d6, δ ppm, J Hz): δ 8.291 (s, 1H, C4–H), δ 7.694–7.715 (d, J = 8.4, 1H, C5–H), δ 7.679–7.034 (m, 2H, Ar–H), δ 3.881 (s, 3H, –OCH3), δ 2.247 (s, 3H, –CH3), δ 10.269 (s, 1H, NH–C
388) nm (dm3 mol−1 cm−1). 1H NMR (400 MHz, DMSO-d6, δ ppm, J Hz): δ 8.291 (s, 1H, C4–H), δ 7.694–7.715 (d, J = 8.4, 1H, C5–H), δ 7.679–7.034 (m, 2H, Ar–H), δ 3.881 (s, 3H, –OCH3), δ 2.247 (s, 3H, –CH3), δ 10.269 (s, 1H, NH–C![[double bond, length as m-dash]](https://www.rsc.org/images/entities/char_e001.gif) S), δ 8.472–8.499 (t, J = 5.6, 1H, terminal –NH), δ 3.593–3.622 (p, 2H, terminal –NH–CH2), δ 1.136–1.172 (t, J = 7.2, 3H, –CH3).
S), δ 8.472–8.499 (t, J = 5.6, 1H, terminal –NH), δ 3.593–3.622 (p, 2H, terminal –NH–CH2), δ 1.136–1.172 (t, J = 7.2, 3H, –CH3).
Synthesis of ((1E)-1-(1-(7-methoxy-2-oxo-2H-chromen-3-yl)ethylidene) 4(N)-phenyl thiosemicarbazone) [H2-7MAC-ptsc] (H2L4)
The ligand [H2-7MAC-ptsc] was prepared from 4-(N)-phenylthiosemicarbazide (0.766 g, 4.58 mmol) and 3-acetyl-7-methoxy-2H-chromen-2-one (1 g, 4.58 mmol) in the presence of glacial acetic acid. The compound was recrystallised by using methanol. Yield: 77%. Mp: 186 °C. Anal. calcd for C19H17N3O3S: C, 62.10; H, 4.67; N, 11.43; S, 8.72. Found: C, 62.07; H, 4.64; N, 11.4; S, 8.69%. FT-IR (ν, cm−1) in KBr: ν(C![[double bond, length as m-dash]](https://www.rsc.org/images/entities/char_e001.gif) O lactone) 1700, ν(C
O lactone) 1700, ν(C![[double bond, length as m-dash]](https://www.rsc.org/images/entities/char_e001.gif) N) 1600, ν(terminal –NH) 3241, ν(–NH) 3114, ν(C
N) 1600, ν(terminal –NH) 3241, ν(–NH) 3114, ν(C![[double bond, length as m-dash]](https://www.rsc.org/images/entities/char_e001.gif) S) 826. UV-Vis (DMSO), λmax (ε): 282 (27
S) 826. UV-Vis (DMSO), λmax (ε): 282 (27![[thin space (1/6-em)]](https://www.rsc.org/images/entities/char_2009.gif) 646) nm (dm3 mol−1 cm−1); 356 (41
646) nm (dm3 mol−1 cm−1); 356 (41![[thin space (1/6-em)]](https://www.rsc.org/images/entities/char_2009.gif) 701) nm (dm3 mol−1 cm−1). 1H NMR (400 MHz, DMSO-d6, δ ppm, J Hz): δ 8.458 (s, 1H, C4–H), δ 6.691–7.524 (m, 8H, Ar–H), δ 3.885 (s, 3H, –OCH3), δ 2.332 (s, 3H, –CH3), δ 10.777 (s, 1H, NH–C
701) nm (dm3 mol−1 cm−1). 1H NMR (400 MHz, DMSO-d6, δ ppm, J Hz): δ 8.458 (s, 1H, C4–H), δ 6.691–7.524 (m, 8H, Ar–H), δ 3.885 (s, 3H, –OCH3), δ 2.332 (s, 3H, –CH3), δ 10.777 (s, 1H, NH–C![[double bond, length as m-dash]](https://www.rsc.org/images/entities/char_e001.gif) S), δ 10.126 (s, 1H, terminal –NH).
S), δ 10.126 (s, 1H, terminal –NH).
Synthesis of new ruthenium(II) complexes
![[thin space (1/6-em)]](https://www.rsc.org/images/entities/char_2009.gif) :
:![[thin space (1/6-em)]](https://www.rsc.org/images/entities/char_2009.gif) 1 v/v) to yield red transparent needle like crystals suitable for X-ray analysis. Yield: 66%. Mp: 247 °C. Anal. calcd for C50H41N3O4P2RuS: C, 63.67; H, 4.39; N, 4.45; S, 3.39. Found: C, 63.64; H, 4.37; N, 4.42; S, 3.37%. FT-IR (ν, cm−1) in KBr: ν(C
1 v/v) to yield red transparent needle like crystals suitable for X-ray analysis. Yield: 66%. Mp: 247 °C. Anal. calcd for C50H41N3O4P2RuS: C, 63.67; H, 4.39; N, 4.45; S, 3.39. Found: C, 63.64; H, 4.37; N, 4.42; S, 3.37%. FT-IR (ν, cm−1) in KBr: ν(C![[double bond, length as m-dash]](https://www.rsc.org/images/entities/char_e001.gif) O lactone) 1685, ν(C
O lactone) 1685, ν(C![[double bond, length as m-dash]](https://www.rsc.org/images/entities/char_e001.gif) N) 1607, ν(C–S) 745, ν(C
N) 1607, ν(C–S) 745, ν(C![[triple bond, length as m-dash]](https://www.rsc.org/images/entities/char_e002.gif) O) 1918, 1436, 1090, 696 (for PPh3). UV-Vis (DMSO), λmax (ε): 337 (33
O) 1918, 1436, 1090, 696 (for PPh3). UV-Vis (DMSO), λmax (ε): 337 (33![[thin space (1/6-em)]](https://www.rsc.org/images/entities/char_2009.gif) 654) nm (dm3 mol−1 cm−1) (LMCT s → d). 1H NMR (400 MHz, DMSO-d6, δ ppm, J Hz): δ 7.150–7.547 (m, 31H, Ar–H), δ 6.290–6.444 (m, 2H, C6–H and C8–H), δ 3.842 (s, 3H, –OCH3), δ 1.977 (s, 3H, –CH3), δ 5.651 (br s, 2H, –NH2).
654) nm (dm3 mol−1 cm−1) (LMCT s → d). 1H NMR (400 MHz, DMSO-d6, δ ppm, J Hz): δ 7.150–7.547 (m, 31H, Ar–H), δ 6.290–6.444 (m, 2H, C6–H and C8–H), δ 3.842 (s, 3H, –OCH3), δ 1.977 (s, 3H, –CH3), δ 5.651 (br s, 2H, –NH2).A similar method was followed to synthesize other ruthenium(II) complexes.
![[double bond, length as m-dash]](https://www.rsc.org/images/entities/char_e001.gif) O lactone) 1680, ν(C
O lactone) 1680, ν(C![[double bond, length as m-dash]](https://www.rsc.org/images/entities/char_e001.gif) N) 1606, ν(C–S) 744, ν(C
N) 1606, ν(C–S) 744, ν(C![[triple bond, length as m-dash]](https://www.rsc.org/images/entities/char_e002.gif) O) 1925, 1404, 1087, 695 (for PPh3). UV-Vis (DMSO), λmax (ε): 268 (45
O) 1925, 1404, 1087, 695 (for PPh3). UV-Vis (DMSO), λmax (ε): 268 (45![[thin space (1/6-em)]](https://www.rsc.org/images/entities/char_2009.gif) 067) nm (dm3 mol−1 cm−1) (intraligand transition); 363 (20
067) nm (dm3 mol−1 cm−1) (intraligand transition); 363 (20![[thin space (1/6-em)]](https://www.rsc.org/images/entities/char_2009.gif) 485) nm (dm3 mol−1 cm−1) (LMCT s → d). 1H NMR (400 MHz, DMSO-d6, δ ppm, J Hz): δ 7.139–7.637 (m, 31H, Ar–H), δ 6.62–6.63 (m, 1H, C8–H), δ 6.87–6.90 (dd, 1H, J = 2.4, 8.8, C6–H), δ 3.842 (s, 3H, –OCH3), δ 2.098 (s, 3H, –CH3), δ 5.972–6.098 (q, 1H, terminal –NH), δ 1.221 (s, 3H, –NH–CH3).
485) nm (dm3 mol−1 cm−1) (LMCT s → d). 1H NMR (400 MHz, DMSO-d6, δ ppm, J Hz): δ 7.139–7.637 (m, 31H, Ar–H), δ 6.62–6.63 (m, 1H, C8–H), δ 6.87–6.90 (dd, 1H, J = 2.4, 8.8, C6–H), δ 3.842 (s, 3H, –OCH3), δ 2.098 (s, 3H, –CH3), δ 5.972–6.098 (q, 1H, terminal –NH), δ 1.221 (s, 3H, –NH–CH3).![[double bond, length as m-dash]](https://www.rsc.org/images/entities/char_e001.gif) O lactone) 1681, ν(C
O lactone) 1681, ν(C![[double bond, length as m-dash]](https://www.rsc.org/images/entities/char_e001.gif) N) 1606, ν(C–S) 745, ν(C
N) 1606, ν(C–S) 745, ν(C![[triple bond, length as m-dash]](https://www.rsc.org/images/entities/char_e002.gif) O) 1923, 1432, 1087, 695 (for PPh3). UV-Vis (DMSO), λmax (ε): 268 (16
O) 1923, 1432, 1087, 695 (for PPh3). UV-Vis (DMSO), λmax (ε): 268 (16![[thin space (1/6-em)]](https://www.rsc.org/images/entities/char_2009.gif) 367) nm (dm3 mol−1 cm−1) (intraligand transition); 357 (38
367) nm (dm3 mol−1 cm−1) (intraligand transition); 357 (38![[thin space (1/6-em)]](https://www.rsc.org/images/entities/char_2009.gif) 703) nm (dm3 mol−1 cm−1) (LMCT s → d). 1H NMR (400 MHz, DMSO-d6, δ ppm, J Hz): δ 7.216–7.634 (m, 31H, Ar–H), δ 6.644–6.921 (m, 2H, C6–H and C8–H), δ 3.774 (s, 3H, –OCH3), δ 1.887 (s, 3H, –CH3), δ 6.18–6.23 (t, 1H, terminal –NH), δ 1.126–1.288 (m, 2H, J = 4.8, –NH–CH2), δ 0.701–0.737 (t, 3H, J = 7.2, –CH2–CH3).
703) nm (dm3 mol−1 cm−1) (LMCT s → d). 1H NMR (400 MHz, DMSO-d6, δ ppm, J Hz): δ 7.216–7.634 (m, 31H, Ar–H), δ 6.644–6.921 (m, 2H, C6–H and C8–H), δ 3.774 (s, 3H, –OCH3), δ 1.887 (s, 3H, –CH3), δ 6.18–6.23 (t, 1H, terminal –NH), δ 1.126–1.288 (m, 2H, J = 4.8, –NH–CH2), δ 0.701–0.737 (t, 3H, J = 7.2, –CH2–CH3).![[double bond, length as m-dash]](https://www.rsc.org/images/entities/char_e001.gif) O lactone) 1681, ν(C
O lactone) 1681, ν(C![[double bond, length as m-dash]](https://www.rsc.org/images/entities/char_e001.gif) N) 1606, ν(C–S) 744, ν(C
N) 1606, ν(C–S) 744, ν(C![[triple bond, length as m-dash]](https://www.rsc.org/images/entities/char_e002.gif) O) 1920, 1431, 1089, 694 (for PPh3). UV-Vis (DMSO), λmax (ε): 278 (19
O) 1920, 1431, 1089, 694 (for PPh3). UV-Vis (DMSO), λmax (ε): 278 (19![[thin space (1/6-em)]](https://www.rsc.org/images/entities/char_2009.gif) 763) nm (dm3 mol−1 cm−1) (intraligand transition); 365 (10
763) nm (dm3 mol−1 cm−1) (intraligand transition); 365 (10![[thin space (1/6-em)]](https://www.rsc.org/images/entities/char_2009.gif) 531) nm (dm3 mol−1 cm−1) (LMCT s → d), 380 (10
531) nm (dm3 mol−1 cm−1) (LMCT s → d), 380 (10![[thin space (1/6-em)]](https://www.rsc.org/images/entities/char_2009.gif) 424) nm (dm3 mol−1 cm−1) (LMCT s → d). 1H NMR (400 MHz, DMSO-d6, δ ppm, J Hz): δ 6.909–7.324 (m, 36H, Ar–H), δ 6.635–6.757 (m, 2H, C6–H & C8–H), δ 3.793 (s, 3H, –OCH3), δ 1.957 (s, 3H, –CH3), δ 8.488 (s, 1H, terminal –NH).
424) nm (dm3 mol−1 cm−1) (LMCT s → d). 1H NMR (400 MHz, DMSO-d6, δ ppm, J Hz): δ 6.909–7.324 (m, 36H, Ar–H), δ 6.635–6.757 (m, 2H, C6–H & C8–H), δ 3.793 (s, 3H, –OCH3), δ 1.957 (s, 3H, –CH3), δ 8.488 (s, 1H, terminal –NH).Biomolecular interaction studies
The stability of the compounds was performed in 1% aqueous DMSO and phosphate buffer![[thin space (1/6-em)]](https://www.rsc.org/images/entities/char_2009.gif) :
:![[thin space (1/6-em)]](https://www.rsc.org/images/entities/char_2009.gif) DMSO (99
DMSO (99![[thin space (1/6-em)]](https://www.rsc.org/images/entities/char_2009.gif) :
:![[thin space (1/6-em)]](https://www.rsc.org/images/entities/char_2009.gif) 1). The stability was analyzed by monitoring the electronic spectra for the period of 24 h at room temperature on a JASCO 4100 spectrophotometer. DNA binding studies, EB-displacement assays, DNA viscosity studies, DNA cleavage experiments and protein binding studies have been done according to the reported methods.30,31,35,44,73 The detailed procedures for these experiments are provided in the ESI.†
1). The stability was analyzed by monitoring the electronic spectra for the period of 24 h at room temperature on a JASCO 4100 spectrophotometer. DNA binding studies, EB-displacement assays, DNA viscosity studies, DNA cleavage experiments and protein binding studies have been done according to the reported methods.30,31,35,44,73 The detailed procedures for these experiments are provided in the ESI.†
In vitro antioxidant assays
The DPPH radical scavenging activity of the compounds have been carried out according to the reported method.74 In this study, various concentrations of the experimental standard ascorbic acid, [RuHCl(CO)(PPh3)3], ligands (20–100 μM) and complexes (2–10 μM) in methanol were taken. Total antioxidant activity of the compounds was determined by the phosphomolybdate method.75In vitro antimicrobial assay
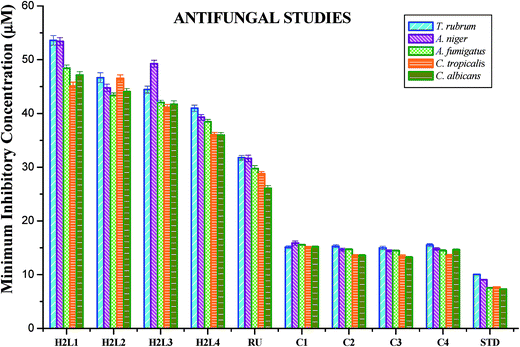
Antimicrobial activities of [RuHClCO(PPh3)3], ligands H2L1–4 and new organometallic Ru(II) complexes (1–4) were evaluated by agar well diffusion method76 as reported, by taking Staphylococcus aureus, Streptococcus pneumonie, Pseudomonas aeruginosa, Salmonella paratyphi and fungus such as Candida albicans, Trichophyton rubrum, Aspergillus niger, Aspergillus fumigatus and Candida tropicalis. The above said all test organisms were obtained from the MTCC, Chandigarh, India and Microbiological laboratory, Coimbatore, Tamil Nadu, India. The antimicrobial activity of the test compounds was checked with various concentrations (25 μg ml−1, 50 μg ml−1 and 100 μg ml−1) against all the test pathogens. Gentamicin and ketoconazole were used as positive controls to study the antibacterial and antifungal activities respectively. Each experiment was performed in triplicate and the results are represented as average zone of inhibition and minimum inhibitory concentration of all the test pathogens.Cytotoxicity studies
Cytotoxic activity of the compounds was tested with human lung cancer cell lines A549, human breast cancer cell lines MCF-7 and human normal keratinocyte cells (HaCaT) by using MTT assay, which was done according to the earlier literature methods77 and IC50 values obtained from nonlinear regression using GraphPad Prism 5.78 The LDH release79 and NO release80 assays of the compounds was evaluated by the earlier reported methods.Conflicts of interest
There are no conflicts to declare.Acknowledgements
The author G. K. greatly acknowledge DST, New Delhi, India for INSPIRE fellowship (IF140225 dated 23.01.2014). The author S. D. greatly acknowledged UGC, New Delhi, India for UGC-BSR fellowship (F.25-1/2014-15(BSR)/7-26/2007(BSR) dated 05.11.2015).References
- M. Adams, Y. Li, H. Khot, C. De Kock, P. J. Smith, K. Land, K. Chibale and G. S. Smith, Dalton Trans., 2013, 42, 4677–4685 RSC.
- P. Chellan, K. M. Land, A. Shokar, A. Au, S. H. An, C. M. Clavel, P. J. Dyson, C. De Kock, P. J. Smith, K. Chibale and G. S. Smith, Organometallics, 2012, 31, 5791–5799 CrossRef CAS.
- B. Demoro, M. Rossi, F. Caruso, D. Liebowitz, C. Olea-Azar, U. Kemmerling, J. D. Maya, H. Guiset, V. Moreno, C. Pizzo, G. Mahler, L. Otero and D. Gambino, Biol. Trace Elem. Res., 2013, 153, 371–381 CrossRef CAS PubMed.
- A. Moreno-Rodríguez, P. M. Salazar-Schettino, J. L. Bautista, F. Hernández-Luis, H. Torrens, Y. Guevara- Gómez, S. Pina-Canseco, M. B. Torres, M. Cabrera-Bravo, C. M. Martinez and E. Pérez-Campos, Eur. J. Med. Chem., 2014, 87, 23–29 CrossRef PubMed.
- A. Walcourt, J. Kurantsin-Mills, J. Kwagyan, B. B. Adenuga, D. S. Kalinowski, D. B. Lovejoy, D. J. R. Lane and D. R. Richardson, J. Inorg. Biochem., 2013, 129, 43–51 CrossRef CAS PubMed.
- B. Ghosh, P. Adak, S. Naskar, B. Pakhira, P. Mitra, R. Dinda and S. K. Chattopadhyay, Inorg. Chim. Acta, 2017, 459, 1–14 CrossRef CAS.
- R. Ramachandran, G. Prakash, S. Selvamurugan, P. Viswanathamurthi, J. G. Malecki and V. Ramkumar, Dalton Trans., 2014, 43, 7889–7902 RSC.
- P. Kalaivani, R. Prabhakaran, F. Dallemer, E. Vaishnavi, P. Poornima, V. Vijaya Padma, R. Renganathan and K. Natarajan, J. Organomet. Chem., 2014, 762, 67–80 CrossRef CAS.
- R. Prabhakaran, P. Kalaivani, R. Jayakumar, M. Zeller, A. D. Hunter, S. V. Renuka Devi, E. Ramachandran and K. Natarajan, Metallomics, 2011, 3, 42–48 RSC.
- C. Preti and G. Tosi, J. Inorg. Nucl. Chem., 1976, 38, 1125–1129 CrossRef CAS.
- J. P. Scovill, D. L. Klayman and C. F. Franchino, J. Med. Chem., 1982, 25, 1261–1264 CrossRef CAS PubMed.
- M. Brlicchi-Ferrari, F. Bisceglie, G. Pelosi, P. Tarasconi, R. Albertini and S. Pinelli, J. Inorg. Biochem., 2001, 87, 137–147 CrossRef.
- T. G. Kraljevi, A. Harej, M. Sedi, S. K. Paveli, V. Stepani, D. Drenjancevi, J. Talapko and S. Rai-Mali, Eur. J. Med. Chem., 2016, 124, 794–808 CrossRef PubMed.
- P. Datta, A. P. Mukhopadhyay, P. Manna, E. R. T. Tiekink, P. C. Sil and C. Sinha, J. Inorg. Biochem., 2011, 105, 577–588 CrossRef CAS PubMed.
- B. S. Creaven, M. Devereux, D. Karcz, A. Kellett, M. McCann, A. Noble and M. Walsh, J. Inorg. Biochem., 2009, 103, 1196–1203 CrossRef CAS PubMed.
- A. Kulkarni, S. A. Patil and P. S. Badami, Eur. J. Med. Chem., 2009, 44, 2904–2912 CrossRef CAS PubMed.
- D. Yu, M. Suzuki, L. Xie, S. L. Morris-Natschke and K. H. Lee, Med. Res. Rev., 2003, 23, 322–345 CrossRef CAS PubMed.
- U. S. Weber, B. Steffen and C. Sigers, Res. Commun. Mol. Pathol. Pharmacol., 1998, 99, 193–206 CAS.
- I. Kostova, I. Manolov and M. Karaivanova, Arch. Pharm., 2001, 334, 157–162 CrossRef CAS PubMed.
- M. Galanski, V. B. Arion, M. A. Jakupec and B. K. Keppler, Curr. Pharm. Des., 2003, 9, 2078–2089 CrossRef CAS PubMed.
- L. Kelland, Nat. Rev. Cancer, 2007, 7, 573–584 CrossRef CAS PubMed.
- J. M. Rademaker-Lakhai, D. Van den Bongard, D. Pluim, J. H. Beijnen and J. H. Schellens, Clin. Cancer Res., 2004, 10, 3717–3727 CrossRef CAS PubMed.
- C. G. Hartinger, M. A. Jakupec, S. Zorbas-Seifried, M. Groessl, A. Egger, W. Berger, H. Zorbas, P. J. Dyson and B. K. Keppler, Chem. Biodiversity, 2008, 5, 2140–2155 CAS.
- H. Huang, P. Zhang, Y. Chen, K. Qiu, C. Jin, L. Ji and H. Chao, Dalton Trans., 2016, 45, 13135–13145 RSC.
- A. Garza-Ortiz, P. Uma Maheswari, M. Siegler, A. L. Spek and J. Reedijk, New J. Chem., 2013, 37, 3450–3460 RSC.
- M. J. Chow, C. Licona, D. Y. Q. Wong, G. Pastorin, C. Gaiddon and W. H. Ang, J. Med. Chem., 2014, 57, 6043–6059 CrossRef CAS PubMed.
- D. S. Ranade, A. M. Bapat, S. N. Ramteke, B. N. Joshi, P. Roussel, A. Tomas, P. Deschamps and P. P. Kulkarni, Eur. J. Med. Chem., 2016, 121, 803–809 CrossRef CAS PubMed.
- F. Bisceglie, A. Musiari, S. Pinelli, R. Alinovi, I. Menozzi, E. Polverini, P. Tarasconi, M. Tavone and G. Pelosi, J. Inorg. Biochem., 2015, 152, 10–19 CrossRef CAS PubMed.
- R. N. Prabhu, D. Pandiarajan and R. Ramesh, J. Organomet. Chem., 2009, 694, 4170–4177 CrossRef CAS.
- P. Kalaivani, R. Prabhakaran, P. Poornima, F. Dallemer, K. Vijayalakshmi, V. Vijaya Padma and K. Natarajan, Organometallics, 2012, 31, 8323–8332 CrossRef CAS.
- E. Jayanthi, S. Kalaiselvi, V. Vijaya Padma, N. S. P. Bhuvanesh and N. Dharmaraj, Dalton Trans., 2016, 45, 1693–1707 RSC.
- A. B. P. Lever, Inorganic, Electronic Spectroscopy, Elsevier, New York, 2nd edn, 1984 Search PubMed.
- S. A. Patil, S. N. Unki, A. D. Kulkarni and V. H. Naikand Badami, Spectrochim. Acta, Part A, 2011, 79, 1128–1136 CrossRef CAS PubMed.
- A. A. Ali, H. Nimir, C. Aktas, V. Huch, U. Rauch, K. H. Schäfer and M. Veith, Organometallics, 2012, 31, 2256–2262 CrossRef CAS.
- G. Kalaiarasi, R. Jain, H. Puschman, S. Poorna Chandrika, K. Preethi and R. Prabhakaran, New J. Chem., 2017, 41, 2543–2560 RSC.
- K. N. Anees Rahman, J. Haribabu, C. Balachandran, N. S. P. Bhuvanesh, R. Karvembu and A. Sreekanth, Polyhedron, 2017, 135, 26–35 CrossRef.
- W. Su, Q. Qian, P. Li, X. Lei, Q. Xiao, S. Huang, C. Huang and J. Cui, Inorg. Chem., 2013, 52, 12440–12449 CrossRef CAS PubMed.
- F. Bisceglie, A. Musiari, S. Pinelli, R. Alinovi, I. Menozzi, E. Polverini, P. Tarasconi, M. Tavone and G. Pelosi, J. Inorg. Biochem., 2015, 152, 10–19 CrossRef CAS PubMed.
- P. Kalaivani, R. Prabhakaran, E. Vaishnavi, T. Rueffer, H. Lang, P. Poornima, R. Renganathan, V. Vijaya Padma and K. Natarajan, Inorg. Chem. Front., 2014, 1, 311–324 RSC.
- B. Demoro, C. Sarniguet, R. Sanchez-Delgado, M. Rossi, D. Liebowitz, F. Caruso, C. Olea-Azar, V. Moreno, A. Medeiros, M. A. Comini, L. Otero and D. Gambino, Dalton Trans., 2012, 41, 1534–1543 RSC.
- S. Mandal, D. K. Seth and P. Gupta, Inorg. Chim. Acta, 2013, 397, 10–20 CrossRef CAS.
- M. J. Waring, in, Drug Action at the Molecular Level, ed. G. C. K. Roberts, Maemillar, London, 1977, p. 167 Search PubMed.
- A. M. Pyle, J. P. Rehmann, R. Meshoyrer, C. V. Kumar, N. J. Turro and J. K. Barton, J. Am. Chem. Soc., 1989, 111, 3051–3058 CrossRef CAS.
- K. Jeyalakshmi, J. Haribabu, N. S. P. Bhuvanesh and R. Karvembu, Dalton Trans., 2016, 45, 12518–12531 RSC.
- S. Satyanarayana, J. C. Dabrowiak and J. B. Chaires, Biochemistry, 1993, 32, 2573–2584 CrossRef CAS PubMed.
- G. Cohen and H. Eisenberg, Biopolymers, 1969, 8, 45–55 CrossRef CAS.
- M. S. Deshpande, A. A. Kumbhar, A. S. Kumbhar, M. Kumbhakar, H. Pal, U. B. Sonawane and R. R. Joshi, Bioconjugate Chem., 2009, 20, 447–459 CrossRef CAS PubMed.
- D. Suh, Y. Oh and J. B. Chaires, Process Biochem., 2001, 37, 521–525 CrossRef.
- A. Chouai, S. E. Wicke, C. Turro, J. Bacsa, K. R. Dunbar, D. Wang and R. P. Thummel, Inorg. Chem., 2005, 44, 5996–6003 CrossRef CAS PubMed.
- X. Qiao, Z. Y. Ma, C. Z. Xie, F. Xue, Y. W. Zhang, J. Y. Xu, Z. Y. Qiang, J. S. Lou, G. J. Chen and S. P. Yan, J. Inorg. Biochem., 2011, 105, 728–737 CrossRef CAS PubMed.
- J. R. Lakowicz, Principles of Fluorescence Spectroscopy, Plenum Press, New York, 2nd edn, 1999 Search PubMed.
- M. R. Eftink and C. A. Ghiron, Biochemistry, 1976, 15, 672–680 CrossRef CAS PubMed.
- J. R. Lakowicz, Principles of Fluorescence Spectroscopy, Springer, US, 3rd edn, 2006 Search PubMed.
- T. S. Morais, F. C. Santos, L. Corte-Real and M. H. Garcia, J. Inorg. Biochem., 2013, 129, 94–101 CrossRef CAS PubMed.
- T. E. Kydonaki, E. Tsoukas, F. Mendes, A. G. Hatzidimitriou, A. Paulo, L. Papadopoulou, D. Papagiannopoulou and G. Psomas, J. Inorg. Biochem., 2016, 160, 94–105 CrossRef CAS PubMed.
- F. Beckford, J. Thessing, J. Woods, J. Didion, N. Gerasimchuk, A. Gonzalez-Sarrias and N. P. Seeram, Metallomics, 2011, 3, 491–502 RSC.
- S. Mukhopadhyay, R. K. Gupta, R. P. Paitandi, N. K. Rana, G. Sharma, B. Koch, L. K. Rana, M. S. Hundal and D. S. Pandey, Organometallics, 2015, 34, 4491–4506 CrossRef CAS.
- F. F. Tian, F. L. Jiang and X. L. Han, J. Phys. Chem. B, 2010, 114, 14842–14853 CrossRef CAS PubMed.
- R. M. Towyz, Hypertension, 2004, 44, 248–252 CrossRef PubMed.
- T. Fujimori, S. Yamada, H. Yasui, H. Sakurai, Y. In and T. Ishida, J. Biol. Inorg Chem., 2005, 10, 831–841 CrossRef CAS PubMed.
- B. G. Tweedy, Phytopathology, 1964, 55, 910–914 Search PubMed.
- R. Prabhakaran, A. Geetha, M. Thilagavathi, R. Karvembu, V. Krishnan, H. Bertagnolli and K. Natarajan, J. Inorg. Biochem., 2004, 98, 2131–2144 CrossRef CAS PubMed.
- P. G. Lawrence, P. L. Harold and O. G. Francis, Antibiot. Chemother., 1957, 4, 1980 Search PubMed.
- K. Shanker, R. Rohini, V. Ravinder, P. Muralidhar Reddy and Y. Ho, Spectrochim. Acta, Part A, 2009, 73, 205–211 CrossRef PubMed.
- S. Kannan, M. Sivagamasundari, R. Ramesh and Y. Liu, J. Organomet. Chem., 2008, 693, 2251–2257 CrossRef CAS.
- L. Chen, F. Peng, G. Li, X. Jie, K. Cai, C. Cai, Y. Zhong, H. Zeng, W. Li, Z. Zhang and J. Chen, J. Inorg. Biochem., 2016, 156, 64–74 CrossRef CAS PubMed.
- S. Richter, S. Singh, D. Draca, A. Kate, A. Kumbhar, A. S. Kumbhar, D. Maksimovic-Ivanic, S. Mijatovic, P. Lönnecke and E. Hey-Hawkins, Dalton Trans., 2016, 45, 13114–13125 RSC.
- (a) C. Legrand, J. M. Bour, C. Jacob, J. Capiaumont, A. Martial, A. Marc, M. Wudtke, G. Kretzmer, C. Demangel, D. Duval and J. Hache, J. Biotechnol., 1992, 25, 231–243 CrossRef CAS PubMed; (b) E. Bonfoco, D. Krainc, M. Ankarcrona, P. Nicotera and S. A. Lipton, Proc. Natl. Acad. Sci. U. S. A., 1995, 16, 7162–7166 CrossRef.
- A. I. Vogel, Textbook of Practical Organic Chemistry, Longman, London, 5th edn, 1989, p. 268 Search PubMed.
- N. Ahmad, J. J. Levision, S. D. Robinson, M. F. Uttley, E. R. Wonchoba and G. W. Parshall, Inorg. Synth., 1974, 15, 45–64 CAS.
- S. KhanYusufzai, H. Osman, M. Shaheen Khan, S. Mohamad, O. Sulaiman, T. Parumasivam, J. Azlan Gansau, N. Johansah and H. Noviany, Med. Chem. Res., 2017, 26, 1139–1148 CrossRef CAS.
- (a) G. M. Sheldrick, Acta Crystallogr., Sect. A: Found. Crystallogr., 2008, 64, 112–122 CrossRef CAS PubMed; (b) G. M. Sheldrick, Acta Crystallogr., Sect. C: Struct. Chem., 2015, 71, 3–8 CrossRef PubMed; (c) O. V. Dolomanov, L. J. Bourhis, R. J. Gildea, J. A. K. Howard and H. Puschmann, J. Appl. Crystallogr., 2009, 42, 339–342 CrossRef CAS.
- W. J. Lian, X. T. Wang, C. Z. Xie, H. Tian, X. Q. Song, H. T. Pan, X. Qiao and J. Y. Xu, Dalton Trans., 2016, 45, 9073–9087 RSC.
- M. S. Blios, Nature, 1958, 29, 1199–1200 CrossRef.
- P. Prieto, M. Pineda and M. Aguilar, Anal. Biochem., 1999, 269, 337–341 CrossRef CAS PubMed.
- I. Weigand and K. Hilpert, Nat. Protoc., 2008, 3, 163–175 CrossRef PubMed.
- T. J. Mossman, Immunol. Methods, 1983, 65, 55–63 CrossRef.
- H. J. Motulsky, Prism 5 Statistics Guide, GraphPad Software Inc., San Diego, CA, 2007, http://www.graphpad.com Search PubMed.
- W. E. C. Wacker, D. D. Ulmer and B. L. Vallee, J. Med., 1956, 255, 449–456 CAS.
- D. J. Stueher and M. A. Marletta, J. Immunol., 1987, 139, 518–525 Search PubMed.
Footnote |
| † Electronic supplementary information (ESI) available: Crystallographic data for the ligands H2L1–3 and complex 1, 2 and 4. CCDC 1580118 (H2L1), 1580119 (H2L2), 1580120 (H2L3), 1580121 (1), 1580122 (2) and 1580123 (4). For ESI and crystallographic data in CIF or other electronic format see DOI: 10.1039/c7ra12104k |
| This journal is © The Royal Society of Chemistry 2018 |

