 Open Access Article
Effect of an anionic surfactant (SDS) on the photoluminescence of graphene oxide (GO) in acidic and alkaline medium†
Prosenjit Sahaa,
Dinesh Kumar Pynea,
Srijon Ghoshb,
Soumadip Banerjeeb,
Sourav Dasc,
Soumen Ghosh c,
Partha Dutta*d and
Arnab Halder
 *a
*a
aDepartment of Chemistry, Presidency University, Kolkata – 700073, India. E-mail: arnab.chem@presiuniv.ac.in; Tel: +91 3340529846
bIndian Association for the Cultivation of Science, Jadavpur, Kolkata – 700 032, India
cCentre for Surface Science, Physical Chemistry Section, Department of Chemistry, Jadavpur University, Kolkata-700032, India
dDepartment of Chemistry, Maharaja Manindra Chandra College, Kolkata – 700003, India. E-mail: par_dut@yahoo.com; Tel: +91 9433464396
First published on 2nd January 2018
Abstract
An anionic surfactant (SDS) modulates the photoluminescence of graphene oxide (GO) in both acidic and alkaline medium. In the acidic medium (pH ≈ 2), formation of hemi spherical surface micelles on the GO sheets creates a non-polar environment around the flourophoric moiety of GO and hinders the solvent relaxation. This leads to a significant 36 nm blue shift of the photoluminescence band, whereas in alkaline medium (pH ≈ 10), SDS interacts with GO sheets in a different way due to the presence of negatively charged carboxylate ions at the GO edges. The repulsion between the negatively charged GO sheets and the intercalation of SDS within the basal planes of GO may weaken π–π stacking interaction which produces largely separate layers of GO. The largely separated GO sheets due to very weak stacking interactions among successive layers may behave almost like isolated functionalized GO, resulting in an enhancement of the photoluminescence intensity at 303 nm.
Introduction
Graphene, a monolayer of sp2-hybridised carbon atoms with a two dimensional honey-comb sheet structure, and graphene based nano materials have become a popular research topic in nanomaterials science due to their unique optical and mechanical properties1–6 and many technological7–9 and biological applications,10 since its discovery in 2004. Functionalized graphene sheets or graphene oxide (GO) obtained by treating graphite with strong oxidizers, was primarily considered only as a precursor for graphene, but as a result of oxidation, the band gap of graphene is enhanced and graphene oxide has drawn tremendous research interest for its optical properties11–18 which are somehow limited for graphene because of its zero band gap. On the other hand due to the availability of several oxygen containing functional groups (epoxy, hydroxyl, carboxyl) on the surface and sheet edges19,20 and high surface area, GO interacts with many organic, inorganic, biomolecules, polymers21–23 and surfactants24–28 to produce several GO based nanomaterials and nanocomposites. Adsorption of surfactants on the GO surface plays an important role for many practical applications in Li-ion battery electrodes29,30 and metal–oxide films.31,32 Introduction of electrostatic repulsive or steric factors increases the stability of the aqueous GO system.28 This can be obtained by increasing the pH of the medium above the pKa of the carboxylic groups through the utilization of electrostatic repulsion between the negative charges of carboxyl groups on the edges of the GO sheet.33–35 But when the carbon to oxygen ratio is high, pH adjustment is not practically possible. In this situation, stability of the aqueous GO system may be enhanced by using surfactants. The charged head groups of adsorbed ionic surfactants may provide electrostatic repulsion or steric interaction. Considering this fact in mind, the different research groups investigated the stability of GO in aqueous medium in the presence of sodium dodecyl sulphate (SDS) by various methods and also studied the interaction between GO and SDS. Hsieh et al. observed the adsorption behavior of SDS on functionalized graphene sheet (FGS) by conductometric titration.27 According to them, the surface of FGS is complete covered by monolayer adsorption of 12 μm SDS concentration, when FGS has carbon to oxygen ratio is 18 and they found the critical surface aggregation concentration (CSAC) for surface micelle formation on FGS as 1.5 mM.27 In another work, related to the stability of FGS in the presence of SDS by optical microscopy and UV-vis study, Aksay and coworkers showed that FGS achieved significant stability in aqueous medium above the monolayer adsorption concentration (≥40 μM) of SDS.28 Glover et al. reported the charge driven selective adsorption of SDS on graphene oxide by atomic force microscopy and showed that the amount of selective adsorption of SDS depends on the degree of oxidation.26 They explained the observed results on the basis of electrostatic repulsion between the negatively charged SDS head groups and the negatively charged hydroxyl groups on oxidized graphene.26 In this context, it is important to mention that several researchers extensively investigated the adsorption behavior of surfactants onto graphitic carbons.36–38 Compared to graphite, adsorption behavior of SDS on FGS is different. Graphite contains sp2 hybridized carbon atoms with a high degree of hexagonal order. But, introduction of oxygen containing functional groups in the basal planes of graphene, the overall structure becomes highly disordered due to the presence of defects39 and so the possibility of the interaction between oxygen containing functional groups and SDS molecules increases.Although, there are a number of studies on the interaction of the surfactant with GO in water,24–28,40,41 the current literatures do not show much focus on the optical properties and spectral modulation of the GO dispersions in the presence of surfactants. Although, GO exhibits interesting photoluminescence (PL) spectrum in UV, vis, NIR region,11–18 the origin of the PL band is still controversial because of the inherent inhomogeneity of the GO structure due to the presence of various domains and functional groups. According to Eda et al.,11 the different broad PL bands arise due to π–π* transition of the isolated sp2 domains within the C–O sp3 matrix and the variation in the band gap of the sp2 domains. Again, the nature of the PL is modulated by various factors, like concentrations of GO42, pH of the medium,14,17 presence of polymer43 as a result of various type of interactions, e.g. π–π stacking, charge transfer interaction. Dutta and coworkers reported that the blue shift of UV fluorescence of GO with the increase in pH due to the movement of basal planes of GO by the repulsion of carboxylate ions at the edges of GO sheets and weakening of π–π stacking interaction.17 In two recent works, Cushing et al. identified the slow solvation of fluorophoric moieties of GO as a origin of red edge effect.15,16 Ouyang and coworkers indicated that formation of excimer is responsible for complicated photoluminescence of GO and this is affected by the concentration of GO and pH of the medium.42
In the present work, we want to investigate the effect of an anionic surfactant, sodium dodecyl sulphate (SDS) on the photoluminescence (PL) spectra of GO in acidic and alkaline medium. We have also compared the experimental results with the multi-stage adsorption model given by Aksay and coworkers27,28 for the interaction of SDS with GO sheets. By studying the photoluminescence of chemically functionalized GO in presence of different concentration of SDS, the critical surface aggregation concentration (CSAC) for the formation of hemi cylindrical surface micelles on the GO sheets (in the pH ≈ 2) has been determined. In addition to this, we have demonstrated the mode of the interaction between GO and SDS in acidic and alkaline pH from the view point of the change in the pattern of PL bands. The red edge excitation effect has also been studied to understand the effect of SDS adsorption on GO sheets in acidic pH (≈2). This work enlightens the research on the PL of GO in presence of negatively charged surfactants (SDS) and help to understand the nature of interaction between GO sheets and SDS in acidic and alkaline medium.
Results and discussion
A. Characterization of GO
Characterization of GO synthesized by modified Hummer's method by Raman spectrum, FT-IR spectrum, X-ray diffraction study, scanning electron microscopy (SEM) and transmission electron microscopy (TEM) are mentioned in ref. 17 and ESI.† Two Raman peaks at 1350 cm−1 and 1596 cm−1, named as D band (disordered band, associated with the reduction in size of the in-plane sp2 domains) and G band (growth band, due to vibrations of hexagonal lattice, characteristic of graphene-like “honeycomb” structure), respectively are observed.17 XRD data of GO, as described in ref. 17, exhibits a 001 reflection at 7.97° corresponding to interlayer spacing of 1.11 nm which is higher than interlayer spacing of graphite flakes due to the presence of oxygenated functional groups.44B. Absorption spectra
Absorption of the aqueous medium at low (≈2) and high (≈10) pH in presence of SDS without GO does not show any significant absorption in the wavelength range 200–500 nm. UV-vis absorption spectrum of aqueous dispersion GO in acidic (pH ≈ 2) and alkaline (pH ≈ 10) does not exhibit any distinct band structure, only broad spectral features are found (Fig. 1a and b). Absorption of the aqueous dispersion of GO below 250 nm may be assigned to π–π* transition of C![[double bond, length as m-dash]](https://www.rsc.org/images/entities/char_e001.gif) C and whereas absorption at higher wavelength may be due to n–π* transition of C
C and whereas absorption at higher wavelength may be due to n–π* transition of C![[double bond, length as m-dash]](https://www.rsc.org/images/entities/char_e001.gif) O bond.45,46
O bond.45,46
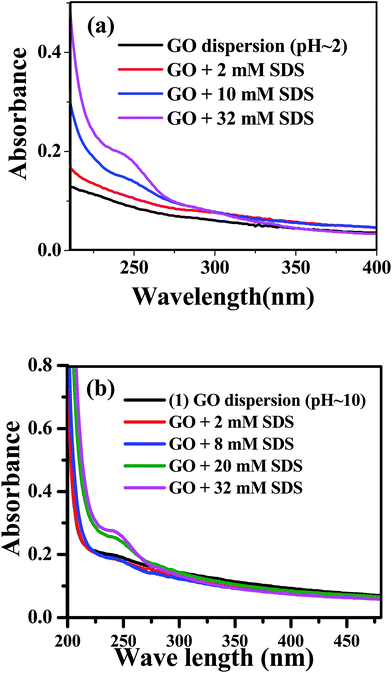 | ||
| Fig. 1 Absorption spectra of GO dispersion with different SDS concentration (a) at pH ≈ 2 (b) at pH ≈ 10. | ||
C. Fluorescence spectra of GO dispersion
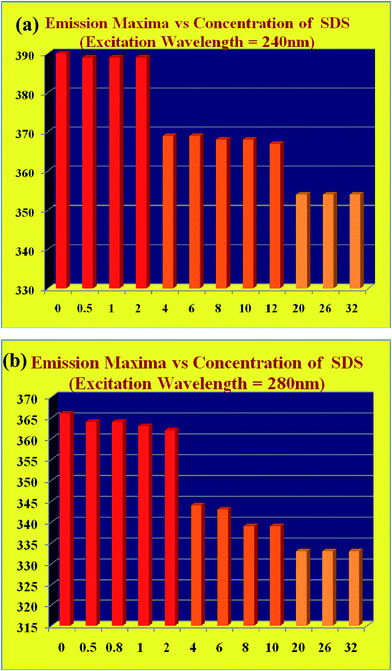
Due to the intrinsic inhomogeneity of GO material, the fluorescence spectra of GO dispersion show interesting features dependent upon the excitation wavelength and pH.17 We extensively studied the emission characteristics of GO dispersion by exciting the sample at 240 nm (π–π* band) and at 280 nm (n–π* band), varying SDS concentration from 0 to 32 mM in both acidic and alkaline medium. Again, it is well known that the photoluminescence property of GO depends on the layer number, but, the estimation of layer number is not possible by the spectroscopic data. Although, the pH dependent surfactant like properties of GO sheets are well studied,47 the effect of surfactant on the photoluminescence of GO is yet to be discovered.In acidic medium (pH ≈ 2), when the aqueous dispersion of GO is excited at 240 nm, an emission band is appeared at 390 nm (Fig. 2a) as obtained by Dutta et al.17 Addition of SDS up to 32 mM to the aqueous GO dispersion, a 36 nm blue shift of the emission band is observed (Fig. 2a). Similarly, exciting the aqueous dispersion of GO (pH ≈ 2) at 280 nm, the emission band is obtained at 366 nm and a blue shift of 33 nm is found in the presence of 32 mM SDS concentration (Fig. 2b). For the both excitation wavelength at 240 nm and 280 nm, we have found the blue shift of the emission band in two stages. Exciting at 240 nm, first stage blue shift is observed from 390 nm to 368 nm if the concentration of SDS is greater than 2 mM and this emission band is unchanged up to 12 mM SDS. Further blue shift from 368 nm to 354 nm is obtained when the concentration of SDS is above 12 mM (Fig. 3a). Similarly, exciting the acidic dispersion of GO at 280 nm, first blue shift is observed from 366 nm to 344 nm, for the concentration of SDS greater than 2 mM and above 12 mM concentration of SDS, further blue shift is obtained from 344 nm to 333 nm (Fig. 3b). For both the cases above 12 mM SDS concentration, there is no further shift in the emission maxima as the surfaces of GO is almost fully covered by the SDS. This two stage blue shift may be due to the non polar environment around the flourophoric moiety, resulting from the adsorption of SDS on GO surface. Above 2 mM concentration of SDS, monolayer adsorption of SDS on the GO sheets has been taken place and so our photoluminescence study confirms that critical surface aggregation constant (CSAC) is greater than 2 mM which is very close to the observation of Hsieh et al.27,28 Above 12 mM SDS concentration, hemi spherical surface micelles are formed on the GO surface resulting a highly non polar environment around the fluorophoric moiety. Here, another important observation needs to mention that a small but distinct shoulder is appeared at around 305 nm (λex = 240 nm) in case of the acidic dispersion of GO with SDS concentration greater or equal to 4 mM (Fig. 2a). To explore the origin of this band we have to consider the extent of π–π stacking interaction between two adjacent GO sheets which will be discussed in details after presenting the luminescence features in alkaline medium.
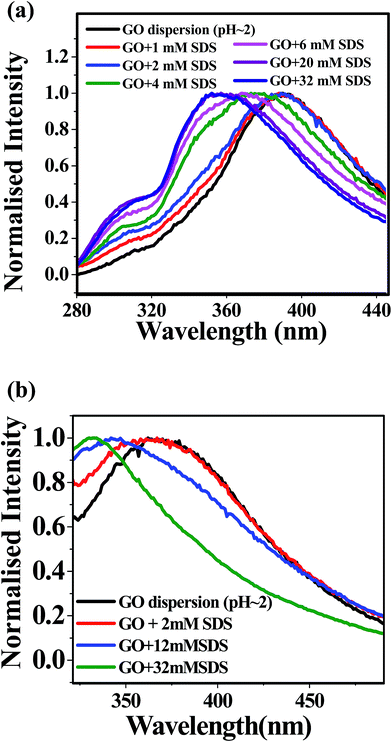 | ||
| Fig. 2 Photoluminescence spectra of acidic dispersion of GO with different SDS concentration (a) λex = 240 nm (b) λex = 280 nm. | ||
The exhibition of a marked blue shift because of non polar environment surrounding the flourophoric moiety of GO as a result of the adsorption of SDS may be originated from the restricted motion of the solvent molecules (water) by various non-covalent type interactions, H-bonding etc. Solvent relaxation time is usually very much lower than the fluorescence life time of traditional fluorophores.48 Thus, the solvent relaxation becomes complete before the fluorescence emission and so a red shifted emission from an equilibrium state is observed. Whereas, in the case of slow solvent relaxation time compared to fluorescence life time results a time dependent red shift. Conventionally this time dependent fluorescence stokes shift (TDFSS) is studied thorough the construction of time resolved emission spectra (TRES) by monitoring the wavelength dependent fluorescence decay where a growth followed by decay is observed. But, the temporal resolution of our instrumental set up (a pulse width of 600 ps) makes us unable to construct TRES for this study. Again, due to this slow solvent relaxation, a common phenomenon namely, Red Edge Effect (REE) is observed as the rate of change in emission energy due to solvation is higher in magnitude with respect to the life time of the fluorophore. This leads to continuous shift of emission peaks originated from the excitation at gradually increasing wavelengths at the red end of the absorption spectrum. Recently, these types of REE for strongly alkali treated GO were reported by Wu and coworkers.15,16 Although, excitation wavelength dependent emission could come from various functional groups present in GO, as obtained by Thomas et al.,49 gradual red shift in the emission band by the increase in the excitation wavelength at the red end of the absorption spectrum, is not observed for the aqueous dispersion of GO, prepared by us using modified Hummer's method.17 Teng and co-workers have also found such excitation wavelength independent photoluminescence of GO.50 According to Gan et al.,51 giant red edge effect may be one of the origin of excitation wavelength dependent photoluminescence of GO quantum dots. But, such observation is absent in the GO, synthesized by us, because of different characteristics with respect to GO quantum dots. Only in the presence of high concentration of SDS, such observation is obtained. So, the observation of REE due the presence of various fluorophores within GO may be ruled out.
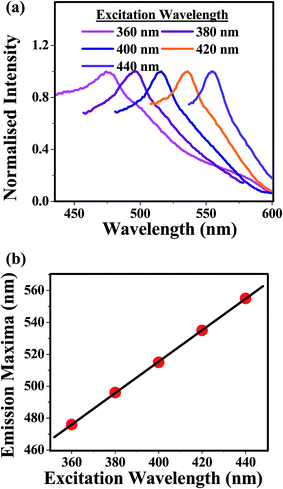
Considering this fact in mind, we have studied the REE for the aqueous dispersion of GO (pH ≈ 2) in the presence of 32 mM SDS. Exciting the aqueous dispersion of GO (pH ≈ 2) in the presence of 32 mM SDS at the red end of the absorption spectra (at 360 nm and above), a gradual shift in the emission maxima was observed (Fig. 4a). This observation clearly suggests that adsorption of the SDS as hemispherical micelles on the GO sheets slows down the solvent relaxation either by shielding the fluorophoric moiety from the solvent dipoles or by introducing confinement on the motion of solvent dipoles through some soft non covalent binding. This leads to the longer time scale of the stabilization of excited state's energy solvation process compared to the life time of the fluorophoric moiety of GO. The plot of emission maxima against excitation wavelength was obtained as linear (Fig. 4b). This indicates that the change in emission maxima (Δλem) is independent of the excitation wavelengths at the red end of the absorption band.
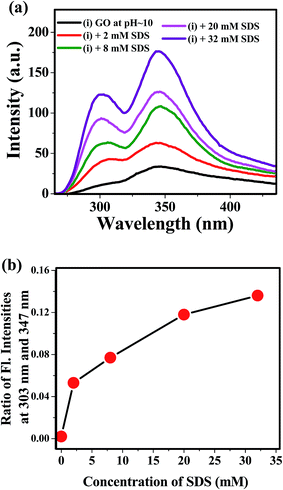
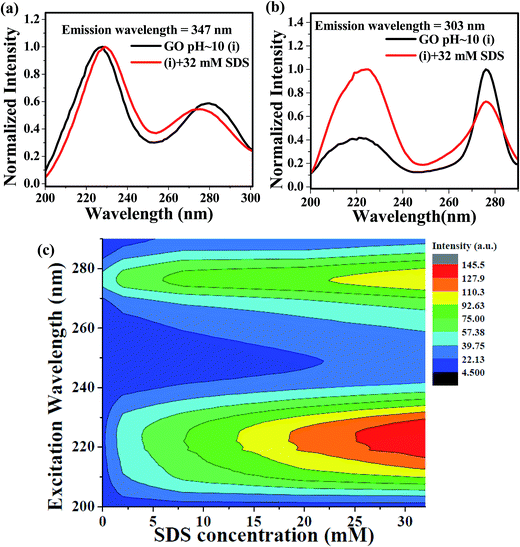
We have also studied the photoluminescence of aqueous dispersion GO in alkaline medium of pH ≈ 10. When the aqueous dispersion GO of pH ≈ 10 was excited at the wavelength 240 nm, the emission band appeared at 347 nm (Fig. 5a). The fluorescence peak of the aqueous dispersion GO is shifted from 390 nm to 347 nm by changing the pH of the medium from 2 to 10 is due to increase in interlayer spacing of GO resulting from the repulsion between negatively charged carboxylic acid functional groups at the edge of GO sheets.17 Apart from this, a small but distinct shoulder around 303 nm is observed in the alkaline medium (Fig. 5a) and this type of low intense PL band may be appeared due to the benzoic acid or phenol like structure.13,52 Kim and co-workers have reported two photoluminescence peaks by spectroscopic method.53 According to this study, the position and width of these two peaks are dependent upon the size of the graphene quantum dots and pH of the medium.53 But, they do use any external additives, like, surfactant, to increase the intensity of the PL bands. In this work, we have found that the intensity of the emission band at 303 nm is increased by the presence of SDS and the emission patterns remain same up to 32 mM concentration of SDS. To interpret the enhancement of the intensity of the photoluminescence band at 303 nm, we have to consider the mode of interaction between GO and SDS at highly alkaline pH. The zeta potential values of aqueous GO dispersion54 at various pH indicates GO contains negative surface charges35 arising from the carboxylate groups at the edges. Hence, SDS adsorption on the GO sheet is hindered due to repulsion between negative head groups of SDS and negatively charged carboxylate groups. But, surfactants may be intercalated between GO layer25 and this intercalation disrupts the π–π stacking interaction within successive GO sheets, Song et al. reported the intercalation of anionic surfactant to increase the dispersion stability of functionalized graphene.55 However, the disruption of π–π stacking interaction because of the intercalation SDS within the basal plane of GO may lead to largely separated GO layers. With the increase in the distance between basal planes of GO, the band gap of GO moiety increases.17 Increase in intensity of the blue shifted band at 303 nm may be due to the increase in the band gap of GO and also due to the pronounced effect of the PL band of the benzoic acid or phenol like moiety present in the GO sheets. Plot of ratio intensities at 303 nm and 347 nm of alkaline dispersion of GO against SDS concentration (Fig. 5b) shows that with increase in SDS concentration photoluminescence intensity at 303 nm is enhanced as a result of weakening of π–π stacking interaction due to increase in the extent of SDS intercalation within GO layers and this leads to the observation of more prominent emission from benzoic acid or phenol like moiety as the interaction between the two successive GO layers is negligibly small in the presence of SDS. On the basis of this discussion, the appearance of small shoulder at 303 nm in the luminescence spectra (Fig. 2a) of acidic dispersion of GO in the presence of SDS (concentration ≥ 4 mM) is interpreted as a consequence of very weak π–π interaction due to the intercalation of SDS between GO layers. Ouyang and coworkers indicated the presence of long wavelength excimer photoluminescence band due to π–π overlapping between successive GO sheets and another blue shifted photoluminescence band of monomeric GO species without interlayer π–π interaction at very low concentration of GO.42 Similar type of observation was also found for polyaromatic compounds.56 Then the blue shifted fluorescence band at 303 nm is due the GO fluorophoric moieties with widely separated basal planes resulting very high band gap. But, further investigation using the time resolved study is required to confirm this type of phenomenon.
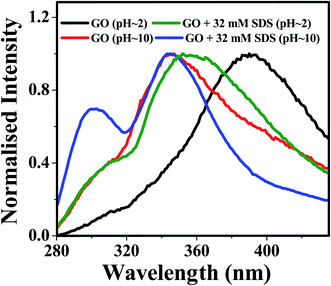
The effect of an anionic surfactant (SDS) on the photoluminescence spectra of GO in acidic (pH ≈ 2) and alkaline (pH ≈ 2) dispersions may be summarized by Fig. 6. In acidic dispersion, addition of SDS results a marked blue shift from 390 nm to 354 nm obtained by exciting the GO dispersion at 240 nm which may be explained by the formation of hemispherical SDS micelles on the GO sheets resulting a non polar environment and restriction of the movement of the solvent (water) molecules (Fig. 7a). Since, the carboxylic functional groups are negatively charged in alkaline medium (pH ≈ 10), repulsion between these negatively charged carboxylate groups increases the interlayer spacing of GO and this leads to a blue shift in emission maxima.17 In the presence of SDS, the interlayer spacing of GO becomes very high due to very weak π–π stacking interaction because of the intercalation of SDS molecules between successive GO sheets, and this may give rise to largely separated layers of the GO moiety with almost isolated benzoic acid or phenol like species resulting the increase in the intensity of the photoluminescence band at 303 nm (Fig. 7b). Thus, in comparison to our previous work,17,43 we are able to give more detail insight on the factors controlling the interlayer spacing of GO and so the PL band gap by using p as well as an anionic surfactant. Apart from this, the present study indicates the different mode of interaction between GO and SDS in acidic and alkaline pH and this effect of interaction on the PL band is entirely different from the effect of a polymer (PANI) grafted GO sheets.43
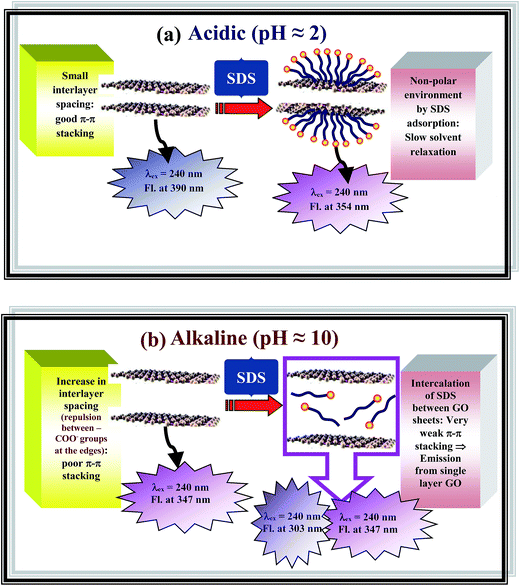 | ||
| Fig. 7 Schematic diagram representing the interlayer spacing between GO sheets and effect of SDS on the emission at (a) acidic (pH ≈ 2) (b) alkaline (pH ≈ 10). | ||
D. Fluorescence excitation spectra of GO dispersion
We have measured the fluorescence excitation spectra (FLE) of aqueous dispersion GO at pH ≈ 2 in presence and absence of SDS (Fig. 8a and b). Fluorescence excitation spectra (FLE) of GO in acidic medium (pH ≈ 2) monitored at 390 nm (Fig. 8a) shows a major band at 240 nm for both presence (32 mM SDS) and absence of SDS. This suggests that the species emitting at 390 nm absorbs at 240 nm (ref. 17) and adsorption of SDS does not create any new flourophoric species. But, FLE monitored at 350 nm (Fig. 8b) for the aqueous dispersion of GO (pH ≈ 2) in the presence of 32 mM SDS shows two distinct bands at 230 nm and 280 nm. But, the very low intensity of FLE band monitored at 350 nm for acidic dispersion of only GO is suggesting the very low contribution of the species giving fluorescence at 350 nm. In this context, it can be mentioned that the observed FLE bands at 280 nm and 230 nm resembles to first and second singlet–singlet transition in benzoic acid, respectively.57 Since the chemically functionalized GO contain carboxylic groups attached with the hexagonal sp2 hybridized carbon atoms, the presence of FLE band at 280 nm and 230 nm is quite natural.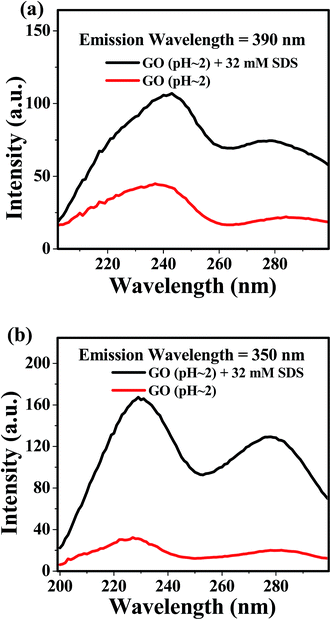 | ||
| Fig. 8 Excitation spectra of GO dispersion (pH ≈ 2) in presence and absence of SDS (a) λem = 390 nm (b) λem = 350. | ||
FLE spectra, monitored at 303 nm and 347 nm (Fig. 9a and b), in the alkaline medium (pH ≈ 10) remain identical in the presence and absence of SDS and this suggests fluorophoric moieties in the excited states are originated from same ground state species. Excitation emission matrices (EEM) of GO dispersion in alkaline pH (Fig. 9c) provide an important observation regarding the photoluminescence band at 303 nm. EEMs clearly indicates that the emission centered at 303 nm is obtained by the excitation at π–π* band (220–230 nm) as well as n–π* band (270–290 nm) and the intensity of photoluminescence at 303 nm gradually increases with the increase in SDS concentration. From this observation, one may conclude that with increase in the extent of SDS intercalation, the distance between the successive layers of GO increases.
E. Fluorescence life time of GO dispersion
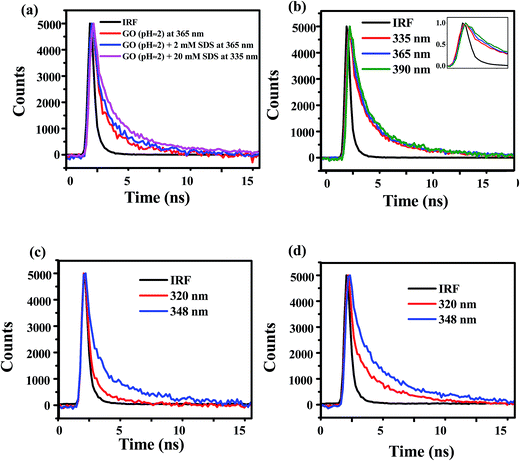
Fig. 10a indicates that the fluorescence decays at 365 nm obtained by exciting the aqueous GO dispersion (pH ≈ 2) in absence and presence of 2 mM SDS by exciting at 280 nm are almost same and bi-exponential with average life time of about 1000 ps (Table 1). But, addition of more SDS results a blue shift in emission maxima and finally, in the presence of 20 mM SDS, the fluorescence maxima is shifted to 333 nm (Fig. 2b). The average life time obtained at 335 nm for acidic dispersion of GO (pH ≈ 2) in the presence of 20 mM SDS was found to be about 1.9 times higher than the average life time of aqueous dispersion of GO in absence of SDS (Table 1). The increase in the life time may be interpreted by the decrease in the non-radiative pathways may be due to the decrease in the accessibility of polar solvent molecules around the fluorophoric moiety of GO. The formation of hemispherical SDS micelles on the GO sheets27 introduces a confinement to the motion of water molecules at the surface of GO and there by slow down the relaxation process of the GO fluorophore in the excited state. The restricted motion of the solvent molecules surroundings the GO fluorophore results time dependent fluorescence stokes shift which is usually manifested by wavelength dependent fluorescence decays. But, the time resolution of our instrument (instrument response function ≈ 600 ps) is not high enough to detect such kinds of fluorescence decays and a distinct growth of the fluorescence decay obtained at the red end of the emission band. The fluorescence decays of aqueous dispersion of GO in presence of 20 mM SDS at 335 nm, 365 nm and 390 nm are not well separated (Fig. 10b). But, Table 2 shows that the magnitude of the slow components of the fluorescence decays increase from 3.6 to 5.9 ns with the increase in wavelength may be due to the slow solvent relaxation.| Conc. of SDS (mM) | Wavelength (nm) | τ1 | τ2 | 〈τ〉 |
|---|---|---|---|---|
| 0 | 365 | 670 ps (94%) | 4.2 ns (6%) | 880 ps |
| 2 | 365 | 600 ps (87%) | 4.4 ns (13%) | 1090 ps |
| 20 | 335 | 1000 ps (82%) | 4.8 ns (18%) | 1680 ps |
| Wavelength (nm) | τ1 | τ2 |
|---|---|---|
| 320 | 900 ps (82%) | 3.6 ns (18%) |
| 335 | 1000 ps (82%) | 4.8 ns (18%) |
| 365 | 1000 ps (82%) | 5.5 ns (18%) |
| 390 | 1000 ps (80%) | 5.9 ns (20%) |
In the alkaline medium (pH ≈ 10), aqueous dispersion of GO shows two emission bands at 303 nm and 347 nm in presence of SDS (Fig. 5a). The existence of dual peaks is already explained by weakening of π–π stacking interaction between successive GO layers due to intercalation SDS within the GO sheets and the PL bands of benzoic acid or phenol like moiety. Observation of such dual peaks due to any kind of excited state phenomenon can be studied by time resolved fluorescence. Since, the excitation wavelength of our TCSPC set up is 280 nm, we have measured the fluorescence decays of alkaline dispersion of GO in presence and absence of SDS at 348 nm and 320 nm (instead of 303 nm) to avoid any interference from Raman scattering. The fluorescence decays at two wavelengths 348 nm and 320 nm are distinct in nature both in the presence and absence of SDS and fitted well by a bi-exponential decay function (Fig. 10c and d). The fast decay process (τ1) with a lifetime shorter than 1000 ps is due to non-radiative re-combination process, while the slow decay process (τ2) originates from the radiative decay.58 The lifetime of radiative component of the slow decay process at 320 nm is 3–3.5 ns and while at 348 nm, it is 4.7–5.2 ns. The relative contribution of the radiative component of the slow decay process at 320 nm is found to be increased about 6 times with the increase in concentration of SDS (Table 3). As, the low wavelength band at 303 nm is obtained due to well separated layers of GO moiety consists of benzoic acid or phenol like structure as a result of disruption of π–π stacking interaction by intercalation of SDS molecules, the increase in relative contribution of this decay component (3–3.5 ns) is due to increase in the extent of SDS intercalation within GO layers. Again, in the acidic medium (pH ≈ 2), similarities of the decay parameters of GO dispersion in the presence of 20 mM SDS at 320 nm (Table 2) indicates the adsorption of SDS in the form of hemispherical micelles as well as intercalation of SDS within the GO sheets resulting the increase in the distance between the GO layers. The longer life time of the slow component at 348 nm compared to the slow component at 320 nm may be explained by the symmetry argument. Du et al. mentioned that the origin of the longer life time is related to the symmetry of the electronic states of excimer wave function.42 According to Conwell et al., the similar parities of the ground state monomer and excimer is responsible for such longer life time.59
| SDS concentration | Fluorescence lifetime at 320 nm | Fluorescence lifetime at 348 nm | ||
|---|---|---|---|---|
| 0 mM | τ1 = 300 ps (96%) | τ2 = 3.0 ns (4%) | τ1 = 500 ps (85%) | τ2 = 4.7 ns (15%) |
| 4 mM | τ1 = 500 ps (90%) | τ2 = 3.0 ns (10%) | τ1 = 600 ps (88%) | τ2 = 4.8 ns (12%) |
| 12 mM | τ1 = 550 ps (83%) | τ2 = 3.1 ns (17%) | τ1 = 800 ps (85%) | τ2 = 5.1 ns (15%) |
| 20 mM | τ1 = 750 ps (75%) | τ2 = 3.5 ns (25%) | τ1 = 1000 ps (73%) | τ2 = 5.2 ns (27%) |
F. Dynamic light scattering of GO dispersion
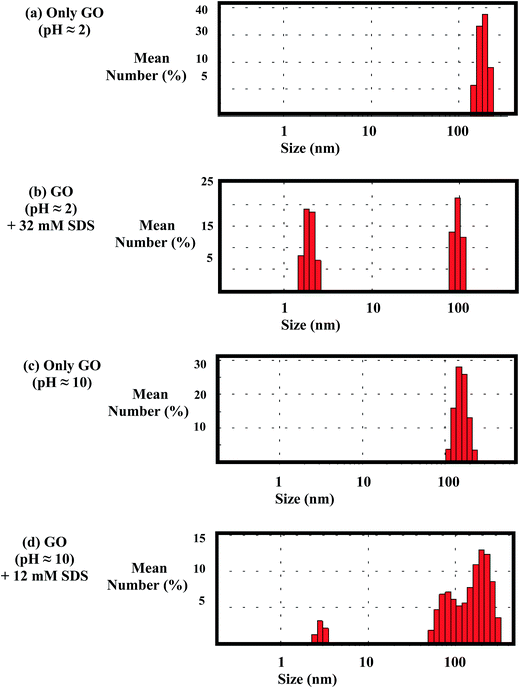
To examine the number of the species present in the aqueous dispersion in acidic (pH ≈ 2) and alkaline medium (pH ≈ 10) in the presence and absence of SDS, the Dynamic Light Scattering (DLS) measurement has been performed. Fig. 11a and b indicates the presence of one type of species having dimension greater than 100 nm. But, addition of SDS changes the scenario. In the acidic medium (pH ≈ 2), DLS data remains unchanged up to 10 mM SDS concentration. This clearly indicates that almost all the SDS molecules are adsorbed on the GO sheets and no free micelles are present in the dispersion. But, in presence of 32 mM SDS, appearance of two different types of particles with size of about 2 nm and 100 nm is suggesting the existence of free micelles (Fig. 11b). In the alkaline dispersion of GO (pH ≈ 10), addition of 12 mM SDS results three different types of species (Fig. 11d). One of them may be obtained as a result of intercalation of SDS between the GO sheets with comparatively larger interlayer separation. The situation in the alkaline dispersion of GO (pH ≈ 10) remains same by the further addition of SDS. Thus, the DLS measurement clearly suggests the existence of two types of GO moieties in presence of SDS at pH ≈ 10.Experimental
Powdered flake graphite was purchased from Sigma-Aldrich. Aniline (Merck) was used without purification. KMnO4, NaNO3, H2O2, H2SO4 (98%) were purchased from Merck as analytical pure reagents. All aqueous suspensions were prepared in double distilled deionized water. The preparation of the solid GO was made on the basis of modified Hummer's method.17,60,61 The solid brown product as pure GO was dispersed in water by sonication and used for spectroscopic study. The concentrations of GO dispersions (both acidic and alkaline pH) for the spectroscopic (UV-visible absorption and emission) and dynamic light scattering measurements were 0.01 mg ml−1. pH of the aqueous GO dispersion was controlled by using very low amount of dilute HCl and dilute NaOH.Absorption spectra of the aqueous dispersion of modified GO was recorded on a Hitachi U-4010 spectrophotometer at room temperature. The steady state emission and fluorescence excitation spectra were measured using a Hitachi Model F-7000 spectrofluorimeter equipped with a 150 W xenon lamp. The lifetime of the GO dispersion was measured by using TCSPC from PTI, USA, with the help of subnanocond pulsed LED source (280 nm having a pulse width of 600 ps). The pulsed LED source of 280 nm was operated at 10 MHz repetition rate driven by a PDL 800-B driver, PicoQuant, Germany. LED profile was measured at the excitation of 280 nm with a band pass of 3 nm using Ludox as the scatterer. Decay measurements using “magic angle” detection with an emission polarizer set at 54.7° were carried out. The decay parameters were measured using nonlinear iterative fitting procedure based on the Marquard algorithm.62 Dynamic light scattering (DLS) measurements were performed on a Nano ZS Zetasizer (Malvern, UK) at 90° scattering angle with a He–Ne laser (λ = 632.8 nm) at 298.15 K. The measurement of each set of different mole fractions was performed three times with an average of 20 measurement runs.
Conclusions
The present work demonstrates the change in luminescence of GO as a result of interaction with an anionic surfactant, SDS, in both acidic and alkaline medium. In the acidic medium (pH ≈ 2) of GO, the surfactant, SDS, is adsorbed on the GO sheets and the critical surfactant aggregation constant (CSAC) is obtained at a SDS concentration greater than 2 mM. Adsorption of SDS on the GO sheets as hemispherical micelles, at pH ≈ 2 modulates the photoluminescence band by providing a nonpolar confined environment. As a result of this, the acidic dispersion of GO in presence of 32 mM SDS shows red edge effects which is a common consequence of restricted solvent relaxation process. Observation of the increase in the fluorescence life time of the fluorophoric moiety of GO with increase in SDS concentration is suggesting the decrease in nonradiative decay process due to lower accessibility of solvent molecules near the GO fluorophores. In the alkaline medium, instead of adsorption on GO sheets, intercalation of SDS molecules within the GO layers may occur and these intercalations enhance the distance between successive GO sheets. This leads to the weakening of π–π stacking interaction between the basal planes of GO. The time resolved photoluminescence and DLS data supports the entire scenario and indicate the presence of two types of GO moieties, one with weak π–π stacking interaction another with almost disrupted π–π interaction between GO sheets containing benzoic acid or phenol like structure due to the intercalation of SDS, results dual photoluminescence band in alkaline medium. The entire work shades light on the interesting photoluminescence features and modulation of photoluminescence spectra of GO by an anionic surfactant (SDS) and thereby will help to develop various kinds of GO based optoelectronic materials.Conflicts of interest
There are no conflicts to declare.Acknowledgements
Authors sincerely acknowledge the Head of the Department of Chemistry for the kind support and the honorable Vice-Chancellor of the Presidency University, Kolkata for laboratory facilities and the funding (FRPDF) required for research. PS, DKP thank CSIR, India and AH thanks UGC, India for the Start-up grant and PD thanks UGC for minor research project fund.References
- K. S. Novoselov, A. K. Geim, S. V. Morozov, D. Jiang, Y. Zhang, S. V. Dubonos, I. V. Grigorieva and A. A. Firsov, Science, 2004, 306, 666–669 CrossRef CAS PubMed.
- K. S. Novoselov, A. K. Geim, S. V. Morozov, D. Jiang, M. I. Katsnelson, I. V. Grigorieva, S. V. Dubonos and A. A. Firsov, Nature, 2005, 438, 197–200 CrossRef CAS PubMed.
- A. K. Geim and K. S. Novoselov, Nat. Mater., 2007, 6, 183–191 CrossRef CAS PubMed.
- A. K. Geim and K. S. Novoselov, Science, 2009, 324, 1530–1534 CrossRef CAS PubMed.
- K. S. Novoselov, V. I. Falko, L. Colombo, P. R. Gellert, M. G. Schwab and K. Kim, Nature, 2012, 490, 192–200 CrossRef CAS PubMed.
- C. N. R. Rao, A. K. Sood, K. S. Subrahmanyam and A. Govindaraj, Angew. Chem., Int. Ed., 2009, 48, 7752–7777 CrossRef CAS PubMed.
- X. Dong, L. Wang, D. Wang, C. Li and J. Jin, Langmuir, 2012, 28, 293–298 CrossRef CAS PubMed.
- L. Qu, Y. Liu, J. B. Baek and L. Dai, ACS Nano, 2010, 4(3), 1321–1326 CrossRef CAS PubMed.
- X. Wang, L. Zhi, N. Tsao, Z. Tomovic, J. Li and K. Mullen, Angew. Chem., Int. Ed., 2008, 47, 2990–2992 CrossRef CAS PubMed.
- S. Zhang, K. Yang, L. Feng and Z. Liu, Carbon, 2011, 49, 4040–4049 CrossRef CAS.
- G. Eda, Y. Y. Lin, C. Mattevi, H. Yamaguchi, H. A. Chen, I. S. Chen, C. W. Chen and M. Chhowalla, Adv. Mater., 2010, 22, 505–509 CrossRef CAS PubMed.
- K. P. Loh, Q. Bao, G. Eda and M. Chhowalla, Nat. Chem., 2010, 2, 1015–1024 CrossRef CAS PubMed.
- D. Kozawa, Y. Miyauchi, S. Mouri and K. Matsuda, J. Phys. Chem. Lett., 2013, 4, 2035–2040 CrossRef CAS PubMed.
- C. Galande, A. D. Mohite, A. V. Naumov, W. Gao, L. Ci, A. Ajayan, H. Gao, A. Srivastava, R. B. Weisman and P. M. Ajayan, Sci. Rep., 2011, 1, 85 CrossRef PubMed.
- S. K. Cushing, M. Li, F. Huang and N. Wu, ACS Nano, 2014, 8, 1002–1013 CrossRef CAS PubMed.
- M. Li, S. K. Cushing, X. Zhou, S. Guo and N. Wu, J. Mater. Chem., 2012, 22, 23374 RSC.
- P. Dutta, D. Nandi, S. Datta, S. Chakraborty, N. Das, S. Chatterjee, U. C. Ghosh and A. Halder, J. Lumin., 2015, 168, 269–275 CrossRef CAS.
- S. K. Pal, Carbon, 2015, 88, 86–112 CrossRef CAS.
- D. A. Dikin, S. Stankovich, E. J. Zimney, R. D. Piner, G. H. B. Dommett, G. Evmenenko, S. T. Nguyen and R. S. Ruoff, Nature, 2007, 448, 457–460 CrossRef CAS PubMed.
- T. Szabó, O. Berkesi, P. Forgo, K. Josepovits, Y. Sanakis, D. Petridis and I. Dekany, Chem. Mater., 2006, 18(11), 2740–2749 CrossRef.
- H. B. Lee, A. V. Raghu, K. S. Yoon and H. M. Jeong, J. Macromol. Sci., Part B: Phys., 2010, 49, 802–809 CrossRef CAS.
- J. Wang, X. Wang, C. Xu, M. Zhang and X. Shang, Polym. Int., 2011, 60, 816–822 CrossRef CAS.
- C. Bao, Y. Guo, L. Song and Y. Hu, J. Mater. Chem., 2011, 21, 13942–13950 RSC.
- N. W. Pu, C. A. Wang, Y. M. Liu, Y. Sung, D. S. Wang and M. D. Ger, J. Taiwan Inst. Chem. Eng., 2012, 43, 140–146 CrossRef CAS.
- K. Zhang, L. Mao, L. L. Zhang, H. S. O. Chan, X. S. Zhao and J. Wu, J. Mater. Chem., 2011, 21, 7302–7307 RSC.
- A. J. Glover, D. H. Adamson and H. C. Schniepp, J. Phys. Chem. C, 2012, 116, 20080–20085 CAS.
- A. G. Hsieh, C. Punckt, S. Korkut and I. A. Aksay, J. Phys. Chem. B, 2013, 117, 7950–7958 CrossRef CAS PubMed.
- A. G. Hsieh, S. Korkut, C. Punckt and I. A. Aksay, Langmuir, 2013, 29(48), 14831–14838 CrossRef CAS PubMed.
- D. Wang, D. Choi, J. Li, Z. Yang, Z. Nie, R. Kou, D. Hu, C. Wang, L. V. Saraf, J. Zhang, I. A. Aksay and J. Liu, ACS Nano, 2009, 3, 907–914 CrossRef CAS PubMed.
- D. Wang, R. Kou, D. Choi, Z. Yang, Z. Nie, J. Li, L. V. Saraf, D. Hu, J. Zhang, G. L. Graff, J. Liu, M. A. Pope and I. A. Aksay, ACS Nano, 2010, 4, 1587–1595 CrossRef CAS PubMed.
- I. A. Aksay, M. Trau, S. Manne, I. Honma, N. Yao, L. Zhou, P. Fenter, P. M. Eisenberger and S. M. Gruner, Science, 1996, 273, 892–898 CAS.
- K. S. Choi, H. C. Lichtenegger, G. D. Stucky and E. W. McFarland, J. Am. Chem. Soc., 2002, 124, 12402–12403 CrossRef CAS PubMed.
- D. Yang, A. Velamakani, G. Bozoklu, S. Park, M. Stoller, R. D. Piner, S. Stankovich, I. Jung, D. A. Field, C. A. Ventrice and R. S. Ruoff, Carbon, 2009, 47, 145–152 CrossRef CAS.
- B. Konkena and S. Vasudevan, J. Phys. Chem. Lett., 2012, 3, 86–872 Search PubMed.
- D. Li, M. B. Mulle, S. Gilje, R. B. Kaner and G. G. Wallace, Nat. Nanotechnol., 2008, 3, 101–105 CrossRef CAS PubMed.
- Z. Kiraly, G. Findenegg, E. Klumpp, H. Schlimper and I. Dekany, Langmuir, 2001, 17, 2420–2425 CrossRef CAS.
- N. R. Tummala, B. P. Grady and A. Striolo, Phys. Chem. Chem. Phys., 2010, 12, 13137–13143 RSC.
- M. Sammalkorpi, A. Z. Panagiotopoulos and M. Haataja, J. Phys. Chem. B, 2008, 112, 12954–12961 CrossRef CAS PubMed.
- P. Dutta, J. Afalla, A. Halder, S. Datta and K. Tominaga, J. Phys. Chem. C, 2017, 121, 1442–1448 CAS.
- A. Bagri, C. Mattevi, M. Acik, Y. J. Chabal, M. Chhowalla and V. B. Shenoy, Nat. Chem., 2010, 2, 581–587 CrossRef CAS PubMed.
- M. Lotya, Y. Hernandez, P. J. King, R. J. Smith, V. L. S. Karlsson, F. M. Blighe, S. De, Z. Wang and I. McGovern, J. Am. Chem. Soc., 2009, 131, 3611–3620 CrossRef CAS PubMed.
- D. Du, H. Song, Y. Nie, X. Sun, L. Chen and J. Ouyang, J. Phys. Chem. C, 2015, 119, 20085–20090 CAS.
- P. Saha, D. K. Pyne, M. Pal, S. Datta, P. K. Das, P. Dutta and A. Halder, J. Lumin., 2017, 181, 138–146 CrossRef CAS.
- S. Bykkam, V. K. Rao, S. C. H. Chakra and T. Thunugunta, Int. J. Adv. Biotechnol. Res., 2013, 4, 142–146 Search PubMed.
- Z. Luo, Y. Lu, L. A. Somers and A. T. C. Johnson, J. Am. Chem. Soc., 2009, 131, 898–899 CrossRef CAS PubMed.
- B. J. Clark, T. Frost and M. A. Russell, UV Spectroscopy: Techniques, Instrumentation, Data Handling/UV Spectrometry Group, Chapman & Hall:London, New York, 1993, vol. 4 Search PubMed.
- L. J. Cote, J. Kim, Z. Zhang, C. Sunb and J. Huang, Soft Matter, 2010, 6, 6096–6101 RSC.
- L. Reynold, J. A. Gardecki, S. J. Frankland, M. L. Hong and M. Maroncelli, J. Phys. Chem., 1996, 100, 10337–10354 CrossRef.
- H. R. Thomas, C. Valles, R. J. Young, I. A. Kinloch, N. R. Wilson and J. P. Rourke, J. Mater. Chem. C, 2013, 1, 338–342 RSC.
- C. Y. Teng, T. F. Yeh, K. I. Lin, S. J. Chen, M. Yoshimura and H. Teng, J. Mater. Chem. C, 2015, 3, 4553–4562 RSC.
- Z. Gan, H. Xu and Y. Haoc, Nanoscale, 2016, 8, 7794–7807 RSC.
- I. B. Berlman, Handbook of florescence spectra of Aromatic Molecules, Academic Press, New York, 2nd Rev. edn, 1971 Search PubMed.
- S. H. Song, M. Jang, H. Yoon, Y. H. Cho, S. Jeon and B. H. Kim, RSC Adv., 2016, 6, 97990–97994 RSC.
- X. Wang, H. Bai and G. Shi, J. Am. Chem. Soc., 2011, 133, 6338–6342 CrossRef CAS PubMed.
- Y. Song, H. Lee, J. Ko, J. Ryu, M. Kim and D. Shon, Bull. Korean Chem. Soc., 2014, 35, 2009–2012 CrossRef CAS.
- W. T. Yip and D. H. Levy, J. Phys. Chem., 1996, 100(28), 11539–11545 CrossRef CAS.
- H. Hosoya, J. Tanaka and S. Nagakura, J. Mol. Spectrosc., 1962, 8, 257–275 CrossRef CAS.
- C. Jagadish and S. J. Pearton, Zinc Oxide Thin Films and Nanostructures Processing Properties and Application, Elsevier Science: Amsterdam, 2011 Search PubMed.
- E. Conwell, Phys. Rev. B: Condens. Matter Mater. Phys., 1998, 57, 14200–14202 CrossRef CAS.
- D. Nandi, K. Gupta, A. K. Ghosh, A. De, N. R. Ray and U. C. Ghosh, Chem. Eng. J., 2013, 220, 107–116 CrossRef CAS.
- D. C. Marcano, D. V. Kosynkin, J. M. Berlin, A. Sinitskii, Z. Sun, A. Slearev, L. B. Alemany, W. Lu and J. M. Tour, ACS Nano, 2010, 4, 4806–4814 CrossRef CAS PubMed.
- P. R. Bevington, Data Reduction and Error Analysis for the Physical sciences, McGraw Hill, New York, 1969, pp. 235–237 Search PubMed.
Footnote |
| † Electronic supplementary information (ESI) available. See DOI: 10.1039/c7ra12024a |
| This journal is © The Royal Society of Chemistry 2018 |

