 Open Access Article
Adsorption of tetracycline antibiotics from an aqueous solution onto graphene oxide/calcium alginate composite fibers
Haotian Zhua,
Tao Chenac,
Jingquan Liu *ac and
Da Li
 *ab
*ab
aLaboratory of Fiber Materials and Modern Textile, The Growing Base for State Key Laboratory, Qingdao University, Qingdao 266071, PR China. E-mail: d.li@qdu.edu.cn
bSchool of Mechanical and Electronical Engineering, Qingdao University, Qingdao 266071, PR China
cSchool of Materials Science and Engineering, Qingdao University, Qingdao 266071, PR China
First published on 10th January 2018
Abstract
In this study, we report the preparation of a novel environmentally friendly and highly efficient adsorbent, graphene oxide/calcium alginate (GO/CA) composite fibers, via a freeze-drying method using calcium chloride as a cross-linking reagent between graphene oxide and sodium alginate. The maximum tetracycline adsorption capacity of the GO/CA composite fibers predicted by the Langmuir model reached 131.6 mg g−1. The adsorption properties of tetracycline onto the fibers were investigated through several parameters including the solution pH, the adsorbent dose, the initial concentration of tetracycline, and the agitation time. The Langmuir and Freundlich adsorption isotherms were used to investigate the adsorption equilibrium. The kinetics of the adsorption process was predicted using the pseudo-first-order and pseudo-second-order kinetic equations. Furthermore, the mechanism of adsorption was investigated, and it was found that the hydrogen bonding and π–π interaction should serve as predominant contributions to the significantly enhanced adsorption capability.
1. Introduction
Antibiotics have been used extensively worldwide in human therapy and the farming industry in which they act selectively on bacteria like the pathogens while leaving the human cells and tissues unaffected.1 However, they have attracted extensive attention from the scientists because a variety of antibiotics have been detected in soil, surface water, groundwater, and even in drinking water in the recent years.2 Antibiotics have been classified as one of the potent pollutants due to their increasing overuse. Since most antibiotics are poorly metabolized and absorbed by the treated humans and animals, large fractions are excreted through urine and feces as an unmodified parent compound.3,4 The widespread use of antibiotics has caused a variety of potential adverse effects such as chronic toxicity, lowering of human immunity,5 and dissemination into antibiotic-resistant genes.6 Antibiotic pollution poses a potential threat to human health. Thus, the removal of antibiotics has become a critical issue.Tetracycline is one of the most frequently used antibiotics, ranking second in production and usage worldwide.7 It has been reported that tetracycline may cause bacterial resistance and thus result in ecological destruction and threaten human health through bioaccumulation in the food chain. Therefore, it is urgent to remove tetracycline from water environment.7,8
A number of techniques have been developed in the recent years to remove tetracycline from an aqueous solution. These include ozonation,9 coagulation,10 photo electrocatalytic degradation,11 ion exchange,12 membrane processing,13 and adsorption.14 Among them, adsorption is a widely used effective technology due to the advantages of easy operation, low-cost, high efficiency, and no risk of highly toxic byproduct.15 The adsorption efficiency is severely affected by the properties, including surface area, porosity, and pore diameter, of an adsorbent and an adsorbate.16 Various adsorbents, such as clay and minerals,4,8 activated clay,17 mats,18–20 humic acid,7 activated carbon,15,21 carbon nanotubes,22–24 graphene oxide,25 and porous hexagonal BN,26 have been investigated for adsorption of tetracycline from aqueous solutions.
Graphene, a novel two-dimensional carbon nanomaterial, has attracted significant scientific interest not only due to its applications in electronics and mechanics,27 but also due to its adsorption capability. The high theoretical specific surface area (2630 m2 g−1) of graphene makes it a promising adsorbent for water treatment. Graphene oxide (GO) is a precursor for graphene preparation. Abundant oxygen-containing functional groups, such as epoxy, hydroxyl, and carboxyl groups, are present at the edge or the GO planes, which make GO extremely hydrophilic and provide the capability to be used in the aquatic and biological environment.3 However, the application of GO in the removal of tetracycline is currently limited due to its biotoxicity to the human cells.14,28 A key issue in applying GO in adsorbing tetracycline is to decrease the dispersibility in the aqueous solutions and the risk of GO to enter the water body.
Sodium alginate, a natural polysaccharide, has been widely used due to its advantages such as low-cost, hydrophilicity, biocompatibility, and nontoxicity.29 The molecular chain of sodium alginate is full of hydroxyl and carboxyl acid groups. Upon the exchange of divalent cations with sodium ions, a three-dimensional network can be achieved. Based on the mechanism, calcium chloride was used as a cross-linking agent to prepare the composite of alginate and GO.30
In this study, graphene oxide/calcium alginate composite fibers were prepared by a freeze-drying method. The adsorption properties of tetracycline onto the fibers were investigated through several parameters including the solution pH, the adsorbent dose, the initial concentration of tetracycline, and the agitation time. Furthermore, the mechanism of adsorption has been investigated in this study.
2. Experimental
2.1 Materials
Sodium alginate was purchased from Fuchen Chemical Reagent Factory (Tianjin, China). Expanded graphite was purchased from Henglide Graphite Ltd. (Qingdao, China). Potassium permanganate was obtained from Economic & Technological Development Zone Fine Chemical Plant (Laiyang, China). Calcium chloride, hydrogen peroxide, sodium nitrate, hydrochloric acid (37%), and concentrated sulfuric acid were bought from Shanghai Sinopharm Chemical Reagent Co. Ltd. Millipore water (18 MΩ) was used in all the experiments. All chemicals were of reagent grade and used as received.2.2 Preparation of graphene oxide
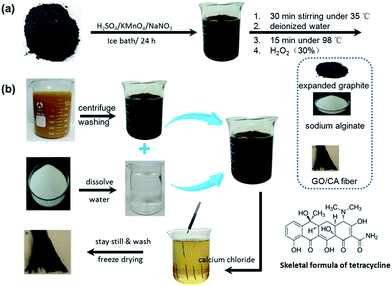
GO was prepared using a modified Hummers method31 (Fig. 1a). Graphite (2 g) was oxidized by concentrated sulfuric acid (10 mL) and phosphorus(V) oxide (1 g) at 80 °C. The resultant dark blue mixture was allowed to cool down to room temperature. Then, the mixture was diluted, filtered, and washed with distilled water until it became neutral. The pre-oxidized graphite was then dried and mixed with cold concentrated H2SO4 (50 mL), followed by a slow addition of KMnO4 (6 g) under stirring and cooling to keep the temperature below 20 °C. The solution was then stirred at 35 °C for 2 h, followed by the addition of distilled water (400 mL). The reaction was stopped with the addition of a mixture of 280 mL of distilled water and 5 mL of 30% H2O2 to afford a bright yellow mixture. The product was then dispersed in water, filtered, washed with an aqueous HCl solution (1![[thin space (1/6-em)]](https://www.rsc.org/images/entities/char_2009.gif) :
:![[thin space (1/6-em)]](https://www.rsc.org/images/entities/char_2009.gif) 10), and then dried under vacuum to afford the GO powder.
10), and then dried under vacuum to afford the GO powder.
2.3 Preparation of graphene oxide/calcium alginate fibers
Herein, 0.041 g of GO was dispersed in deionized water and ultrasonicated for 30 min. Then, 100 mL of a 2 wt% sodium alginate solution was prepared and kept stirring for 1 hour to exclude air bubbles. The GO dispersion was slowly added to the sodium alginate solution to form a homogeneous mixture. The mixture was then injected into 400 mL of a 5% calcium chloride solution using a syringe to afford the GO/CA fibers. After 12 hour still-standing and washing, the GO/CA fibers were finally obtained after vacuum freeze-drying (Fig. 1b).2.4 Adsorption experiments
The adsorption experiments were conducted using the batch equilibration techniques in a temperature-controlled water bath shaker. For the adsorption equilibrium experiments, a fixed adsorbent dose (25 mg) was weighed into 100 mL conical flasks containing 50 mL of different initial concentrations of tetracycline. The mixture was shaken for 5 h at 25 °C until the equilibrium was obtained. Then, the adsorbent was separated from the solution by centrifugation at 10![[thin space (1/6-em)]](https://www.rsc.org/images/entities/char_2009.gif) 000 rpm for 5 min. The concentration of tetracycline in the solution was measured using a UV-visible spectrophotometer (TU-1810, Bingjing Puxi Co. Ltd.) at a wavelength of 274 nm. The adsorption capacity was calculated using the following equation:
000 rpm for 5 min. The concentration of tetracycline in the solution was measured using a UV-visible spectrophotometer (TU-1810, Bingjing Puxi Co. Ltd.) at a wavelength of 274 nm. The adsorption capacity was calculated using the following equation:
 | (1) |
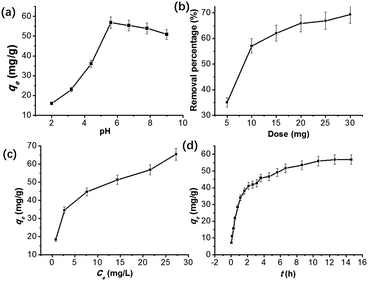
To study the effect of pH of the tetracycline solution on the adsorption capacity, 10 mg graphene oxide/calcium alginate composite was put in 20 mL of a 50 mg L−1 tetracycline solution, whose pH was adjusted from 2 to 9 with an appropriate amount of HCl and NaOH. Moreover, when the effect of the adsorption dose was investigated, different amounts of GO/CA fibers (5 to 30 mg) were added to 20 mL of a 50 mg L−1 tetracycline solution. Furthermore, when the dynamic adsorption tests were conducted, 200 mg of the fibers was put into 400 mL of a 50 mg L−1 tetracycline solution, and the concentration of tetracycline was measured at certain time intervals.
3. Results and discussion
3.1 Characterization of GO and GO/CA
The graphene oxide solution prepared was bright yellow (Fig. 2a) primarily due to the presence of surface-bound functional groups. By washing with deionized water, the pH of the dispersion gradually reached neutrality. As a result, the dispersion became darker, as shown in Fig. 2b. The morphologies of GO and GO/CA were examined by an FEI Quanta 200F field emission scanning electron microscope (SEM). The SEM image of graphene oxide is shown in Fig. 2c, from which we can observe many wrinkles. These wrinkles accounted for the large specific surface area and few-layered characteristics, which would enhance the adsorption capability. The SEM images in Fig. 2d and e show that the GO/CA composites have a very rough surface and many strips. Fourier transform infrared (FTIR) spectra were obtained using a Nicolet 5700 FTIR spectrometer (Thermo Electron Corporation, USA) to investigate the structure and functional groups of GO and GO/CA. The FTIR spectrum of GO (Fig. 3a) shows the typical characteristic functional groups of GO: alkoxy C–O (1045 cm−1), epoxy bridges C–O (1220 cm−1), the aromatic C![[double bond, length as m-dash]](https://www.rsc.org/images/entities/char_e001.gif) C (1615 cm−1) and carboxyl C
C (1615 cm−1) and carboxyl C![[double bond, length as m-dash]](https://www.rsc.org/images/entities/char_e001.gif) O (1738 cm−1) bonds, and hydroxy –OH (3380 cm−1) groups.32 After CA was incorporated into GO, compared with GO alone, GO/CA exhibited few changes. This result could be attributed to the relatively small portion of CA in GO/CA.
O (1738 cm−1) bonds, and hydroxy –OH (3380 cm−1) groups.32 After CA was incorporated into GO, compared with GO alone, GO/CA exhibited few changes. This result could be attributed to the relatively small portion of CA in GO/CA.
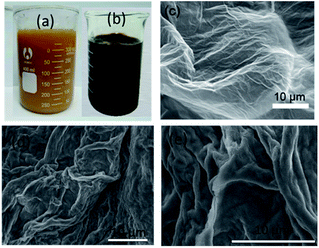 | ||
| Fig. 2 Optical and SEM images of GO and GO/CA. GO dispersion (a) before and (b) after washing; SEM images of (c) GO and (d) GO/CA, and (e) high magnification of GO/CA in (d). | ||
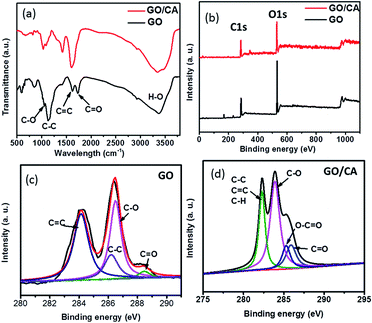 | ||
| Fig. 3 (a) FTIR spectra of GO and GO/CA, (b) XPS spectra of GO and GO/CA, (c) C 1s of GO, and (d) C 1s of GO/CA. | ||
To further demonstrate the carbon-to-oxygen ratio and types of functional groups in GO and GO/CA, XPS was conducted using a Perkin Elmer PHI-5702 multifunctional X-ray photoelectron spectrometer (XPS, Physical Electronics, USA). XPS spectra of GO and GO/CA (Fig. 3b) show the strong C and O signals corresponding to the binding energy of GO. The XPS spectrum of GO (Fig. 3c) shows four different groups: C![[double bond, length as m-dash]](https://www.rsc.org/images/entities/char_e001.gif) C (284.5 eV), C–C (285.4 eV), C–O (286.6 eV), and C
C (284.5 eV), C–C (285.4 eV), C–O (286.6 eV), and C![[double bond, length as m-dash]](https://www.rsc.org/images/entities/char_e001.gif) O (288.8 eV). The C/O atomic ratio of GO was measured by XPS to be 1.58. The XPS spectrum of GO/CA (Fig. 3d) shows the peaks at 282.5, 283.9, 285.3, and 285.9 eV, which correspond to C–C/C–H/C
O (288.8 eV). The C/O atomic ratio of GO was measured by XPS to be 1.58. The XPS spectrum of GO/CA (Fig. 3d) shows the peaks at 282.5, 283.9, 285.3, and 285.9 eV, which correspond to C–C/C–H/C![[double bond, length as m-dash]](https://www.rsc.org/images/entities/char_e001.gif) C, C–O, C
C, C–O, C![[double bond, length as m-dash]](https://www.rsc.org/images/entities/char_e001.gif) O, and O–C
O, and O–C![[double bond, length as m-dash]](https://www.rsc.org/images/entities/char_e001.gif) O, respectively.33
O, respectively.33
3.2 Effect of the factors of GO/CA on tetracycline adsorption
Then, the isotherm data were analyzed by fitting them to distinctive isotherm models to determine an appropriate model for the adsorption process. Langmuir and Freundlich models, two most frequently used models in adsorption, have been chosen to fit the experimental data.
The Langmuir model assumes that the adsorption occurs on an even monolayer surface with no layer interaction. The Langmuir isotherm equation can be expressed as follows:34
 | (2) |
The data are then analyzed by fitting with a non-linear Langmuir equation, and qmax and kL can be calculated by the slope and the intercept of the fitting line (Table 1). The coefficient R2 = 0.9938 of Langmuir equation means that the adsorption of tetracycline on GO/CA fibers fits the Langmuir model. The maximum adsorption capacity qmax of tetracycline on GO/CA fibers at 25 °C was calculated to be 131.6 mg g−1.
| Temperature (°C) | Langmuir | Freundlich | ||||
|---|---|---|---|---|---|---|
| qmax (mg g−1) | kL (L g−1) | R2 | kF (L g−1) | 1/n | R2 | |
| 25 | 131.57 | 0.11 | 0.9938 | 16.11 | 0.41 | 0.9986 |
The Freundlich equation is an empirical equation for a single solute system based on a heterogeneous surface. The Freundlich equation can be written as follows:
 | (3) |
 is an empirical parameter related to the adsorption intensity. The scatter plots are then analyzed to obtain the value of n and kF (Table 1). The coefficient R2 = 0.9986 of the Freundlich equation denotes that the adsorption of tetracycline on GO/CA fibers fits the Freundlich model as well.
3.3 Kinetic studies
The pseudo-first-order and pseudo-second-order were applied to evaluate the kinetic mechanism of the adsorption process. The pseudo-first-order rate model is shown as follows:35
 | (4) |
![[thin space (1/6-em)]](https://www.rsc.org/images/entities/char_2009.gif) (qe − qt) versus t. The values of the kinetic parameters are listed in Table 2. The R2 value was derived to be less than 0.91, indicating that the adsorption process did not fit the pseudo-first-order rate model.
(qe − qt) versus t. The values of the kinetic parameters are listed in Table 2. The R2 value was derived to be less than 0.91, indicating that the adsorption process did not fit the pseudo-first-order rate model.
| Kinetic model | Parameters | Values |
|---|---|---|
| Pseudo-first order | k1 (min−1) | 0.45 |
| qe (mg g−1) | 40.93 | |
| R2 | 0.9020 | |
| Pseudo-second order | k2 (g mg−1 min) | 23.27 × 10⁻³ |
| qe (mg g−1) | 62.50 | |
| R2 | 0.9990 |
The pseudo-second-order rate model is expressed as follows:36
 | (5) |
3.4 Discussion of adsorption mechanism
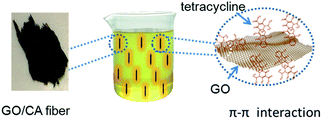
Due to the existence of large amounts of oxygen-containing functional groups (such as –COOH and –OH) on the surface of GO/CA fibers, the tetracycline molecules can be firmly adsorbed onto the fibers through hydrogen bonding and the intermolecular forces between the amino groups (–NH2) on tetracycline and the oxygen-containing functional groups on GO. Moreover, the cations in the tetracycline solution may easily combine with the anions on the GO/CA fiber surface through ionic bonding; this leads to the enhanced adsorption capability. Furthermore, both tetracycline molecules and GO/CA fibers possess benzene rings and double bonds (C![[double bond, length as m-dash]](https://www.rsc.org/images/entities/char_e001.gif) C and C
C and C![[double bond, length as m-dash]](https://www.rsc.org/images/entities/char_e001.gif) O), which will result in a possible π–π stacking interaction.37 All these factors will lead to significantly enhanced adsorption of tetracycline onto GO/CA fibers.
O), which will result in a possible π–π stacking interaction.37 All these factors will lead to significantly enhanced adsorption of tetracycline onto GO/CA fibers.
The main adsorption mechanism of tetracycline (e.g. chlortetracycline, oxytetracycline, and tetracycline) includes hydrogen bonding and π–π interactions (Fig. 5). The tetracycline molecules possess amino groups and carbon radicals etc., which are suitable for the formation of hydrogen bonds with carboxyl and hydroxyl groups on the surface of the GO/CA fibers. There also exists aromatic structures and C![[double bond, length as m-dash]](https://www.rsc.org/images/entities/char_e001.gif) C double bonds in tetracycline, which will also contribute to the affinity between graphene-conjugated basal planes and tetracycline through the π–π interactions and finally increase the adsorption capability.
C double bonds in tetracycline, which will also contribute to the affinity between graphene-conjugated basal planes and tetracycline through the π–π interactions and finally increase the adsorption capability.
4. Conclusions
A novel environmentally friendly and highly efficient adsorbent, a graphene oxide/calcium alginate composite fiber, was prepared by a freeze-drying method. The GO/CA fibers exhibited a high adsorption capability towards tetracycline, and the maximum adsorption capacity calculated by Langmuir model could reach 131.6 mg g−1. The adsorbent showed its maximum adsorption capacity at pH 6. The maximum adsorption capacity increased with an increase in the adsorbent dose, the initial concentration of tetracycline, and the agitation time. It is also found that the adsorption of tetracycline onto GO/CA follows the pseudo-second-order model; this means that the tetracycline adsorption process is controlled by the intra-particle diffusion. In the process of adsorption of aromatic compounds onto graphene oxide, π–π interaction, hydrogen bonding, and electrostatic affinity play a significant role in increasing the adsorption capability of the graphene oxide/calcium alginate composite.Conflicts of interest
There are no conflicts of interest to declare.Acknowledgements
The work was supported by the Natural Science Foundation of Shandong Province (ZR201702210208) and a project of Shandong Province Higher Educational Science and Technology Program (J17KA103). The authors would like to thank Prof. Yanhui Li for the discussion on the adsorption mechanism.Notes and references
- M. B. Ahmed, J. L. Zhou, H. H. Ngo and W. Guo, Sci. Total Environ., 2015, 532, 112 CrossRef CAS PubMed.
- C. Adams, M. Asce, Y. Wang, K. Loftin and M. Meyer, J. Environ. Eng., 2002, 128, 253–260 CrossRef CAS.
- Y. Gao, Y. Li, L. Zhang, H. Huang, J. Hu, S. M. Shah and X. Su, J. Colloid Interface Sci., 2012, 368, 540–546 CrossRef CAS PubMed.
- U. A. Guler and M. Sarioglu, J. Environ. Health Sci. Eng., 2014, 12, 79 CrossRef PubMed.
- O. A. Jones, J. N. Lester and N. Voulvoulis, Trends Biotechnol., 2005, 23, 163–167 CrossRef CAS PubMed.
- L. Aristilde, C. Marichal, J. Miéhé-Brendlé, B. Lanson and L. Charlet, Environ. Sci. Technol., 2010, 44, 7839–7845 CrossRef CAS PubMed.
- C. Gu, K. Karthikeyan, S. D. Sibley and J. A. Pedersen, Chemosphere, 2007, 66, 1494–1501 CrossRef CAS PubMed.
- Y. Guo, W. Huang, B. Chen, Y. Zhao, D. Liu, Y. Sun and B. Gong, J. Hazard. Mater., 2017, 339, 22 CrossRef CAS PubMed.
- M. H. Khan, H. Bae and J.-Y. Jung, J. Hazard. Mater., 2010, 181, 659–665 CrossRef CAS PubMed.
- N. Li, G. P. Sheng, Y. Z. Lu, R. J. Zeng and H. Q. Yu, Water Res., 2017, 111, 204–212 CrossRef CAS PubMed.
- Y. Liu, X. Gan, B. Zhou, B. Xiong, J. Li, C. Dong, J. Bai and W. Cai, J. Hazard. Mater., 2009, 171, 678–683 CrossRef CAS PubMed.
- Y. J. Wang, D. A. Jia, R. J. Sun, H. W. Zhu and D. M. Zhou, Environ. Sci. Technol., 2008, 42, 3254–3259 CrossRef CAS PubMed.
- I. Koyuncu, O. A. Arikan, M. R. Wiesner and C. Rice, J. Membr. Sci., 2008, 309, 94–101 CrossRef CAS.
- Y. Li, Q. Du, T. Liu, J. Sun, Y. Wang, S. Wu, Z. Wang, Y. Xia and L. Xia, Carbohydr. Polym., 2013, 95, 501–507 CrossRef CAS PubMed.
- M. J. Ahmed, Environ. Toxicol. Pharmacol., 2017, 50, 1 CrossRef CAS PubMed.
- F. Yu, Y. Li, S. Han and J. Ma, Chemosphere, 2016, 153, 365–385 CrossRef CAS PubMed.
- C. H. Weng and Y. F. Pan, J. Hazard. Mater., 2007, 144, 355–362 CrossRef CAS PubMed.
- S. Xin, X. Li, Q. Wang, R. Huang, X. Xu, Z. Lei and H. Deng, J. Biomed. Nanotechnol., 2014, 10, 803–810 CrossRef CAS PubMed.
- S. Xin, Z. Zeng, X. Zhou, W. Luo, X. Shi, Q. Wang, H. Deng and Y. Du, J. Hazard. Mater., 2017, 324, 365–372 CrossRef CAS PubMed.
- Y. Lu, X. Li, X. Zhou, Q. Wang, X. Shi, Y. Du, H. Deng and L. Jiang, RSC Adv., 2014, 4, 33355–33361 RSC.
- K. J. Choi, S. G. Kim and S. H. Kim, J. Hazard. Mater., 2008, 151, 38 CrossRef CAS PubMed.
- L. Ji, W. Chen, L. Duan and D. Zhu, Environ. Sci. Technol., 2009, 43, 2322–2327 CrossRef CAS PubMed.
- L. Ji, W. Chen, L. Duan and D. Zhu, Environ. Sci. Technol., 2009, 43, 2322 CrossRef CAS PubMed.
- L. Jiang, H. Tu, Y. Lu, Y. Wu, J. Tian, X. Shi, Q. Wang, Y. Zhan, Z. Huang and H. Deng, Chem. Phys. Lett., 2016, 650, 82–87 CrossRef CAS.
- K. Ouyang, C. Zhu, Y. Zhao, L. Wang, S. Xie and Q. Wang, Appl. Surf. Sci., 2015, 355, 562–569 CrossRef CAS.
- Q. Song, Y. Fang, Z. Liu, L. Li, Y. Wang, J. Liang, Y. Huang, J. Lin, L. Hu and J. Zhang, Chem. Eng. J., 2017, 325, 71–79 CrossRef CAS.
- D. Li, J. Liu, C. J. Barrow and W. Yang, Chem. Commun., 2014, 50, 8197–8200 RSC.
- K. H. Liao, Y. S. Lin, C. W. Macosko and C. L. Haynes, ACS Appl. Mater. Interfaces, 2011, 3, 2607 CAS.
- Y. Liu, S. Chen, L. Zhong and G. Wu, Radiat. Phys. Chem., 2009, 78, 251–255 CrossRef CAS.
- B. Sarmento, S. Martins, A. Ribeiro, F. Veiga, R. Neufeld and D. Ferreira, Int. J. Pept. Res. Ther., 2006, 12, 131–138 CrossRef CAS.
- W. S. Hummers and R. E. Offeman, J. Am. Chem. Soc., 1958, 80, 1339 CrossRef CAS.
- J. Chen, B. Yao, C. Li and G. Shi, Carbon, 2013, 64, 225–229 CrossRef CAS.
- Y. Fei, Y. Li, S. Han and J. Ma, J. Colloid Interface Sci., 2016, 484, 196–204 CrossRef CAS PubMed.
- I. Langmuir, J. Chem. Phys., 2015, 40, 1361–1403 Search PubMed.
- D. Karadag, M. Turan, E. Akgul, A. Sema Tok and A. Faki, J. Chem. Eng. Data, 2007, 52, 1615–1620 CrossRef CAS.
- Y. S. Ho and C. C. Chiang, Adsorption, 2001, 7, 139–147 CrossRef CAS.
- B. Peng, L. Chen, C. Que, K. Yang, F. Deng, X. Deng, G. Shi, G. Xu and M. Wu, Sci. Rep., 2016, 6, 31920 CrossRef CAS PubMed.
| This journal is © The Royal Society of Chemistry 2018 |

