 Open Access Article
Creative Commons Attribution 3.0 Unported Licence
Stable and non-toxic ultrasmall gadolinium oxide nanoparticle colloids (coating material = polyacrylic acid) as high-performance T1 magnetic resonance imaging contrast agents
Xu Miaoa,
Son Long Ho a,
Tirusew Tegafawa,
Hyunsil Chab,
Yongmin Chang*b,
In Taek Ohc,
Ahmad Mohammad Yaseena,
Shanti Marasinia,
Adibehalsadat Ghazanfaria,
Huan Yuea,
Kwon Seok Chaec and
Gang Ho Lee
 *a
*a
aDepartment of Chemistry, Department of Nanoscience and Nanotechnology (DNN), College of Natural Sciences, Kyungpook National University (KNU), Taegu 41566, South Korea. E-mail: ghlee@mail.knu.ac.kr
bDepartment of Molecular Medicine and Medical & Biological Engineering, DNN, School of Medicine, KNU and Hospital, Taegu 41566, South Korea. E-mail: ychang@knu.ac.kr
cDepartment of Biology Education, DNN, Teachers' College, KNU, Taegu 41566, South Korea
First published on 16th January 2018
Abstract
For use as positive (T1) magnetic resonance imaging contrast agents (MRI-CAs), gadolinium oxide (Gd2O3) nanoparticle colloids (i.e. nanoparticles coated with hydrophilic ligands) should be stable, non-toxic, and ultrasmall in particle diameter for renal excretion. In addition, they should have a high longitudinal water proton relaxivity (r1) and r2/r1 ratio that is close to one (r2 = transverse water proton relaxivity) for high-performance. In this study, we report ultrasmall Gd2O3 nanoparticle colloids [coating material = polyacrylic acid, Mw = ∼5100 Da] satisfying these conditions. The particle diameter was monodisperse with an average value of 2.0 ± 0.1 nm. The colloidal suspension exhibited a high r1 value of 31.0 ± 0.1 s−1 mM−1 and r2/r1 ratio of 1.2, where r1 was ∼8 times higher than that of commercial Gd-chelates: the cooperative induction model was proposed to explain this. The effectiveness of the colloidal suspension as a high-performance T1 MRI-CA was confirmed by taking in vivo T1 MR images in a mouse after intravenous administration. Highly positive contrast enhancements were observed in various organs of the mouse such as the liver, kidneys, and bladder. The colloidal suspension was then excreted through the bladder.
Introduction
Magnetic resonance imaging contrast agents (MRI-CAs) allow us to discriminate between normal and abnormal tissues inside the body through the differential contrast enhancement between them.1–3 This occurs owing to the differential population of the MRI-CAs between them. Because the proton spin relaxation times are shortened by the MRI-CAs, higher contrast MR images can be observed in regions where the MRI-CAs are more concentrated. The currently used positive (T1) MRI-CAs are molecular Gd-chelates and generally exhibit longitudinal water proton relaxivity (r1) values of 3–5 s−1 mM−1 (r2/r1 = 1.1–1.2), where r2 is the transverse water proton relaxivity.4–6 However, gadolinium oxide (Gd2O3) nanoparticles have exhibited r1 values higher than these values.7–9 Therefore, the synthesis of high-performance (or powerful) T1 MRI-CAs using Gd2O3 nanoparticles7–9 including various Gd-containing polymeric5 and nanosystems10–13 is currently a hot topic.To be applied as T1 MRI-CAs, Gd2O3 nanoparticle colloids (i.e. nanoparticles coated with hydrophilic ligands) should be stable, non-toxic, and ultrasmall in particle diameter for renal excretion. In addition, they should have a high r1 value and r2/r1 ratio that is close to one for high-performance. For colloidal stability and biocompatibility, Gd2O3 nanoparticles should be coated with hydrophilic and biocompatible ligands. Here, a more hydrophilic ligand is preferred for surface-coating because it can afford a higher colloidal stability and, importantly, a higher r1 value as well,14–16 because it can allow more water molecules to access the nanoparticle. Renal excretion of Gd2O3 nanoparticle colloids is essential for in vivo applications because the Gd3+ ion is toxic. Gd3+ ions can cause nephrogenic systemic fibrosis (NSF) when released inside the body.17–19 Therefore, the particle diameter should be less than 3 nm for renal excretion.20–22 In a previous study, r1 was optimal at a particle diameter of ∼2 nm.23 This implies that high performance T1 MRI-CAs can be synthesized using ultrasmall Gd2O3 nanoparticle colloids with a particle diameter of ∼2 nm, as thus investigated in this study. In addition this study as a continuation of the previous study23 employed polyacrylic acid (PAA) as surface-coating ligand to obtain stable nanoparticle colloids and as a result to achieve high-performance in vivo T1 MRI.
Several Gd-nanosystems with very high r1 values have been reported.14,24–26 Ultrasmall Gd2O3 nanoplates with a diameter of 2 nm coated with PAA–octylamine (OA) showed an r1 value of 47.2 s−1 mM−1 (r2/r1 = 1.7) at 1.41 T.14 Dense Gd3+ ions conjugated on the surface of carbon nanotubes (CNTs) exhibited an r1 value of 70 s−1 mM−1 (r2/r1 = 1.5) at 1.41 T and 37 °C (ref. 24) and those prepared inside CNTs showed an r1 value of 94 s−1 mM−1 at 1.41 T and 37 °C.25 Gd3+-ion clusters within ultra-short single-walled CNTs exhibited an r1 value of 164 s−1 mM−1 in an 1% sodium dodecyl benzene sulfate aqueous solution and 173 s−1 mM−1 in a pluronic F98 surfactant aqueous solution at 1.41 T and 40 °C.26 These r1 values are significantly higher than those of Gd-chelates.4–6 To understand these high r1 values including that observed in this study, a cooperative induction model was proposed. In this model, several Gd3+ ions exposed on the nanoparticle surface or in the Gd3+ ion cluster cooperatively induce the longitudinal water proton relaxation of a water molecule. Using this model, we gave a successful explanation for these high r1 values. It is worth noting that for in vivo applications, spherical nanoparticles are preferred over other shapes and complex systems because of their better transport through capillary vessels. In this respect, the ultrasmall Gd2O3 nanoparticle colloid is one of the potential high-performance T1 MRI-CAs.
In this study, we report the facile one-pot synthesis and in vitro and in vivo characterization of ultrasmall Gd2O3 nanoparticle colloids (core davg = 2.0 nm; coating material = PAA, Mw = ∼5100 Da). PAA was directly coated on the nanoparticle surface. PAA is a well-known biocompatible and hydrophilic polymer,27 possessing one carboxyl group per monomer unit (as a result, numerous carboxyl groups per polymer) (Fig. 1). PAA binds to the nanoparticle surface through electrostatic bonding between its carboxyl groups and Gd3+ ions exposed on the nanoparticle surface. Multiple binding of PAA through its many carboxyl groups with a nanoparticle allows strong binding with the nanoparticle, leading to excellent colloidal stability and biocompatibility. To demonstrate that ultrasmall Gd2O3 nanoparticle colloids can be used as a high-performance T1 MRI-CA, we measured the cellular toxicity, water proton relaxivities, and in vivo T1 MR images after intravenous administration. In addition, the cooperative induction model was employed to explain the observed high r1 value.
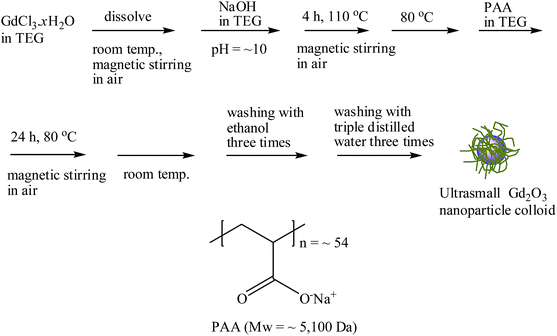 | ||
| Fig. 1 Reaction scheme for the one-pot synthesis of ultrasmall Gd2O3 nanoparticle colloid and PAA structure. | ||
Experimental
Chemicals
All chemicals including GdCl3·xH2O (99.9%), NaOH (>99.9%), triethylene glycol (TEG) (99%), and PAA (Mw = ∼5100 Da) were purchased from Sigma-Aldrich and used as received. Ethanol (99%, Duksan, South Korea) was used for initial nanoparticle washing. Triple distilled water was used for final nanoparticle washing and the preparation of an aqueous colloidal suspension.Synthesis of ultrasmall Gd2O3 nanoparticle colloids
The one-pot synthesis of ultrasmall Gd2O3 nanoparticle colloids (coating material = PAA) is shown in Fig. 1. Three solutions were prepared: (1) a precursor solution made of 1 mmol of GdCl3·xH2O and 10 mL of TEG in a 100 mL three-neck-flask, (2) a solution made of 4 mmol of NaOH and 10 mL of TEG in a 100 mL beaker, and (3) 0.05 mmol of PAA in a mixture of 5 mL of TEG and 5 mL of triple distilled water in a 100 mL beaker. Solution (1) was magnetically stirred at room temperature under atmospheric conditions until the precursor was dissolved in TEG. Solution (2) was slowly added to the precursor solution until the pH of the solution reached ∼10. The resulting mixture solution was gradually heated to 110 °C and magnetically stirred for 4 h. The reaction temperature decreased to 80 °C. Solution (3) was slowly added to the reaction solution, and then the reaction solution was magnetically stirred for 24 h at that temperature. The product solution was cooled to room temperature and transferred to a 500 mL beaker. Then, 400 mL of ethanol was added to the product solution, which was magnetically stirred for 10 min. The product nanoparticle colloids were allowed to settle to the bottom of the beaker for a week in a refrigerator (4 °C). The transparent supernatant was decanted to remove unreacted precursors, free PAA, and TEG. This washing process with ethanol was repeated three times. To remove ethanol, the product solution was diluted with 400 mL of triple distilled water and then concentrated using a rotary evaporator. This process was repeated three times. The obtained concentrated colloidal suspension was split into two equal parts: one part was diluted with triple distilled water to prepare a colloidal suspension (∼30 mM Gd), and the other part was dried in air to obtain a powder sample for various characterizations.General characterizations of ultrasmall Gd2O3 nanoparticle colloids
The particle diameter (d) of the colloidal suspension was measured using a high-resolution transmission electron microscope (HRTEM) (Titan G2 ChemiSTEM CS Probe, FEI) operated at 200 kV. A drop of the sample solution diluted in ethanol was placed on a carbon film supported by a 200-mesh copper grid using a micropipette (Eppendorf, 2–20 μL) and allowed to dry in air at room temperature. The copper grid with nanoparticle colloids was subsequently placed inside the HRTEM vacuum chamber for measurement.The Gd-concentration of the colloidal suspension was determined using an inductively coupled plasma atomic emission spectrometer (ICPAES) (IRIS/AP, Thermo Jarrell Ash Co.). All samples were pre-treated with acids to completely dissolve the nanoparticle colloids in solution before measurement.
A dynamic light scattering (DLS) particle size analyzer (UPA-150, Microtrac) was used to measure the hydrodynamic diameter (a) of the nanoparticle colloids using a sample solution (∼0.01 mM Gd).
The colloidal stability was investigated by measuring the backscattering (BST) of near infrared (NIR) beam (880 nm) as a function of height (h) (h = 5 to 10 mm from the vial bottom containing the sample solution) and time (t) for t = 0 to 3 days using a Turbiscan (Turbiscan AGS, Formulaction).
A multi-purpose X-ray diffractometer (X'PERT PRO MRD, Philips) with unfiltered CuKα radiation (λ = 0.154184 nm) was used to characterize the crystal structures of the powder samples. A scan step of 2θ = 0.03° and a scan range of 2θ = 15–100° were used.
The attachment of PAA to ultrasmall Gd2O3 nanoparticles was probed by recording the Fourier transform infrared (FT-IR) absorption spectra using an FT-IR absorption spectrometer (Galaxy 7020A, Mattson Instruments, Inc.) and employing powder samples pelletized with KBr. The scan range was 400–4000 cm−1.
A thermogravimetric analysis (TGA) instrument (SDT-Q600, TA Instruments) was used to estimate the surface-coating amount by recording the TGA curve between room temperature and 900 °C under an air flow. An average amount of surface-coated PAA was estimated from the mass loss, after taking into account the water and air desorption between room temperature and ∼105 °C. The amount of Gd2O3 was estimated from the remaining mass. It was also estimated by measuring the Gd weight percent of a powder sample using an ICPAES. After TGA, the remaining sample was collected and subjected to X-ray diffraction (XRD) analysis.
Relaxivity and map image measurements
The longitudinal (T1) and transverse (T2) relaxation times and the longitudinal (R1) and transverse (R2) map images were measured using a 1.5 T MRI scanner (GE 1.5 T Signa Advantage, GE Medical Systems) equipped with a knee coil (EXTREM). Aqueous dilute solutions (0.1, 0.05, 0.025, 0.0125, and 0.00625 mM Gd) were prepared via dilution of the concentrated colloidal suspension with triple distilled water. These dilute solutions and triple distilled water were then used to measure the T1 and T2 relaxation times and R1 and R2 map images. Subsequently, the r1 and r2 values of the colloidal suspension were estimated from the slopes of the plots of 1/T1 and 1/T2, respectively, versus the Gd concentration. T1 relaxation time measurements were performed using an inversion recovery method. In this method, the inversion time (TI) was varied at 1.5 T, and the MR images were acquired at 35 different TI values in the range from 50 to 1750 ms. The T1 relaxation times were then obtained from the nonlinear least-squares fits to the measured signal intensities at various TI values. For the measurements of T2 relaxation time, the Carr–Purcell–Meiboom–Gill pulse sequence was used for multiple spin-echo measurements. Then, 34 images were acquired at 34 different echo time (TE) values in the range from 10 to 1900 ms. The T2 relaxation times were obtained from the nonlinear least-squares fits to the mean pixel values for the multiple spin-echo measurements at various TE values. The parameters used for the measurements were as follows: external MR field (H) = 1.5 T; temperature (T) = 22 °C; number of acquisitions (NEX) = 1; field of view (FOV) = 16 cm; FOV phase = 0.5; matrix size = 256 × 128; slice thickness = 5 mm; pixel spacing = 0.625 mm; pixel band width = 122.10 Hz; and repetition time (TR) = 2000 ms.In vitro cytotoxicity measurements
The biocompatibility of the colloidal suspension was determined using a CellTiter-Glo luminescent cell viability assay (Promega), where intracellular adenosine triphosphate (ATP) was quantified using a luminometer (Victor 3, Perkin-Elmer). Human prostate cancer (DU145) and normal mouse hepatocyte (NCTC1469) cell lines (both cell lines were purchased from American Type Culture Collection, Rockville, MD, USA) were seeded on a 24-well cell culture plate and incubated for 24 h (5 vol% CO2, 37 °C). Five test solutions (1.6, 7.9, 15.7, 31.4, and 78.6 μg Gd per mL) were prepared via dilution of the concentrated colloidal suspension with a sterile phosphate-buffered saline solution, and ∼2 μL aliquots were used to treat the cells, which were subsequently incubated for 48 h. The viability of the treated cells was measured and normalized with respect to that of untreated control cells. Each measurement was performed in duplicate to obtain the average cell viabilities.Animal experiment
This study was performed in accordance with the Korean guidelines and approved by the animal research committee of Kyungpook National University.In vivo T1 MR image measurements in the mouse
One SD (Sparague Dawley®) mouse was used for in vivo test. In vivo T1 MR images were acquired using the same MRI scanner that was used for the water proton relaxation time measurements. For imaging, the mouse (∼120 g) was anesthetized using 1.5% isoflurane in oxygen. Measurements were performed before and after injection of the colloidal suspension into the mouse tail vein. The injection dose was typically ∼0.05 mmol Gd per kg. After the measurement, the mouse was revived from the anesthesia and placed in a cage with free access to food and water. During the measurement, the temperature of the mouse was maintained at ∼37 °C using a warm water blanket. The parameters used for the measurements were as follows: H = 1.5 T; T = 37 °C; NEX = 4; FOV = 9 mm; phase FOV = 0.5; matrix size = 256 × 192; slice thickness = 1 mm; spacing gap = 0.5 mm; pixel bandwidth = 15.63 Hz; TR = 500 ms; and TE = 13 ms.Results and discussion
Particle diameter, hydrodynamic diameter, and crystal structure
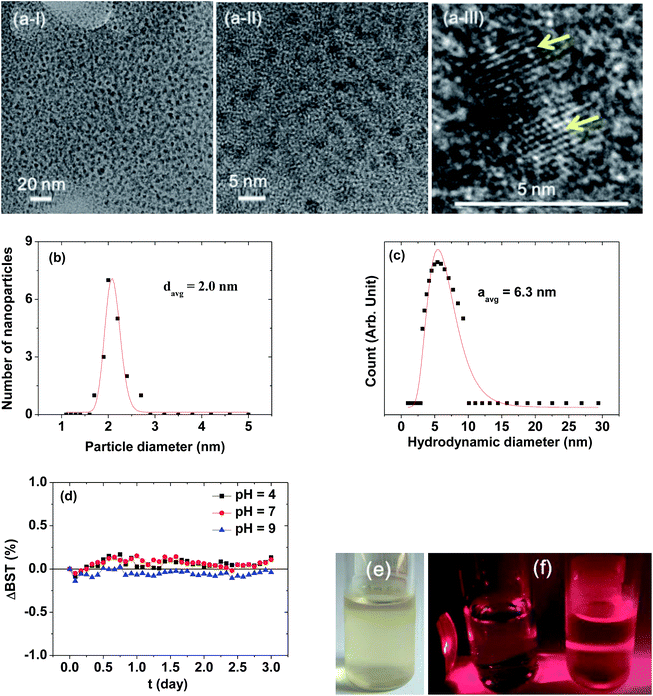
Fig. 2a presents HRTEM images, showing a monodisperse particle size distribution. The average particle diameter (davg) was estimated to be 2.0 ± 0.1 nm from a log-normal function fit to the observed particle diameter distribution (Fig. 2b and Table 1). The average nanoparticle hydrodynamic diameter (aavg) was estimated to be 6.3 ± 0.1 nm from a log-normal function fit to the observed hydrodynamic diameter distribution (Fig. 2c and Table 1). The colloidal stability was investigated by measuring the BST of NIR beam as a function of t for 3 days. The ΔBST (t) corresponding to average BST (t) minus average BST (0) in which the average BST (t) is the average of backscattered NIR beams for all h (h = 5–10 mm) at a scan time t, exhibited negligible deviations from zero (Fig. 2d), confirming the stable colloidal suspensions at solution pH = 4–9. Note that the ΔBST (t) is zero for ideal colloids. A sample solution photo is provided in Fig. 2e. The colloidal suspension was transparent and did not settle at the bottom of the vial for at least six months, indicating excellent colloidal stability. The Tyndall effect supported the presence of colloids (Fig. 2f): the right vial containing a sample solution exhibited light scattering due to the colloidal suspension, whereas the left vial containing triple distilled water did not.| davg (nm) | aavg (nm) | PAA surface-coating amount | Water proton relaxivities (22 °C, 1.5 T) | |||
|---|---|---|---|---|---|---|
| P (weight%) | σ (nm−2) | NNP (polymers) | r1 (s−1 mM−1) | r2 (s−1 mM−1) | ||
| a P: average weight percent of PAA coated per nanoparticle. σ: grafting density corresponding to the number of PAA coated per nanoparticle unit surface area. NNP: number of PAA coated per nanoparticle. | ||||||
| 2.0 ± 0.1 | 6.3 ± 0.1 | 53.7 ± 0.5 | 1.0 ± 0.1 | 13 ± 1 | 31.0 ± 0.1 | 37.4 ± 0.1 |
The XRD pattern of the as-prepared powder sample was broad and amorphous (the bottom XRD pattern in Fig. 3) owing to the ultrasmall particle size. However, after TGA, the sample exhibited the cubic structure of bulk Gd2O3 (the top XRD pattern in Fig. 3), which is attributed to crystal growth during exposure to temperatures up to 900 °C, as previously observed.28 The estimated lattice constant of the TGA-treated powder sample was 10.815 Å, which agrees with the reported value of 10.813 Å.29
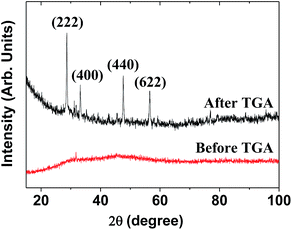 | ||
| Fig. 3 XRD patterns before and after TGA. The strong peaks in the TGA-treated sample were assigned with (hkl) Miller indices for cubic Gd2O3. | ||
Surface-coating results
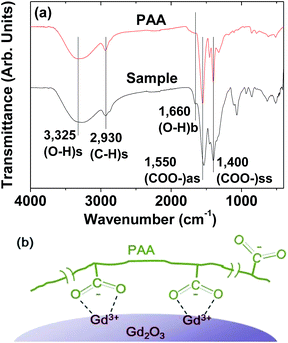
The PAA-coating on the nanoparticle surface was investigated by recording the FT-IR absorption spectrum. The FT-IR absorption spectrum of free PAA was also recorded for comparison (the top FT-IR absorption spectrum in Fig. 4a). The sample featured characteristic PAA vibrations at 2930 cm−1 (C–H stretching), 1550 cm−1 (COO− antisymmetric stretching), and 1400 cm−1 (COO− symmetric stretching) (the bottom FT-IR absorption spectrum in Fig. 4a). PAA binds to the nanoparticle through electrostatic bonding between the COO− groups of PAA and Gd3+ ions exposed on the nanoparticle surface. This bonding corresponds to hard acid (COO− group of PAA) – hard base (Gd3+ ion exposed on the nanoparticle surface) type of bonding.30–32 Because each PAA (Mw = ∼5100 Da) has ∼54 monomer units and each monomer has a COO− group (Fig. 1), multiple bonding between many COO− groups of PAA and the nanoparticle is possible, forming a stable nanoparticle colloid. According to this, the surface-coating structure of PAA on the ultrasmall Gd2O3 nanoparticle surface is drawn in Fig. 4b. As estimated from TGA data (Fig. 5), approximately 13 PAA polymers were coated on each nanoparticle surface. Among approximately 54 COO− groups per PAA, part of them are conjugated to Gd3+ ions exposed on the nanoparticle surface and the remaining ones are free.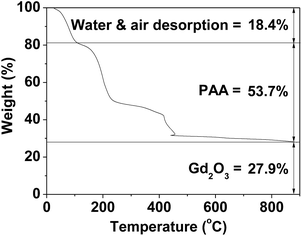 | ||
| Fig. 5 TGA curve showing the PAA surface-coating amount (53.7%) in weight percent. The weight percents of water and air (18.4%) and Gd2O3 (27.9%) are also provided. | ||
The amount (P) of surface-coated PAA in weight percent was estimated to be 53.7 ± 0.5% by measuring the mass loss in a TGA curve, after considering the water and air desorption (18.4 ± 0.5%) between room temperature and ∼105 °C (Fig. 5 and Table 1). The remaining mass was due to Gd2O3 (27.9 ± 0.5%), which was consistent with 31.0% estimated using the Gd weight percent of 26.9 obtained from ICPAES analysis of the powder sample. The grafting density (σ), which corresponds to the average number of PAA coated per nanoparticle unit surface area,33 was estimated to be 1.0 ± 0.1 nm−2 using the bulk density of Gd2O3 (7.41 g cm−3),34 the aforementioned estimated value of P, and the average particle diameter determined via HRTEM imaging. By multiplying σ by the nanoparticle surface area (πdavg2), the average number (NNP) of PAA coated per nanoparticle was estimated to be 13 ± 1 (Table 1). This large value indicates that each ultrasmall Gd2O3 nanoparticle was sufficiently coated with PAA. This explains the excellent colloidal stability and biocompatibility that were observed in this study.
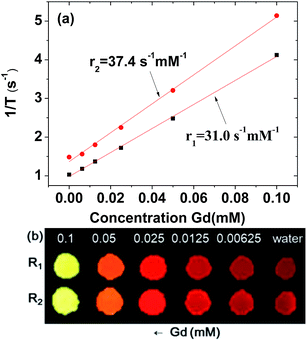
Water proton relaxivities and map images
To estimate r1 and r2 values, inverse water proton relaxation times (1/T1 and 1/T2) were plotted as a function of the Gd concentration (Fig. 6a). The r1 and r2 values were estimated to be 31.0 ± 0.1 and 37.4 ± 0.1 s−1 mM−1 (r2/r1 = 1.2), respectively, from the corresponding slopes (Table 1). This high r1 value and r2/r1 ratio close to one, suggest that the synthesized ultrasmall Gd2O3 nanoparticle colloids are suitable for high-performance T1 MRI-CA. This is confirmed in vitro by their R1 and R2 map images, which show clear dose-dependent contrast enhancements (Fig. 6b).The r1 value of the ultrasmall Gd2O3 nanoparticle colloid was compared with those of other Gd-nanosystems (Table 2). First of all, it was ∼8 times higher than those4–6 of commercial Gd-chelates. It was also higher than those of Gd2O3 nanoparticles with larger particle diameters,15,35,36 primarily owing to its higher surface-to-volume ratio. For the similar particle size, the nanoplate14 exhibited an r1 value of 47.2 s−1 mM−1 which is higher than that of the ultrasmall Gd2O3 nanoparticle colloid. This is likely because the surface area of the nanoplate is larger than that of the spherical nanoparticle. Our previous study indicated that the optimal particle diameter of Gd2O3 nanoparticles for an optimal r1 value is approximately 2 nm.23 A similar particle diameter dependence of the r1 value was observed in gadolinium oxide nanoplates,14 hybrid gadolinium oxide nanoparticles,20 and ultrasmall NaGdF4 nanoparticles.37 This implies that the most suitable particle diameter of Gd2O3 nanoparticles for high-performance T1 MRI-CAs is approximately 2 nm, which was used in this study.
| Chemical | Particle diameter (nm) | Ligand | Temperature (°C) | Applied field (T) | r1 (s−1 mM−1) | r2/r1 | Ref. |
|---|---|---|---|---|---|---|---|
| a DTPA: diethyleneaminepentaacetic acid. Mal-PEG-NHS-MPTS: α-maleinimido-ω-carboxysuccinimidyl ester poly(ethylene glycol)-(3-mercaptopropyl)tri-methoxysilane. PAA–OA: polyacrylic acid–octylamine. | |||||||
| Gd3+ | — | DTPA | 19.5 | 1.5 | 4.1 | 1.1 | 6 |
| Free Gd3+ | — | — | 19.5 | 1.5 | 10.5 | 1.2 | 6 |
| Gd2O3 nanoplate | 2 | Oleic acid | — | 1.41 | 8.0 | 3.3 | 14 |
| Gd2O3 nanoplate | 2 | PAA–OA | — | 1.41 | 47.2 | 1.7 | 14 |
| Gd2O3 nanoparticle | 3–5 | Mal-PEG-NHS-MPTS | 22 | 1.5 | 22.8 | 1.4 | 15 |
| Gd2O3 nanoparticle | 20–40 | Dextran | 37 | 7.05 | 4.8 | 3.5 | 35 |
| Gd2O3 nanoparticle | 2.0 | PAA | 22 | 1.5 | 31.0 | 1.2 | This work |
Cooperative induction model for the observed high r1 value
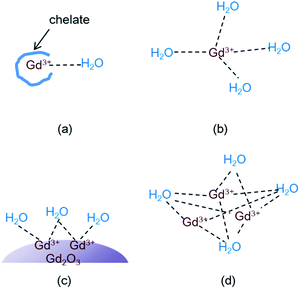
Theory of water proton relaxation is very complex.4,5,38 To understand high r1 values observed in this study and in various Gd-nanosystems,14,24–26 however, a simple cooperative induction model was empirically proposed here. In this model, several Gd3+ ions on the nanoparticle surface or in the dense Gd3+ ion cluster cooperatively induce the longitudinal water proton relaxation of a water molecule. Therefore, the r1 value increases with increasing the number (N) of the Gd3+ ions interacting with a water molecule because a water molecule experiences stronger induction of its longitudinal water proton relaxation if many Gd3+ ions cooperatively induce its longitudinal water proton relaxation than by a single Gd3+ ion. In addition the r1 value increases with increasing the coordination number (q) of the Gd3+ ion with water molecules. Therefore, as the sum of the values (N + q) increases, the r1 value increases. However, the N (i.e. the cooperative induction) effect on r1 is more significant than the q effect as described below. To illustrate this and the cooperative induction, four Gd-systems are depicted in Fig. 7. Both the Gd-chelate and free Gd3+ ion have no cooperative induction effect because their N equals 1. Therefore, as given in Table 2, the higher r1 value of the free Gd3+ ion (1 ≤ q ≤ 9) compared with the Gd-chelate (q = 1) is owing to its higher q value. This study revealed that r1 value of the ultrasmall Gd2O3 nanoparticle (1 ≤ q ≤ 6 for a cubic Gd2O3, N > 1) was ∼3 times higher than that of the free Gd3+ ion even though the latter has a higher q value. Therefore, the higher r1 value of the former is due to its higher N value compared with the latter. This indicates that the N should play a more significant role in r1 value than the q does. Both N and q values of the dense Gd3+ ion cluster are higher than the respective values of the ultrasmall Gd2O3 nanoparticle: q of the Gd3+ ion in the dense Gd3+ ion cluster is similar to that of the free Gd3+ ion and thus higher than that of the nanoparticle, and N of the Gd3+ ion cluster is also higher than that of the nanoparticle because all the Gd3+ ions in the Gd3+ ion clusters can contribute to inducing the longitudinal water proton relaxation whereas in nanoparticles, only the Gd3+ ions exposed on the nanoparticle surface dominantly contribute to the induction. This explains r1 values of 70–173 s−1 mM−1 of the dense Gd3+ ion clusters prepared inside and outside CNTs,24–26 which were 2 to 6 times higher than that of the ultrasmall Gd2O3 nanoparticle in this study. In this way, all the experimental observations of r1 (Gd3+ ion cluster) > r1 (ultrasmall Gd2O3 nanoparticle) > r1 (free Gd3+) > r1 (Gd3+-chelate) can be explained using this simple model. Therefore, the cooperative induction effect plays an important role in r1 value and thus should be considered in designing high-performance T1 MRI-CAs with high r1 values.Cytotoxicity results
The biocompatibility of the colloidal suspension was demonstrated in vitro by measuring cellular cytotoxicities using DU145 and NCTC1469 cell lines. As shown in Fig. 8, the colloidal suspension was non-toxic up to 78.6 μg Gd per mL and thus, suitable for in vivo applications. Recently, accumulation of Gd in the brain has been a big issue due to possible neurotoxicity. Therefore, a further study to evaluate the Gd deposition in the brain ex vivo is needed, which will be carried out in a future.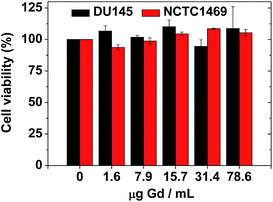 | ||
| Fig. 8 In vitro cellular cytotoxicities of a sample solution in DU145 and NCTC1469 cell lines, showing non-toxicity up to 78.6 μg Gd per mL. | ||
In vivo T1 MR images
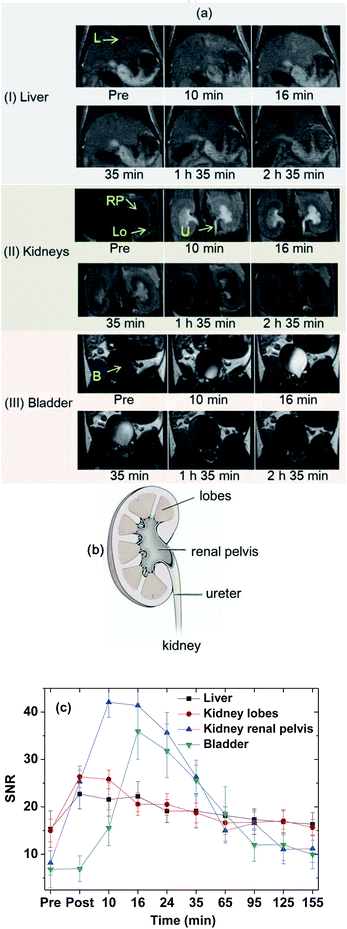
The effectiveness of the colloidal suspension as a high-performance T1 MRI contrast agent was evaluated by taking in vivo T1 MR images in a mouse after intravenous administration into the tail. As shown in Fig. 9a, positive contrast enhancements were observed in the liver, kidney lobes, kidney renal pelvis, ureter, and bladder and then decreased with time because of the excretion of the nanoparticle colloids through the bladder. In addition, owing to the high contrasts and ultrasmall diameters, excretion of the nanoparticle colloids through the lobes, renal pelvis, and ureter of the kidneys (see Fig. 9b for nomenclature) was observed. To clearly show contrast changes with time, the signal-to-noise ratios (SNRs) of region of interests (ROIs) in organs (labelled as circles in Fig. 9a) were plotted as a function of time (Fig. 9c), exhibiting that the contrasts initially increased, reached the maxima, and then decreased with time in all organs. For the liver, the nanoparticle colloids showed the highest contrast enhancement around 10 min after intravenous administration and then the contrast gradually decreased with time. This contrast enhancement pattern in the liver suggests that the nanoparticle colloids were not taken up by reticuloendothelial system of the liver. The colloidal suspension was finally excreted through the bladder, which is consistent with the other ultrasmall nanoparticle systems' behavior with d < 3 nm.20–22As demonstrated, the ultrasmall Gd2O3 nanoparticle colloids were stable and non-toxic and excreted through the renal system owing to their ultrasmall particle diameter, proving their suitability for use as T1 MRI-CA. In addition they exhibited a very high r1 value with an r2/r1 ratio close to one, and as a result, high contrast T1 MR images in the mouse. Therefore, the ultrasmall Gd2O3 nanoparticle colloids synthesized in this study can be used as a high-performance T1 MRI-CA.
Conclusions
We reported the facile one-pot synthesis and characterization of ultrasmall Gd2O3 nanoparticle colloids (coating material = PAA, Mw = ∼5100 Da) in vitro and in vivo. The results are as follows.(1) The particle diameter was monodisperse and ultrasmall (core davg = 2.0 ± 0.1 nm).
(2) The colloidal suspension was stable and biocompatible owing to the PAA-coating on the nanoparticle surface. Cytotoxicity tests using two cell lines showed non-toxicity up to 78.6 μg Gd per mL.
(3) The colloidal suspension exhibited r1 = 31.0 ± 0.1 and r2 = 37.4 ± 0.1 s−1 mM−1 (r2/r1 = 1.2). The r1 value was ∼8 times higher than those of commercial Gd-chelates. We attribute this to the ultrasmall particle diameter and the hydrophilic PAA-coating on the nanoparticle surface. The cooperative induction model was proposed to explain this high r1 value.
(4) The colloidal suspension exhibited high contrast T1 MR images in various organs of the mouse after intravenous administration and was finally excreted through the renal system. Therefore, the synthesized ultrasmall Gd2O3 nanoparticle colloids should be a potential candidate for use as a high-performance T1 MRI-CA.
Author contributions
Xu Miao carried out synthesis, measurements and characterizations, Son Long Ho contributed to the synthesis, Hyunsil Cha and Yongmin Chang measured relaxivities and MR images, In Taek Oh and Kwon Seok Chae measured cellular toxicities, Tirusew Tegafaw, Ahmad Mohammad Yaseen, Shanti Marasini, Adibehalsadat Ghazanfari and Huan Yue contributed to experiments, and Gang Ho Lee wrote the manuscript.Conflicts of interest
There are no conflicts to declare.Acknowledgements
This study was supported by the Basic Science Research Program (Grant No. 2017R1A2B3003214 to YC and 2016R1D1A3B01007622 to GHL) and the Basic Research Laboratory (BRL) Program (Grant No. 2013R1A4A1069507) of the National Research Foundation funded by the Ministry of Education, Science, and Technology.Notes and references
- R. Weissleder and U. Mahmood, Radiology, 2001, 219, 316–333 CrossRef CAS PubMed.
- J. C. Paeng and D. S. Lee, Open Nucl. Med. J., 2010, 2, 145–152 CrossRef.
- T. F. Massoud and S. S. Gambhir, Genes Dev., 2003, 17, 545–580 CrossRef CAS PubMed.
- R. B. Lauffer, Chem. Rev., 1987, 87, 901–927 CrossRef CAS.
- P. Caravan, J. J. Ellison, T. J. McMurry and R. B. Lauffer, Chem. Rev., 1999, 99, 2293–2352 CrossRef CAS PubMed.
- M.-A. Fortin, R. M. Petoral Jr, F. Söderlind, A. Klasson, M. Engström, T. Veres, P.-O. Käll and K. Uvdal, Nanotechnology, 2007, 18, 395501 CrossRef.
- J. Y. Park, Y. Chang and G. H. Lee, Curr. Med. Chem., 2015, 22, 569–581 CrossRef CAS PubMed.
- T. J. Kim, K. S. Chae, Y. Chang and G. H. Lee, Curr. Top. Med. Chem., 2013, 13, 422–433 CrossRef CAS PubMed.
- W. Xu, K. Kattel, J. Y. Park, Y. Chang, T. J. Kim and G. H. Lee, Phys. Chem. Chem. Phys., 2012, 14, 12687–12700 RSC.
- I.-F. Li, C.-H. Su, H.-S. Sheu, H.-C. Chiu, Y.-W. Lo, W.-T. Lin, J.-H. Chen and C.-S. Yeh, Adv. Funct. Mater., 2008, 18, 766–776 CrossRef CAS.
- H. Hifumi, S. Yamaoka, A. Tanimoto, D. Citterio and K. Suzuki, J. Am. Chem. Soc., 2006, 128, 15090–15091 CrossRef CAS PubMed.
- F. Evanics, P. R. Diamente, F. C. J. M. van Veggel, G. J. Stanisz and R. S. Prosser, Chem. Mater., 2006, 18, 2499–2505 CrossRef CAS.
- J. D. Rocca and W. Lin, Eur. J. Inorg. Chem., 2010, 24, 3725–3734 CrossRef.
- M. Cho, R. Sethi, J. S. Ananta narayanan, S. S. Lee, D. N. Benoit, N. Taheri, P. Decuzzib and V. L. Colvin, Nanoscale, 2014, 6, 13637–13645 RSC.
- M. Ahrén, L. Selegård, A. Klasson, F. Söderlind, N. Abrikossova, C. Skoglund, T. Bengtsson, M. Engström, P.-O. Käll and K. Uvdal, Langmuir, 2010, 26, 5753–5762 CrossRef PubMed.
- J. Fang, P. Chandrasekharan, X.-L. Liu, Y. Yang, Y.-B. Lv, C.-T. Yang and J. Ding, Biomaterials, 2014, 35, 1636–1642 CrossRef CAS PubMed.
- H. S. Thomsen, Eur. J. Radiol., 2006, 16, 2619–2621 CrossRef PubMed.
- S. Gao, M.-L. Chen and Z.-H. Zhou, Dalton Trans., 2014, 43, 639–645 RSC.
- J. G. Penfield and R. F. Reilly, Nat. Clin. Pract. Nephrol., 2007, 3, 654–668 Search PubMed.
- J.-L. Bridot, A.-C. Faure, S. Laurent, C. Rivière, C. Billotey, B. Hiba, M. Janier, V. Josserand, J.-L. Coll, L. V. Elst, R. Muller, S. Roux, P. Perriat and O. Tillement, J. Am. Chem. Soc., 2007, 129, 5076–5084 CrossRef CAS PubMed.
- H. S. Choi, W. Liu, P. Misra, E. Tanaka, J. P. Zimmer, B. I. Ipe, M. G. Bawendi and J. V. Frangioni, Nat. Biotechnol., 2007, 25, 1165–1170 CrossRef CAS PubMed.
- J. F. Hainfeld, D. N. Slatkin, T. M. Focella and H. M. Smilowitz, Br. J. Radiol., 2006, 79, 248–253 CrossRef CAS PubMed.
- J. Y. Park, M. J. Baek, E. S. Choi, S. Woo, J. H. Kim, T. J. Kim, J. C. Jung, K. S. Chae, Y. Chang and G. H. Lee, ACS Nano, 2009, 3, 3663–3669 CrossRef CAS PubMed.
- A. Gizzatov, V. Keshishian, A. Guven, A. M. Dimiev, F. Qu, R. Muthupillai, P. Decuzzi, R. G. Bryant, J. M. Tour and L. J. Wilson, Nanoscale, 2014, 6, 3059–3063 RSC.
- A. Gizzatov, M. Hernández-Rivera, V. Keshishian, Y. Mackeyev, J. J. Law, A. Guven, R. Sethi, F. Qu, R. Muthupillai, M. D. G. Cabreira-Hansen, J. T. Willerson, E. C. Perin, Q. Ma, R. G. Bryant and L. J. Wilson, Nanoscale, 2015, 7, 12085–12091 RSC.
- B. Sitharaman, K. R. Kissell, K. B. Hartman, L. A. Tran, A. Baikalov, I. Rusakova, Y. Sun, H. A. Khant, S. J. Ludtke, W. Chiu, S. Laus, É. Tóth, L. Helm, A. E. Merbach and L. J. Wilson, Chem. Commun., 2005, 3915–3917 RSC.
- E. S. Yim, B. Zhao, D. Myung, L. C. Kourtis, C. W. Frank, D. Carter, R. L. Smith and S. B. Goodman, J. Biomed. Mater. Res., 2009, 91, 894–902 CrossRef PubMed.
- K. Kattel, J. Y. Park, W. Xu, H. G. Kim, E. J. Lee, B. A. Bony, W. C. Heo, J. J. Lee, S. Jin, J. S. Baeck, Y. Chang, T. J. Kim, J. E. Bae, K. S. Chae and G. H. Lee, ACS Appl. Mater. Interfaces, 2011, 3, 3325–3334 CAS.
- Gd2O3, JCPDS-International Centre for Diffraction Data, card no. 43-1014, PCPDFWIN, 1997.
- R. G. Pearson, J. Am. Chem. Soc., 1963, 85, 3533–3539 CrossRef CAS.
- R. G. Pearson, J. Chem. Educ., 1968, 45, 581–587 CrossRef CAS.
- R. G. Pearson, J. Chem. Educ., 1968, 45, 643–648 CrossRef CAS.
- M. K. Corbierre, N. S. Cameron and R. B. Lennox, Langmuir, 2004, 20, 2867–2873 CrossRef CAS PubMed.
- W. M. Haynes, D. R. Lide and T. J. Bruno, CRC Handbook of Chemistry and Physics, CRC Press, Boca Raton, USA, 96th edn, 2015–2016, pp. 4–64 Search PubMed.
- M. A. McDonald and K. L. Watkin, Acad. Radiol., 2006, 13, 421–427 CrossRef PubMed.
- M. A. McDonald and K. L. Watkin, Invest. Radiol., 2003, 38, 305–310 CAS.
- N. J. J. Johnson, W. Oakden, G. J. Stanisz, R. S. Prosser and F. C. J. M. van Veggel, Chem. Mater., 2011, 23, 3714–3722 CrossRef CAS.
- A. Roch, R. N. Muller and P. Gillis, J. Chem. Phys., 1999, 110, 5403–5411 CrossRef CAS.
| This journal is © The Royal Society of Chemistry 2018 |

