
 Open Access Article
 This Open Access Article is licensed under a Creative Commons Attribution-Non Commercial 3.0 Unported Licence
Adsorptive removal of antibiotics from water using peanut shells from agricultural waste
Rui Li abc,
Yuling Zhang*abc,
Wenlei Chuabc,
Zaixing Chenabc and
Jiali Wangabc
abc,
Yuling Zhang*abc,
Wenlei Chuabc,
Zaixing Chenabc and
Jiali Wangabc
aKey Laboratory of Groundwater Resources and Environment, Ministry of Education, Jilin University, Changchun 130021, China. E-mail: lingling29@126.com
bCollege of Environment and Resources, Jilin University, Changchun 130021, China
cInstitute of Water Resources and Environment, Jilin University, Changchun 130021, China
First published on 11th April 2018
Abstract
The residues of sulfonamides in the environment have received widespread attention because of their potential hazards. In this study, the potential of peanut shells for antibiotic removal from aqueous solutions was investigated for four antibiotics (sulfamerazine, sulfamethazine, sulfathiazole, and sulfamethoxazole). The properties of the peanut shells were characterized using Brunauer–Emmett–Teller method, X-ray photoelectron spectroscopy, scanning electron microscopy and Fourier-transform infrared spectroscopy analyses, and the results of the analyses showed that the significant properties of peanut shells were mainly attributed to the antibiotics' adsorption process. A batch adsorption experiment was conducted to study the effect of dosage, concentration, and water factors (Fe3+, Mn2+, and Ca2+) on antibiotic adsorption. Adsorption kinetics and isotherms were also studied. The kinetic data showed that a pseudo-second order kinetic model fitted the experimental data, the adsorption isotherm experimental data fitted the Henry linear adsorption model well, and methanol was found to be an effective eluent for desorption of the antibiotics. The results indicate that peanut shells are a promising material for the removal of antibiotics from contaminated water, when present at low initial concentrations.
1 Introduction
Sulfonamides are broad-spectrum synthetic antimicrobials that have the advantages of stable chemical properties and ease of use. Sulfonamides are widely used in the prevention and treatment of bacterial infections in livestock, and are also used as animal growth promoters.1–3 Antibiotics are a new type of trace organic pollutant, and antibiotic residues in the environment have become a potential environmental and ecological hazard, affecting the normal activity of microbiological, animal, and plant life, and ultimately human health.4,5 In summary, antibiotic contamination is an issue that cannot be ignored.Recently, emerging environmental contaminants, including antibiotics and antibiotic resistance genes, have been detected in various environments,6–9 and there are many reports concerning the detection of antibiotics in soil, water, and sediment samples.10–12 In 1983, a variety of antibiotics were detected in surface waters and groundwater in countries such as Italy, South Korea, Sweden, and the USA.13–16 Erythromycin, norfloxacin, and sulfamethoxazole (SMX) have been detected in Oceania.17 Antibiotics have also been detected in domestic sewage and livestock wastewater in China.18 Adsorption and degradation of antibiotic residues can occur in the unsaturated soil zone and in aquifers and the adsorption and migration of sulfachlorpyridazine has been studied, and the results showed that sulfachlorpyridazine demonstrates strong migration behavior in soil, with an adsorption coefficient of 0.9–18.1 mL g−1.19 Wang et al.20 used the EPI Suite software (EPA, USA) to study the groundwater ubiquity score (GUS) of four antibiotics, and the GUS values were >2.8, indicating that these four antibiotics have high levels of leaching and migration.
The removal of sulfonamides from water predominantly uses physical and chemical methods, as residual antibiotics cannot be completely removed by conventional water treatment processes. The removal of residual antibiotics from water using chemical oxidation methods is relatively quick and the residual antibiotics are thoroughly degraded, but the operating costs are high. Organic pollutants can be removed quickly, easily and effectively using physical and chemical methods, but high operating costs and secondary pollution from degradation products are problematic drawbacks. Antibiotics have long half-lives, strong migration abilities, and strong bacteriostatic characteristics, meaning that biological methods are not the best choice for antibiotic removal. Additionally, the reagents required for chemical methods carry the risk of secondary contamination of the water environment. The use of a reverse osmosis membrane to remove antibiotics from extracted groundwater was studied, and the removal rate was >90%.21 Researchers have also used a photocatalytic method to remove antibiotics.22–24 The previously described methods have drawbacks such as high costs or secondary pollution and the adsorption method has become a better choice for the removal of pollutants because of its high efficiency and low cost. Presently, various materials such as composite materials25–27 and many agricultural wastes have been chosen as sorbents for use in pollution treatment.
By-product waste material can be used as a cost effective adsorbent.28 Peanut shells are a by-product of peanut processing and they have the advantages of a wide range of sources, high production volumes, low costs, and they are environmentally friendly. Peanut shells have a high porosity and a large specific area, and there has been increasing interest in their role as biological adsorbents in recent years because of their strong adsorption capacity.29–31 At present, only a small proportion of peanut shells are recycled as feed or fuel, and most are discarded or burned, resulting in wasted resources. A number of reports discuss the use of peanut shells as adsorbent materials32 or activated carbon which was made from peanut shells for adsorbing heavy metals,33 dyes,34 and other pollutants. Currently, only a few studies have assessed using peanut shells directly as adsorbents for removal of trace concentrations of antibiotics from water, and the influence factors on adsorption have not really been investigated. China has the largest peanut production in the world and millions of tons of peanut shells are produced per year.35 Using peanut shells as an adsorbent for removal of antibiotics could help to resolve antibiotic pollution and mitigate the problems caused by accumulation of agricultural waste materials.
The aim of the research described in this paper was to examine the effectiveness of peanut shells in removing the following antibiotics: sulfathiazole (ST), sulfamerazine (SM), sulfamethazine (SM2), and sulfamethoxazole (SMX). The properties of peanut shells were characterized using the Brunauer–Emmett–Teller (BET) model, X-ray photoelectron spectroscopy (XPS), scanning electron microscopy (SEM), and Fourier-transform infrared (FTIR) spectroscopy before and after experimentation. Various parameters such as dosage, initial antibiotic concentration and water factors [iron (Fe3+), manganese (Mn2+) and calcium (Ca2+) representing water hardness] were studied and adsorption kinetics and isotherms were also investigated.
2 Materials and methods
2.1 Materials
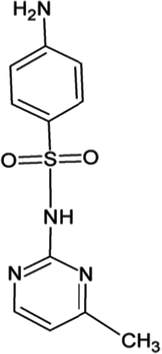
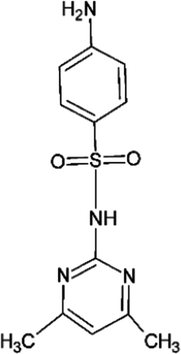
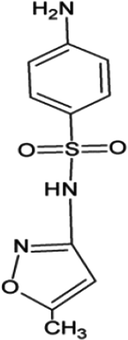
Four antibiotics (ST, SM, SM2, and SMX) were purchased from Sigma (St. Louis, MO, USA) and their properties and characteristics are shown in Table 1. All of the reagents used in this study [e.g., iron(III) chloride (FeCl3) and manganese(II) sulfate (MnSO4)] were analytical grade. Solutions of the four antibiotics were created by diluting the antibiotic stock solutions (1 g L−1) with deionized water. The aqueous solutions for the experiments were also prepared using deionized water.| Antibiotic | Sulfathiazole (ST) | Sulfamerazine (SM) | Sulfamethazine (SM2) | Sulfamethoxazole (SMX) |
| Molecular formula | C9H9O2N3S2 | C11H12N4O2S | C12H14N4O2S | C10H11N3O3S |
| Chemical structure | 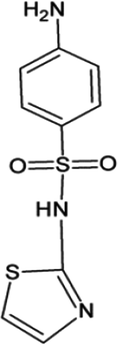 |
 |
 |
 |
| Density (g cm−3) | 1.696 | 1.439 | 1.391 | 1.08 |
| pKa,1 | 2 | 2.06 | 2.3 | 1.8 |
| pKa,2 | 7.11 | 6.09 | 7.49 | 5.6 |
| Molar volume (Mv; cm3 mol−1) | 163.5 | 183.5 | 199.8 | 173.1 |
| Solubility (g L−1) | 1.558 | 0.15 | 0.485 | 1.725 |
Raw peanut shells were obtained from a local farm in Jilin Province, China. The composition of the peanut shells is shown in Table 2. The peanut shells were washed with distilled water and heated in an oven at 40 °C for 5 h. Before the experiment, the peanut shells were crushed using a stainless steel blender to reduce their size to 0.5–0.6 mm.
| Composition | Crude protein | Crude fat | Crude fiber | Hemicellulose | Carbohydrates | Crude ash | Calcium | Phosphorus |
|---|---|---|---|---|---|---|---|---|
| Mass content (%) | 4.8–7.2 | 1–1.1 | 65.7–79.3 | 10.1 | 10.6–21.2 | 1.9–4.6 | 0.24–0.27 | 0.08–0.09 |
2.2 Batch adsorption tests
To select the most appropriate quantity of peanut shells for effective adsorption of antibiotics from solution, an experiment was conducted to determine the effect of the adsorbent dosage on antibiotic removal. The experiment was performed using 0.1, 0.5, 1.0, and 2.0 g of adsorbent in 50 mL test solutions at a constant initial antibiotic concentration (0.5 mg L−1) and temperature (10 °C) for a sufficient contact time (24 h). The conical flasks (100 mL, glass) were sealed and shaken at 100 rpm using a control shaker, and then the antibiotic concentration was determined using high-performance liquid chromatography (HPLC). The solution samples were filtered through cellulose membranes (0.22 μm) before analysis.The effect of water factors on antibiotic adsorption were also studied by adding 1.0 g of peanut shells to antibiotic solutions (5 mg L−1) containing different concentrations of ions ([Fe3+] = 1, 3, 5, 10, and 20 mg L−1; [Mn2+] = 1, 3, 5, 10, and 15 mg L−1; [Ca2+] = 50, 150, 300, 400, and 650 mg L−1). The conical flasks were sealed and shaken at 100 rpm for a certain period (24 h) and the antibiotic concentrations were then determined.
To study the equilibration time and adsorption isotherms, a series of antibiotic solution were used (50 μg L−1, 100 μg L−1, 0.2 mg L−1, 0.8 mg L−1, 1 mg L−1, and 5 mg L−1), and experiments were conducted by adding 1.0 g of peanut shells to the test solution at 10 °C. The conical flasks were sealed and shaken at 100 rpm for different time intervals (0.5, 1, 1.5, 2, 4, 8, 12, 20, and 24 h). From the results, a time interval of 24 h was sufficient to achieve equilibrium for the adsorption of the four antibiotics. The antibiotic concentrations in the solutions were then determined. The effect of different initial concentrations on antibiotic adsorption was studied simultaneously during the experiment described previously. Batch desorption experiments were also conducted in constant adsorption conditions (adsorbent dose = 1.0 g, C0 = 0.5 mg L−1, T = 10 °C, equilibration time = 24 h and the contents of the flasks were shaken at 100 rpm). The peanut shell particles were separated from the supernatant using filtration membranes at the end of the adsorption stage, and then the adsorbent particles were placed in conical flasks with deionized water, and 10% hydrochloric acid and methanol were used as eluents and the desorption step lasted for 24 h. The elution effectiveness was evaluated using desorption percentages. All the experiments were performed in duplicate and the average values were taken as the response.
2.3 Analytical methods
The concentrations of antibiotics were determined using HPLC with a 1260 Infinity series device (Agilent). Analyses were conducted using an Eclipse XDB-C18 column (4.6 mm × 150 mm, 5 μm), a column temperature of 30 °C, and an ultraviolet light detector wavelength of 270 nm. The mobile phase consisted of methanol and 0.1% formic acid at a ratio of 30![[thin space (1/6-em)]](https://www.rsc.org/images/entities/char_2009.gif) :70. The injection volume was 20 μL and the flow rate was 1 mL min−1. Solution samples were filtered through cellulose membranes (0.22 μm) before analysis.
:70. The injection volume was 20 μL and the flow rate was 1 mL min−1. Solution samples were filtered through cellulose membranes (0.22 μm) before analysis.
2.4 Characterization of adsorbents
The porous structure of the peanut shells before and after antibiotic adsorption was determined using a JW-BK132F BET surface area and pore size analyzer (JWGB Science and Technology) to generate nitrogen (N2) adsorption–desorption isotherms at –196 °C. The samples were out-gassed at 50 °C under a vacuum for 6 h before analysis. The pore size distribution and surface area were evaluated using to the BET model37 and the pore diameter distribution was calculated using the Barrett–Joyner–Halenda (BJH) method38 to analyze the N2 desorption data. The micropore volume (VDR) and the micropore surface area of the samples were evaluated using Dubinin–Radushkevich equations.39 XPS analysis was conducted before and after adsorption using an ESCALAB™ 250Xi photoelectron spectrometer (Thermo Scientific).The surface morphology of the peanut shells was determined before and after adsorption using SEM. The functional groups of the peanut shells were detected before and after adsorption using FTIR spectroscopy with an FTIR-2000 instrument (PerkinElmer, Waltham, MA, USA), and the FTIR spectra of the peanut shell samples were recorded between 4000 cm−1 and 400 cm−1.
2.5 Data processing
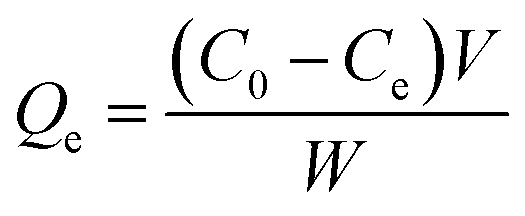
The equilibrium quantity of antibiotics adsorbed per gram of adsorbent (μg g−1) was calculated using the following equation:where Qe (μg g−1) is the amount of antibiotics adsorbed by the peanut shells at equilibrium, C0 (mg L−1) is the initial antibiotic concentration in the solution, Ce (mg L−1) is the antibiotic concentration in the solution at equilibrium, W (g) is the mass of the peanut shells, and V (mL) is the volume of the antibiotic solution.
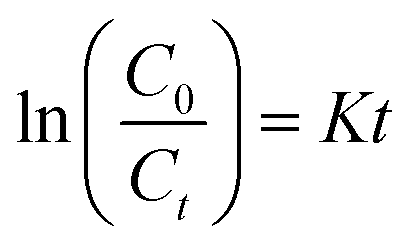
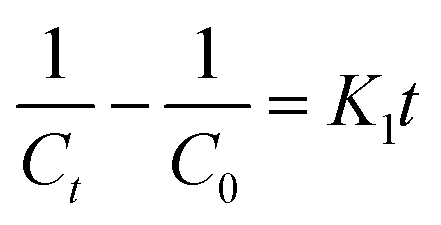
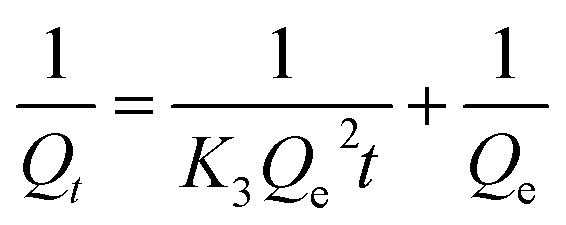
To examine the controlling mechanism of the adsorption process, four kinetic models were used to understand the behavior of the adsorption process. First-order kinetic, second-order kinetic, pseudo-first order kinetic, and pseudo-second order kinetic equations were used to fit the experimental kinetic data.
(1) First-order kinetic model:
(2) Second-order kinetic model:
(3) Pseudo-first order model:

(4) Pseudo-second order model:
In this study, the equilibrium experimental data for antibiotics adsorbed by the peanut shells were analyzed using the Langmuir, Freundlich, and Henry models.
(5) Langmuir isotherm model:
(6) Freundlich isotherm model:
| logQe = logkF + nlogCe |
(7) Henry isotherm model:
| Qe = Kd Ce |
3 Results and discussion
3.1 Material characterization
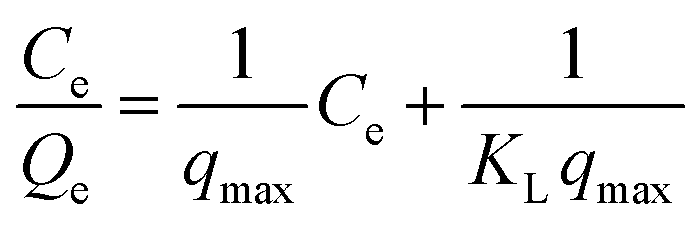
On the basis of the N2 adsorption–desorption isotherms, the average pore size of peanut shells before adsorption was found to be 8.48 nm, and the BET surface area and pore volume were 2.005 m2 g−1, and 0.011 cm3 g−1, respectively. The specific surface area (SBET), micropore surface area (SDR), micropore volume (VDR) and mesopore volume (VBJH) of the samples are shown in Table 3. The micropore volume was much smaller than the mesopore volume in each sample. Both micropore volume and mesopore volume of the peanut shells after adsorption were larger than before adsorption, which may have been because of impregnation by the solution. The porous nature of the peanut shells was determined using the N2 adsorption–desorption isotherms, as shown in Fig. 1(a). These can be classified as type-IV isotherms, which are characteristic of mesoporous material.40 The pore size distribution was determined from desorption data using the BJH model. The average value was 3.985 nm, as shown in Fig. 1(b). The adsorbent active sites with a high surface density were provided by a high surface area. The active adsorptive sites exposed to antibiotic molecules and the mesoporous structure can provide the possible conditions for the transport of antibiotic molecules, which can lead to its high adsorption capacity.| Sample | SBET (m2 g−1) | DDR (nm) | SDR (m2 g−1) | VDR (cm3 g−1) | DBJH (nm) | SBJH (m2 g−1) | VBJH (cm3 g−1) |
|---|---|---|---|---|---|---|---|
| Raw peanut shells | 2.005 | 18.725 | 2.58 | 0.00071 | 8.483 | 4.658 | 0.011 |
| After adsorption (ST) | 3.811 | 16.793 | 4.54 | 0.00122 | 6.295 | 12.901 | 0.020 |
| After adsorption (SM) | 2.795 | 15.123 | 7.34 | 0.00081 | 6.582 | 8.019 | 0.013 |
| After adsorption (SM2) | 3.102 | 13.314 | 6.05 | 0.00085 | 6.090 | 8.820 | 0.013 |
| After adsorption (SMX) | 3.047 | 17.626 | 7.82 | 0.00082 | 6.408 | 10.585 | 0.017 |
 | ||
| Fig. 1 (a) N2 adsorption–desorption isotherms of peanut shells and (b) distribution curve of peanut shells' pore size. | ||
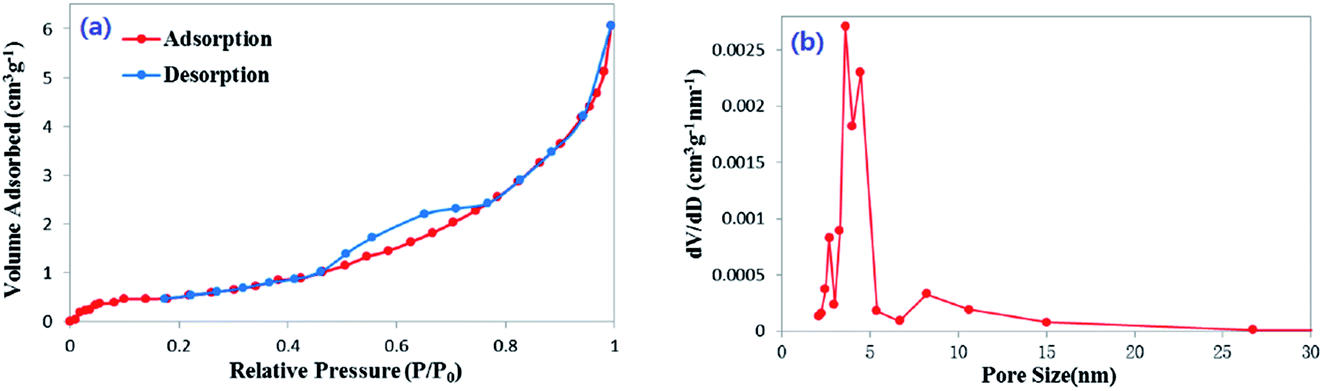
The XPS spectrum and high-resolution spectrum of the peanut shell samples are shown in Fig. 2. The spectrum of the peanut shell samples shows three peaks, because of C1s, N1s, and O1s [Fig. 2(a)]. The high-resolution spectra of C1s, N1s, and O1s are shown in Fig. 2(b)–(g). As shown in Fig. 2(b) and (c), in the high-resolution XPS spectra of C1s, there were three peaks at 284.66, 286.18, and 287.62 eV, which can be assigned to C–C/C![[double bond, length as m-dash]](https://www.rsc.org/images/entities/char_e001.gif) C, C–N/CN, and the C–O group,26,41 respectively. The N1s spectra are shown in Fig. 2(d) and (e) and these spectra have two peaks at 399.8 and 401.1 eV, corresponding to the N–C and NH–CO,25,42 respectively. The high-resolution XPS spectra for O1s are shown in Fig. 2(f) and (g), two peaks could be fitted, indicating that two types of O were present, which were attributed to the –OH and C–O, respectively. From the C1 score level spectra, the proportion of C–N/CN and C–O groups in the peanut shells before adsorption was larger than after adsorption. The N1s spectra showed no remarkable change in the two high-resolution XPS spectra [Fig. 2(d) and (e)]. However, Fig. 2(f) and (g) have a peak at 532.65 eV corresponding to C–O and the area of the peak in the XPS spectrum decreased, indicating that the –OH was involved in the adsorption reaction from another angle. Therefore, the C–N/CN, C–O and –OH participated in the antibiotics' adsorption.
C, C–N/CN, and the C–O group,26,41 respectively. The N1s spectra are shown in Fig. 2(d) and (e) and these spectra have two peaks at 399.8 and 401.1 eV, corresponding to the N–C and NH–CO,25,42 respectively. The high-resolution XPS spectra for O1s are shown in Fig. 2(f) and (g), two peaks could be fitted, indicating that two types of O were present, which were attributed to the –OH and C–O, respectively. From the C1 score level spectra, the proportion of C–N/CN and C–O groups in the peanut shells before adsorption was larger than after adsorption. The N1s spectra showed no remarkable change in the two high-resolution XPS spectra [Fig. 2(d) and (e)]. However, Fig. 2(f) and (g) have a peak at 532.65 eV corresponding to C–O and the area of the peak in the XPS spectrum decreased, indicating that the –OH was involved in the adsorption reaction from another angle. Therefore, the C–N/CN, C–O and –OH participated in the antibiotics' adsorption.
 | ||
| Fig. 2 (a) XPS wide scan; (b), (d), and (f) high-resolution XPS spectra for C1s, N1s, and O1s of raw peanut shells, respectively; (c), (e), and (g) C1s, N1s, and O1s of peanut shells after adsorption, respectively. | ||
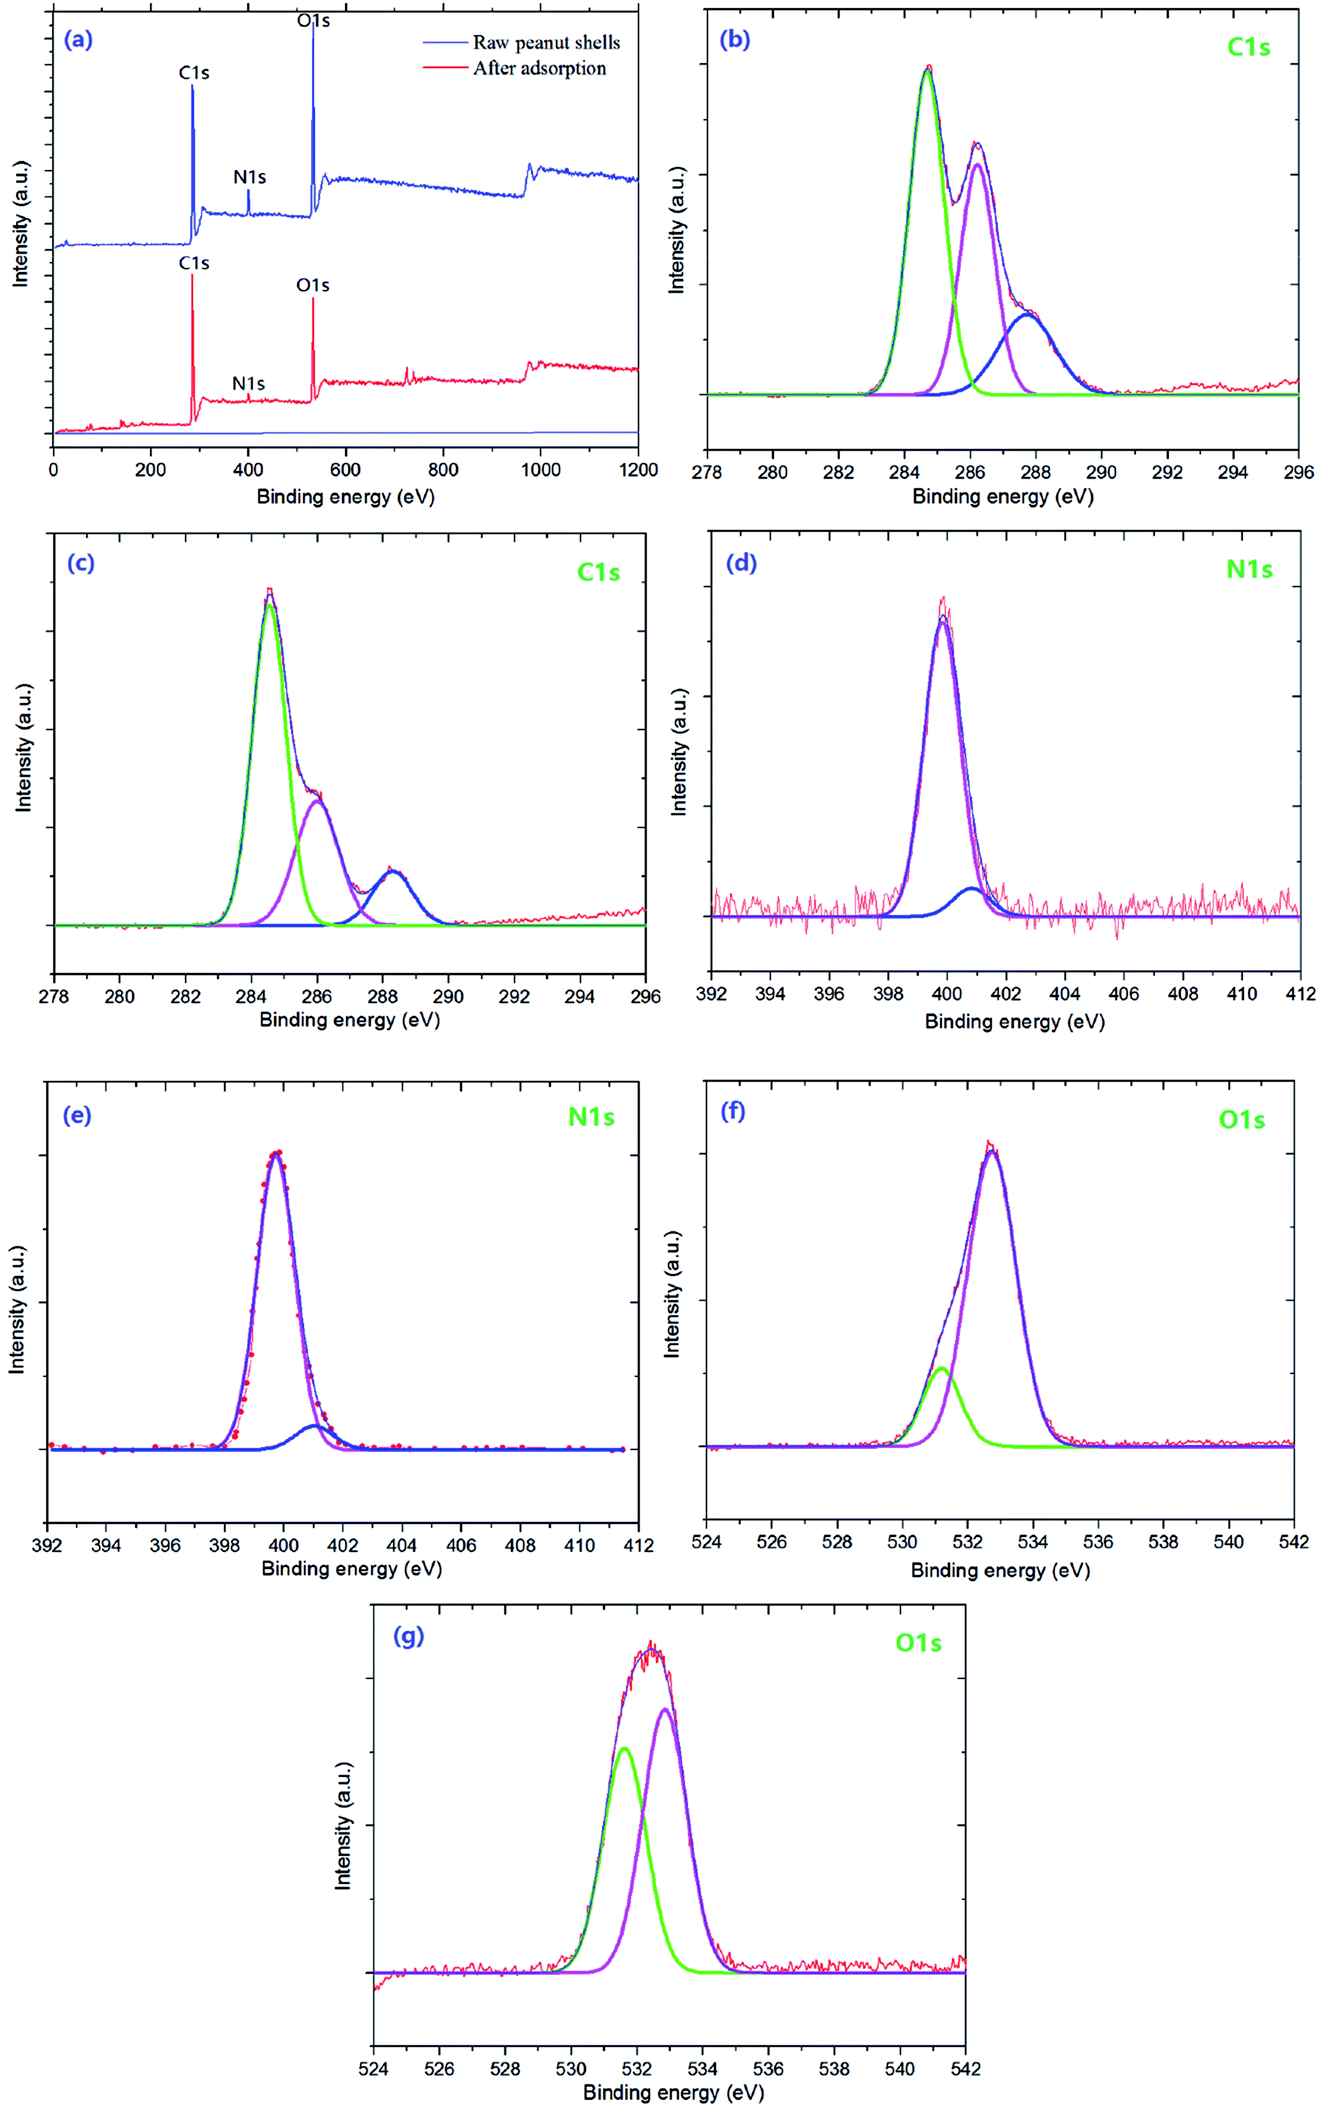
The surface morphology of peanut shells after adsorption was different from the raw peanut shells, as shown in the SEM images in Fig. 3. The surface of the peanut shells before adsorption (Fig. 3(a)) was more rugged than the surface after adsorption (Fig. 3(b)). The raw peanut shell had clear edges and a rough surface before antibiotic adsorption, whereas the surface became smooth after adsorption, populated by surface micro-pores and showing a lack of clear edges. These characteristic changes may have been because of the adsorption of macromolecular antibiotics onto the surface of the peanut shells.
 | ||
| Fig. 3 SEM micrograph images before (a) and after (b) antibiotic adsorption. | ||
The FTIR spectra of raw peanut shells were recorded before and after antibiotic adsorption between ∼4500 and 0 cm−1, as shown in Fig. 4. The first bands (4000–2500 cm−1) observed for the peanut shells can be attributed to the stretching vibrations of O–H,43 N–H,44 and C–H45 bonds in the peanut shells. The bands at 3600–3300 cm−1 were attributed to vibrations of the N–H bonds,46 which were larger after antibiotic adsorption, indicating that N–H bonds took part in the adsorption of antibiotics. The bands at 3000–2800 cm−1 corresponded to C–H vibrations.25,26 The bands at 2875 cm−1 and 2850 cm−1 represented the vibration of CH3 and CH2,47,48 respectively, and after adsorption, the CH3 bands increased slightly and the CH2 bands shrank slightly. The second set of bands at 2500–2000 cm−1 were attributed to stretching vibrations of C![[triple bond, length as m-dash]](https://www.rsc.org/images/entities/char_e002.gif) C and CN, and asymmetric stretching vibrations of CCC and CCO. Additionally, stretching vibrations of S–H, Si–H, P–H, and B–H were also observed and the bands at 2400–2300 cm−1 showed no obvious changes, indicating that S–H, Si–H, P–H, and B–H had no effect on antibiotic adsorption. The third set of bands at 2000–1500 cm−1 were attributed to the stretching vibrations of double bonds. The 1700–1600 cm−1 bands and the 1550–1500 cm−1 bands were assigned to CO,27,28 and to CN, CC, and NO, respectively.49,50 The bands at 1700–1600 cm−1 increased slightly after antibiotic adsorption. The band at 1500 cm−1 was attributed to CC, but showed little change after adsorption, indicating that CC was not a major participant during adsorption. The fourth set of bands at 1500–1300 cm−1 was attributed to stretching vibrations from saturated C–H deformation51 and these bands showed no obvious changes after adsorption. The bands at 1050–1000 cm−1 corresponded to C–O single bond vibrations,52,53 and these bands slightly increased after adsorption. In conclusion, N–H, CH3, CH2, CO, and C–H bonds contributed to the adsorption of antibiotics by peanut shells.
C and CN, and asymmetric stretching vibrations of CCC and CCO. Additionally, stretching vibrations of S–H, Si–H, P–H, and B–H were also observed and the bands at 2400–2300 cm−1 showed no obvious changes, indicating that S–H, Si–H, P–H, and B–H had no effect on antibiotic adsorption. The third set of bands at 2000–1500 cm−1 were attributed to the stretching vibrations of double bonds. The 1700–1600 cm−1 bands and the 1550–1500 cm−1 bands were assigned to CO,27,28 and to CN, CC, and NO, respectively.49,50 The bands at 1700–1600 cm−1 increased slightly after antibiotic adsorption. The band at 1500 cm−1 was attributed to CC, but showed little change after adsorption, indicating that CC was not a major participant during adsorption. The fourth set of bands at 1500–1300 cm−1 was attributed to stretching vibrations from saturated C–H deformation51 and these bands showed no obvious changes after adsorption. The bands at 1050–1000 cm−1 corresponded to C–O single bond vibrations,52,53 and these bands slightly increased after adsorption. In conclusion, N–H, CH3, CH2, CO, and C–H bonds contributed to the adsorption of antibiotics by peanut shells.
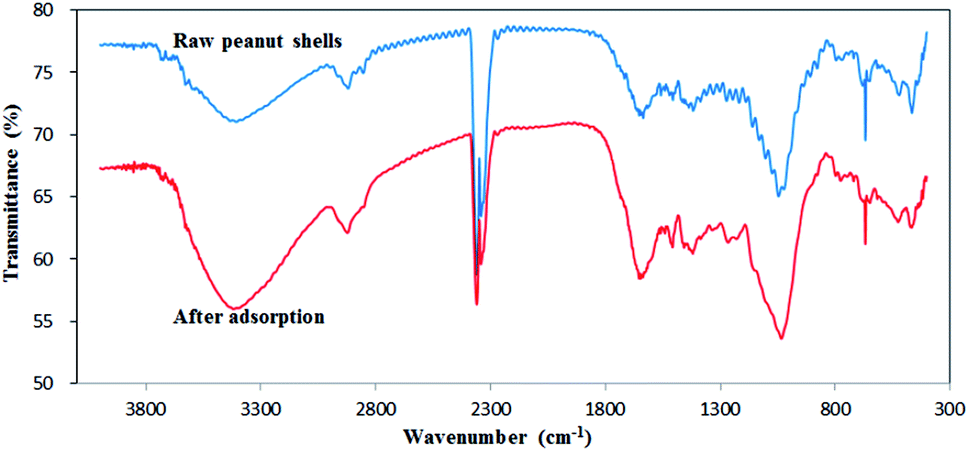 | ||
| Fig. 4 FTIR spectra of the peanut shells before and after antibiotic adsorption. | ||
3.2 Adsorbent dosage effects
The adsorption effects of different dosages are shown in Fig. 5, which illustrates that the adsorption increased as the amount of peanut shells increased. The dosage of peanut shells had little effect on antibiotic adsorption when it was <1.0 g. In theory, the maximal adsorption rate for the four antibiotics should have occurred when 2.0 g of peanut shells were used because of the greater surface area and larger number of active surface sites available for adsorption. However, it was found that when 2.0 g of peanut shells was used, the calculation error when analyzing the experimental data was large because of the weak antibiotic peak during instrument testing. The error may have been because of the large quantity of peanut shells dissolved into solution, with the composition of the peanut shells affecting the concentration tests. To avoid these large errors, the dosage of the peanut shells was set to 1.0 g in the follow-up experiment. The adsorption rates for the four antibiotics were 72.8% (ST), 47.0% (SM), 45.1% (SM2), and 32.8% (SMX) when the peanut shell content was 1.0 g.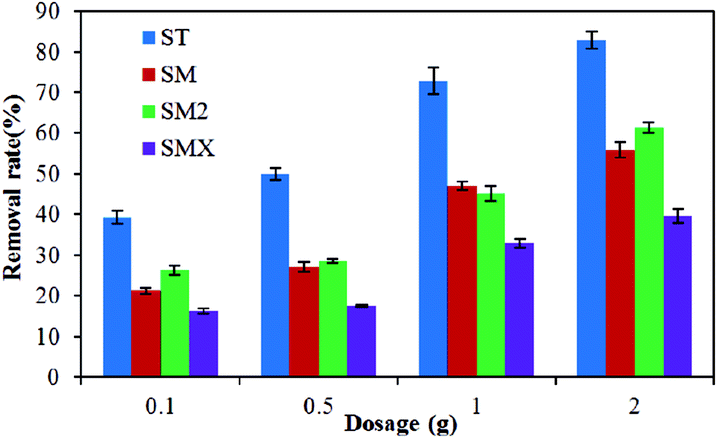 | ||
| Fig. 5 Effect of peanut shell dosage on antibiotic removal. | ||
3.3 Concentration effects
The effects of the initial antibiotic concentration on peanut shell antibiotic adsorption are shown in Fig. 6. The antibiotic adsorption rates reduced with increases in the initial concentration. The removal rates of the four antibiotics were 86.1% (ST), 65.5% (SM), 47.0% (SM2), and 38.4% (SMX) when the initial antibiotic concentration was 0.05 mg L−1, whereas the removal rates of the four antibiotics were 74.9% (ST), 37.4% (SM), 33.1% (SM2), and 9.0% (SMX) when the initial antibiotic concentration was 5 mg L−1. The removal rate decreased by ∼11.2–29.4% when compared to the removal rates when the initial concentration was 0.05 mg L−1. The test results showed that the initial concentration effects of the four antibiotics decreased as follows: SMX > SM > SM2 > ST. Because of the low removal rates when the concentration was >5 mg L−1 in the antibiotic solution, it will be necessary to increase the adsorbent dose to achieve high adsorption rates if the concentration of antibiotics in contaminated water is high.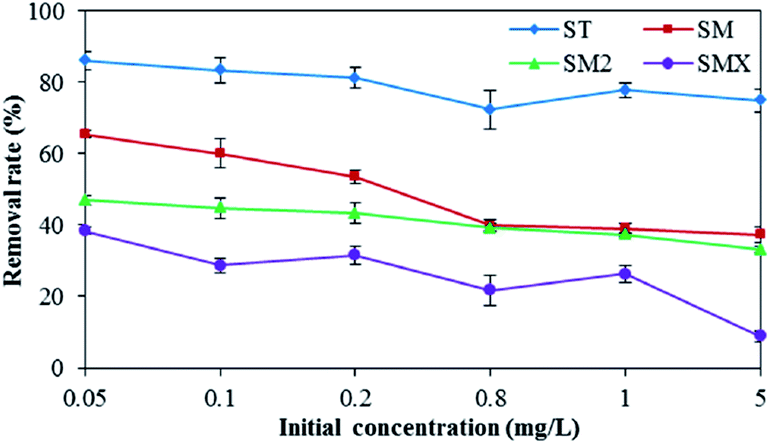 | ||
| Fig. 6 Effect of initial antibiotic concentration on antibiotic removal. | ||
3.4 Water factor effects
As shown in Fig. 7, increased Fe3+ had a positive effect on the adsorption of the four antibiotics by the peanut shells. The removal rates for the four antibiotics were 85.0% (ST), 64.8% (SM), 59.2% (SM2), and 73.5% (SMX) when the concentration of Fe3+ was 20 mg L−1, whereas the removal rates were 73.7% (ST), 38.3% (SM), 36.9% (SM2), and 21.6% (SMX) when the concentration of Fe3+ was 1 mg L−1. Because antibiotics are a type of amphoteric compound, they exist in the form of anions in alkaline solutions, and in the form of cations in acidic solution. The pH of the antibiotic solutions were 7–8, so most antibiotics existed as anions. Bridge bonds between the antibiotics and peanut shells were therefore generated by Fe3+, improving the adsorption effects. | ||
| Fig. 7 Effect of Fe3+ on antibiotic removal. | ||
Mn2+ has a similar effect to Fe3+ in terms of antibiotic adsorption. According to the results in Fig. 8, both Fe3+ and Mn2+ had a clear positive effect on the antibiotic adsorbance by peanut shells. Therefore, during the remediation of contaminated groundwater sites using peanut shells, removing the sulfonamide antibiotics before Mn2+ and Fe3+ removal can improve the remediation of contaminated water. Removing the contaminants in this order could also benefit Fe3+ and Mn2+ removal, as some Fe3+ and Mn2+ would be consumed during the adsorption of the antibiotics.
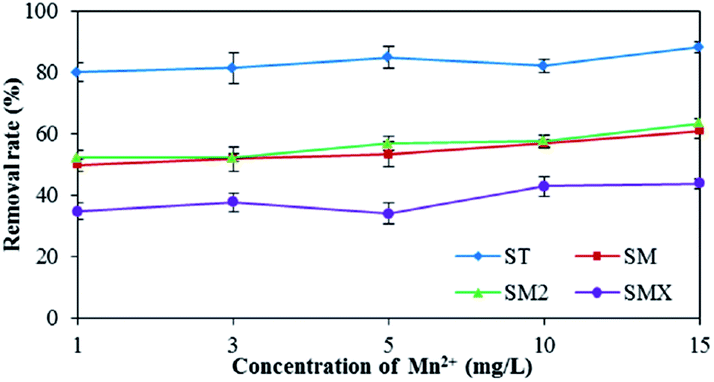 | ||
| Fig. 8 Effect of Mn2+ on antibiotic removal. | ||
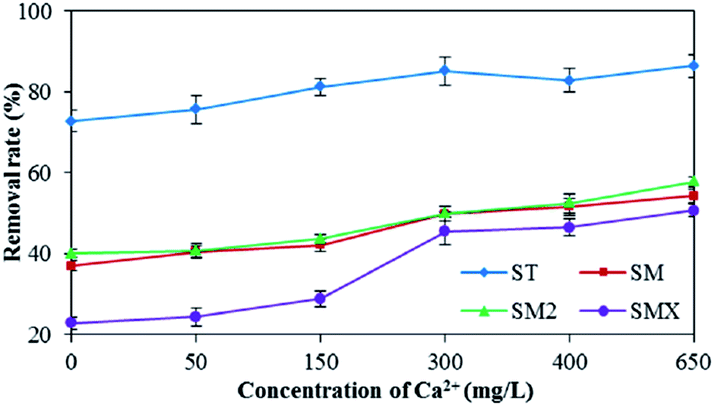
In this experiment, the effect of Ca2+ on the adsorption of antibiotics by peanut shells was investigated, and the results are shown in Fig. 9. The results showed that hardness had a positive effect on the adsorption of sulfonamide antibiotics by peanut shells and the removal rate of ST was more than 80% when the concentration of Ca2+ exceeded 150 mg L−1. SMX adsorption rates reached a maximum when the Ca2+ concentration was 650 mg L−1, giving a growth rate of 27.9% and a removal rate of 50.7%. The most likely reason for this is that the pH increased with increasing hardness, causing the antibiotics to form anions and increasing the number of bridge bonds generated by Ca2+, thus improving the adsorption effect.
 | ||
| Fig. 9 Effect of hardness on antibiotic removal. | ||
3.5 Adsorption kinetics
Table 4 lists the results of the study of antibiotic adsorption by peanut shells using different kinetic models. The equilibrated adsorption capacities of the four antibiotics were calculated as 18.2 μg g−1 (ST), 11.7 μg g−1 (SM), 11.3 μg g−1 (SM2), and 8.2 μg g−1 (SMX)| Antibiotics | First-order | Second-order | Pseudo-first order | Pseudo-second order | ||||||
|---|---|---|---|---|---|---|---|---|---|---|
| K (h−1) | R2 | K1 (L mg−1 h) | R2 | Qe (μg g−1) | K2 (h−1) | R2 | Qe (μg g−1) | K3 (g μg−1 h) | R2 | |
| Sulfathiazole (ST) | 0.022 | 0.6568 | 0.0985 | 0.8146 | 18.2 | 0.1502 | 0.8849 | 18.2 | 0.0489 | 0.9771 |
| Sulfamerazine (SM) | 0.0087 | 0.5273 | 0.0266 | 0.6215 | 11.7 | 0.1735 | 0.8906 | 11.7 | 0.2195 | 0.9173 |
| Sulfamethazine (SM2) | 0.0079 | 0.3598 | 0.0237 | 0.4041 | 11.3 | 0.1929 | 0.9101 | 11.3 | 0.1879 | 0.9883 |
| Sulfamethoxazole (SMX) | 0.0033 | 0.2463 | 0.0086 | 0.2828 | 8.2 | 0.1353 | 0.6844 | 8.2 | 0.6328 | 0.9003 |
From the fitting results, the pseudo-second order kinetic model was a better fit for the experimental results than the other three models. The pseudo-second order kinetic model fit is shown in Fig. 10. The adsorption rates of the four sulfonamides decreased as follows: SMX > SM > SM2 > ST. The correlation coefficients (R2) were >0.9, so the pseudo-second order kinetic model was the most suitable fit to the experimental data. This result indicates that the rate controlling step involved chemical adsorption of the antibiotics by the peanut shells. It also means that the adsorption of antibiotics by peanut shells was reaction controlled rather than mass transfer controlled.54
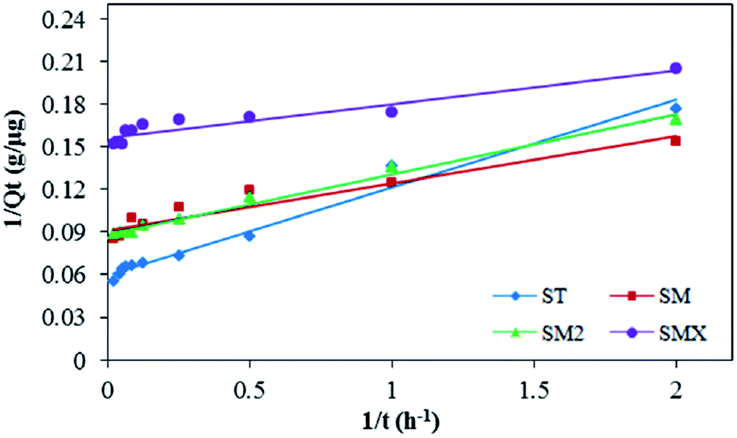 | ||
| Fig. 10 Linear plot of the pseudo-second order kinetic model. | ||
3.6 Adsorption isotherms
The adsorption data were fitted using the three thermodynamic equations (Langmuir, Freundlich, and Henry models), and the parameters are shown in Table 5. The results show that the adsorption of the four sulfonamides by peanut shells proceeded according to the Henry linear adsorption model, indicating that the adsorption of antibiotics by peanut shells is a partitioning sorption process. The fitting results are shown in Fig. 11. Among the four antibiotics, the adsorption capacity of ST by peanut shells was the largest, and the adsorption capacity of SMX was the smallest. The adsorption capacity of the four antibiotics by peanut shells decreased as follows: ST > SM > SM2 > SMX.| Antibiotics | Langmuir model | Freundlich model | Henry model | |||||
|---|---|---|---|---|---|---|---|---|
| K | qm | R2 | KF | n | R2 | Kd (mL g−1) | R2 | |
| ST | 0.21 | 833.33 | 0.0887 | 122.10 | 0.85 | 0.9786 | 148.50 | 0.9977 |
| SM | 0.30 | 178.57 | 0.4595 | 32.44 | 0.75 | 0.9916 | 29.10 | 0.9992 |
| SM2 | 0.19 | 204.08 | 0.7707 | 29.66 | 0.87 | 0.9972 | 24.10 | 0.997 |
| SMX | 1.02 | 27.17 | 0.9795 | 11.80 | 0.67 | 0.9317 | 4.20 | 0.8063 |
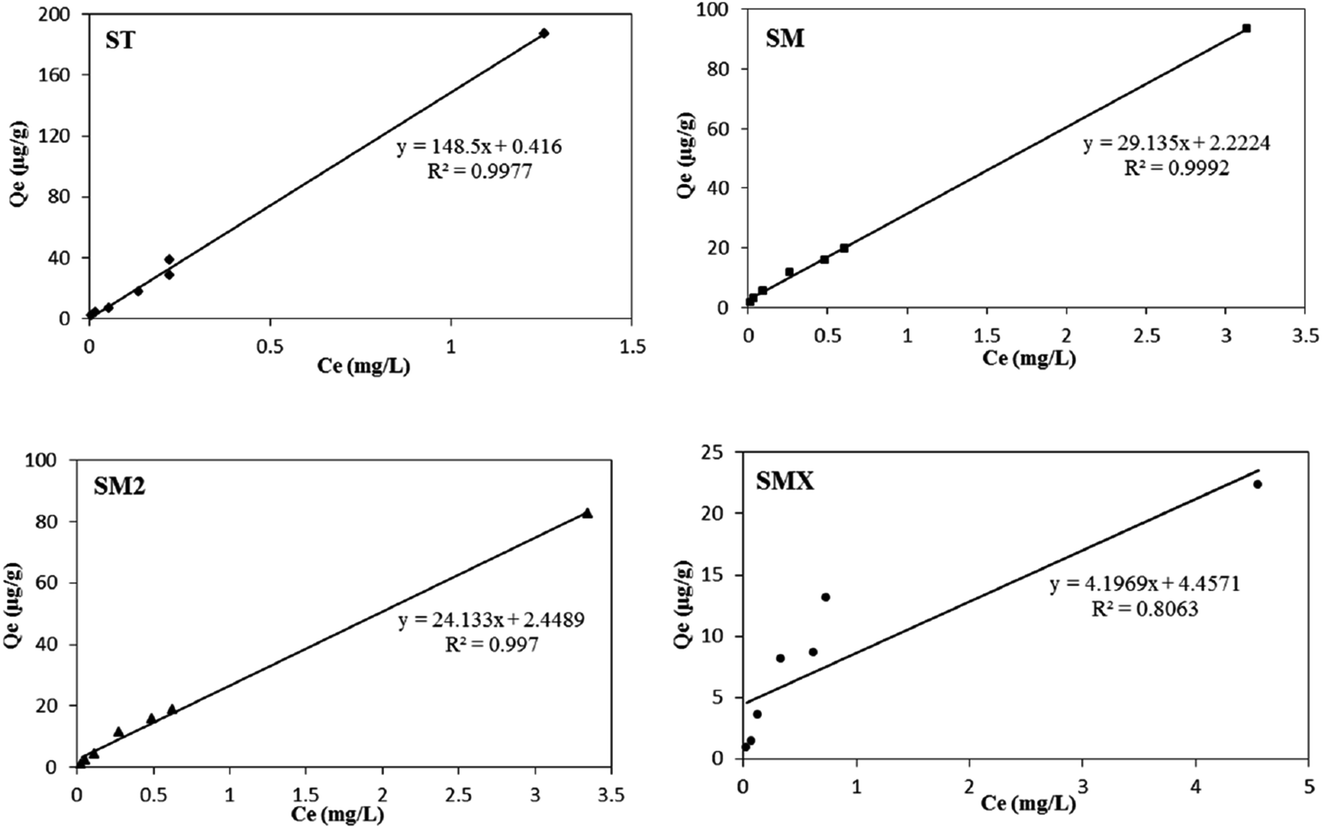 | ||
| Fig. 11 Henry isotherm plots for the adsorption of antibiotics by peanut shells. | ||
3.7 Desorption
Considering the practical application of peanut shells for purifying contaminated water and reuse of the adsorbent, desorption experiments were conducted using deionized water, 10% hydrochloric acid, and methanol (an environmental friendly solvent). Fig. 12 illustrates the desorption of antibiotics using different eluents. It was found that there was a higher desorption efficiency using methanol than using the two other eluents, and the antibiotics' desorption efficiency was greater than 70%. Because antibiotics and methanol are organic compounds, they dissolve easily into each other. According to the similarity-intermiscibility theory, the antibiotics can dissolve in organic solvents more easily. The high desorption indicates that the adsorbent could be easily regenerated, and the material could be reused for contaminated water treatment.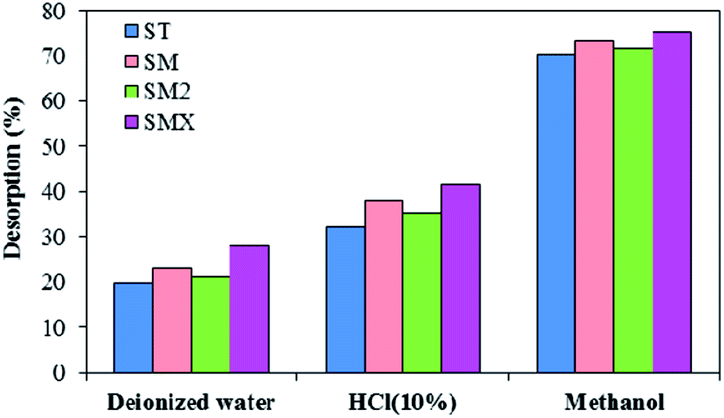 | ||
| Fig. 12 Desorption of antibiotics by different eluents. | ||
The cost of peanut shells in the experiment was 60 RMB per m3 and this is much cheaper than other adsorbents, such as activated carbon. Based on the results, it was concluded that peanut shells are a promising material for the removal of antibiotics, at low initial concentrations, from contaminated water because of their advantages of a wide range of sources, good adsorption, and low cost. However, in order to expand their use in remediation of combined contaminated water, further exploration into the removal of other pollutants is needed.
4 Conclusions
In this study, adsorption experiments were conducted for four antibiotics using peanut shells as adsorbents under various experimental conditions. It was found that the removal efficiency was affected by the adsorbent dosage, the initial antibiotic concentration, and water factors [Fe2+, Mn2+, and Ca2+ (hardness)]. Kinetic data showed that the pseudo-second order kinetic model provided the most suitable fit to the experimental data, and the rate-limiting factor for adsorption was predominantly the adsorption mechanism. The adsorption isotherm experimental data were well fitted to the Henry linear adsorption model, which indicates that the adsorption of antibiotics by peanut shells was a partitioning sorption process. The porous structure and surface morphology of the peanut shells were characterized using characterization techniques, and the results showed that peanut shells could provide the conditions for antibiotics' adsorption. During the process of adsorption, C–N/CN, C–O, and –OH participated in the antibiotics' adsorption, and the N–H, CH3, CH2, CO, and C–H bonds contributed to the adsorption of antibiotics by peanut shells. The desorption experiment results showed that peanut shells have good reutilization characteristics if methanol is used as eluent. In conclusion, peanut shells are an efficient, environmentally friendly, and cost-effective material for the removal of antibiotics from contaminated water.
Conflicts of interest
There are no conflicts of interest to declare.Acknowledgements
The authors acknowledge the financial support of the Major Science and Technology Program for Water Pollution Control and Treatment (2014ZX07201010).References
- J. Chen, X. D. Wei, Y. S. Liu, G. G. Ying, S. S. Liu, L. Y. He, H. C. Su, L. X. Hu, F. R. Chen and Y. Q. Yang, Sci. Total Environ., 2016, 565, 240–248 CrossRef CAS PubMed.
- N. Le-Minh, S. J. Khan, J. E. Drewes and R. M. Stuetz, Water Res., 2010, 44, 4295–4323 CrossRef CAS PubMed.
- M. H. Valsero, G. Fink, M. P. Schlüsener, R. S. Cardona, J. M. Villacorta, T. Ternes and E. Becares, Chemosphere, 2011, 83, 713–719 CrossRef PubMed.
- F. Liu, G. G. Ying, R. Tao, J. L. Zhao, J. F. Yang and L. F. Zhao, Environ. Pollut., 2009, 157, 1636–1642 CrossRef CAS PubMed.
- J. C. Underwood, R. W. Harvey, D. W. Metge, D. A. Repert, L. K. Baumgartner, R. L. Smith, T. M. Ronane and L. B. Barber, Environ. Sci. Technol., 2011, 45, 3096–3101 CrossRef CAS PubMed.
- W. Cheng, H. Chen, C. Su and S. Yan, Environ. Int., 2013, 61, 1–7 CrossRef CAS PubMed.
- B. L. Coleman, M. Louie, M. I. Salvadori, S. A. Mcewen, N. Neumann, K. Sibley, R. J. Irwin, F. B. Jamieson, D. Daignault, A. Majury, S. Braithwaite, B. Crago and A. J. McGeer, Water Res., 2013, 47, 3026–3036 CrossRef CAS PubMed.
- F. H. Wang, M. Qiao, Z. Chen, J. Q. Su and Y. G. Zhu, J. Hazard. Mater., 2015, 299, 215–221 CrossRef CAS PubMed.
- S. K. Frey, E. Topp, I. U. H. Khan, B. R. Ball, M. Edwards, N. Gottschall, M. Sunohara and D. R. Lapen, Sci. Total Environ., 2015, 532, 138–153 CrossRef CAS PubMed.
- Y. Shi, L. Gao, W. Li, J. Liu and Y. Cai, Bull. Environ. Contam. Toxicol., 2012, 89, 857–861 CrossRef CAS PubMed.
- W. Li, Y. Shi, L. Gao, J. Liu and Y. Cai, Environ. Pollut., 2012, 162, 56–62 CrossRef CAS PubMed.
- Y. Luo, L. Xu, M. Rysz, Y. Wang, H. Zhang and P. J. Alvarez, Environ. Sci. Technol., 2011, 45, 1827–1833 CrossRef CAS PubMed.
- R. Andreozzi, V. Caprio, C. Ciniglia, M. D. Champdore, R. L. Giudice, R. Marotta and E. Zuccato, Environ. Sci. Technol., 2004, 38, 6832–6838 CrossRef CAS PubMed.
- D. Bendz, N. A. Paxéus, T. R. Ginn and F. J. Loge, J. Hazard. Mater., 2005, 122, 195–204 CrossRef CAS PubMed.
- D. W. Kolpin, E. T. Furlong, M. T. Meyer, E. M. Thurman, S. D. Zaugg and L. B. Barber, Environ. Sci. Technol., 2002, 36, 1201–1211 CrossRef.
- S. D. Kim, J. Cho, I. S. Kim, B. J. Vanderford and S. A. Snyder, Water Res., 2007, 41, 1013–1021 CrossRef CAS PubMed.
- A. J. Watkinson, E. J. Murby, D. W. Kolpin and S. D. Costanzo, Sci. Total Environ., 2009, 407, 2711–2733 CrossRef CAS PubMed.
- M. Cheng, L. Wu, Y. Huang, Y. Luo and P. Christie, J. Soils Sediments, 2014, 14, 1123–1135 CrossRef CAS.
- A. B. A. Boxall, P. Blackwell, R. Cavallo, P. Kay and J. Tolls, Toxicol. Lett., 2002, 131, 19–28 CrossRef CAS PubMed.
- J. Wang, A. Zhou, Y. Zhang, C. Si, Z. Chen, H. Qian and Z. Zhao, Environ. Earth Sci., 2016, 75, 1252 CrossRef.
- J. Radjenović, M. Petrović, F. Ventura and D. Barceló, Water Res., 2008, 42, 3601–3610 CrossRef PubMed.
- M. N. Abellán, J. Giménez and S. Esplugas, Catal. Today, 2009, 144, 131–136 CrossRef.
- D. Li and W. Shi, Chin. J. Catal., 2016, 37, 792–799 CrossRef CAS.
- E. Adamek, W. Baran and A. Sobczak, Process Saf. Environ. Prot., 2016, 103, 1–9 CrossRef CAS.
- A. Kumar, A. Kumar, G. Sharma, A. H. Al-Muhtaseb, M. Naushad, A. A. Ghfar and F. J. Stadler, Chem. Eng. J., 2018, 462–478 CrossRef CAS.
- M. Naushad, T. Ahamad, B. M. Al-Maswari, A. A. Alqadami and S. M. Alshehri, Chem. Eng. J., 2017, 330, 1351–1360 CrossRef CAS.
- M. Papageorgiou, S. G. Nanaki, G. Z. Kyzas, C. Koulouktsi, D. N. Bikiaris and D. A. Lambropoulou, Polymers, 2017, 9, 595 CrossRef.
- M. Naushad, M. R. Khan, Z. A. Alothman, A. H. Al-Muhtaseb, M. R. Awual and A. A. Alqadami, Clean: Soil, Air, Water, 2016, 44, 1036–1045 CrossRef CAS.
- J. X. Zhang and L. L. Ou, Water Sci. Technol., 2013, 67, 737–744 CrossRef CAS PubMed.
- F. Belaib, M. Azzedine, B. Boubeker and M. A. Hassen, Int. J. Hydrogen Energy, 2014, 39, 1511–1515 CrossRef CAS.
- P. Wang, Q. Ma, D. Hu and L. Wang, Desalin. Water Treat., 2015, 57, 1–9 Search PubMed.
- X. K. Ouyang, L. P. Yang and Z. S. Wen, Bioresources, 2014, 9, 2446–2458 CAS.
- Z. A. Al-Othman, R. Ali and M. Naushad, Chem. Eng. J., 2012, 184, 238–247 CrossRef CAS.
- B. M. Hilal, S. Neslihan, A. Bilal, B. Evrim and M. H. Alma, J. Appl. Polym. Sci., 2013, 127, 4340–4351 CrossRef.
- T. Xu and X. Q. Liu, Chin. J. Chem. Eng., 2008, 16, 401–406 CrossRef CAS.
- A. Zhou, Y. Zhang, R. Li, X. Su and L. Zhang, Desalin. Water Treat., 2016, 57, 388–397 CAS.
- S. Brunauer, P. H. Emmett and E. Teller, J. Am. Chem. Soc., 1938, 60, 309–319 CrossRef CAS.
- E. P. Barrett, L. G. Joyner and P. P. Halenda, J. Am. Chem. Soc., 1951, 73, 373–380 CrossRef CAS.
- M. M. Dubinin, Progress in Surface and Membrane, Academic Press, New York, 1975, vol. 9 Search PubMed.
- L. X. Li, D. Xu, X. Q. Li, W. C. Liu and Y. Jia, New J. Chem., 2014, 38, 5445–5452 RSC.
- G. Shen, B. Mei, H. Wu, H. Wei, X. Fang and Y. Xu, J. Phys. Chem. C, 2017, 121, 3846–3853 CAS.
- A. A. Alqadami, M. Naushad, Z. A. Alothman and A. A. Ghfar, ACS Appl. Mater. Interfaces, 2017, 9, 36026–36037 CAS.
- G. Sharma, M. Naushad, A. Kumar, S. Rana, S. Sharma, A. Bhatnagar, F. J. Stadler, A. A. Ghfar and M. R. Khan, Process Saf. Environ. Prot., 2017, 109, 301–310 CrossRef CAS.
- E. Daneshvar, A. Vazirzadeh, A. Niazi, M. Kousha, M. Naushad and A. Bhatnagar, J. Cleaner Prod., 2017, 152, 443–453 CrossRef CAS.
- A. B. Albadarin, M. Charara, B. M. A. Tarboush, M. N. M. Ahmad, T. A. Kurniawan, M. Naushad, G. M. Walker and C. Mangwandi, J. Mol. Liq., 2017, 242, 478–483 CrossRef CAS.
- G. Z. Kyzas, A. Koltsakidou, S. G. Nanaki, D. N. Bikiaris and D. A. Lambropoulou, Sci. Total Environ., 2015, 537, 411–420 CrossRef CAS PubMed.
- S. Somasundaram, K. Sekar, V. K. Gupta and S. Ganesan, J. Mol. Liq., 2013, 177, 416–425 CrossRef CAS.
- T. Calvete, E. C. Lima, N. F. Cardoso, S. L. P. Dias and E. S. Ribeiro, Clean: Soil, Air, Water, 2015, 38, 521–532 CrossRef.
- B. Smith, Infrared spectral interpretation: a systematic approach, 1998 Search PubMed.
- F. A. Pavan, I. S. Lima, E. C. Lima, C. Airoldi and Y. Gushikem, J. Hazard. Mater., 2006, 137, 527–533 CrossRef CAS PubMed.
- R. S. Periathai and K. Rajagopal, IOSR Journal of Applied Physics, 2014, 6, 9–12 CrossRef.
- J. C. P. Vaghetti, E. C. Lima, B. Royer, N. F. Cardoso, B. Martins and T. Carvete, Sep. Sci. Technol., 2009, 44, 615–644 CrossRef CAS.
- N. F. Cardoso, R. B. Pinto, E. C. Lima, T. Calvete, C. V. Amavisca, B. Royer, M. L. Cunha, T. H. M. Fernandes and I. S. Pinto, Desalination, 2011, 269, 92–103 CrossRef CAS.
- Q. Hu, Z. Xiao, X. Xiong, G. Zhou and X. Guan, J. Environ. Sci., 2015, 27, 207–216 CrossRef PubMed.
| This journal is © The Royal Society of Chemistry 2018 |