DOI:
10.1039/C7RA11770A
(Paper)
RSC Adv., 2018,
8, 1255-1264
Chitosan-derived three-dimensional porous carbon for fast removal of methylene blue from wastewater
Received
25th October 2017
, Accepted 22nd December 2017
First published on 3rd January 2018
Abstract
Despite much progress in modifying chitosan as an absorbent for wastewater treatment, it is still difficult for current chitosan-based adsorbents to achieve the desired removal effects towards basic dyes. In this study, chitosan-derived three-dimensional porous carbon (CTC) consisting of large-diameter channels and mesopores was prepared to remove methylene blue (MB) from wastewater. The results indicate that CTC has excellent performance for MB removal, and the maximum adsorption capacity was 925.93 mg g−1 at 318 K. The adsorption isotherm and kinetics models of MB on CTC could be described well by the Langmuir isotherms and the pseudo-second-order rate model. An experiment to study the CTC removal of MB from a flowing aqueous solution was performed using a homemade device. The water treatment rate of CTC reached 250 L g−1 h−1, with high MB removal efficiency (>93.4%). Furthermore, the desorption–adsorption experiments indicate that CTC is also a reusable adsorbent that can be applied to recover MB from wastewater. The obtained CTC is a promising alternative for the current expensive absorbents and provides a concept for designing the three-dimensional (3D) structures of raw materials to improve adsorption capability.
1. Introduction
Dyes are used today more than ever in industries such as textiles, paper, printing, leather tanning, food processing, rubber, pulp mills, cosmetics and plastics.1,2 The worldwide consumption of dyes has exceeded 700![[thin space (1/6-em)]](https://www.rsc.org/images/entities/char_2009.gif) 000 tons annually in recent years, and approximately 10–20% is discharged into water.3 Given their varying stability to light, oxidants and microorganisms, dyes are degraded at varying rates.4 In addition, dyes are toxic and even carcinogenic to humans when they are released into the aquatic environment.5,6 Therefore, it is necessary to remove dyes from wastewater before they are released into the environment. For the effective removal of dyes from wastewater, several methods including physical, chemical and biological methods have been investigated.7–9 Among the proposed methods, adsorption technologies are regarded as a competitive method for high efficiency, economic feasibility and simplicity of design/operation.10
000 tons annually in recent years, and approximately 10–20% is discharged into water.3 Given their varying stability to light, oxidants and microorganisms, dyes are degraded at varying rates.4 In addition, dyes are toxic and even carcinogenic to humans when they are released into the aquatic environment.5,6 Therefore, it is necessary to remove dyes from wastewater before they are released into the environment. For the effective removal of dyes from wastewater, several methods including physical, chemical and biological methods have been investigated.7–9 Among the proposed methods, adsorption technologies are regarded as a competitive method for high efficiency, economic feasibility and simplicity of design/operation.10
Some adsorbents have been investigated in detail, including activated carbon,11,12 cellulose,13 inorganic oxides,14 anaerobic sludge15 and chitosan.16 Among these adsorbents, activated carbon is the most common adsorbent for the efficient removal of dyes from wastewater. However, activated carbon is usually prepared from relatively expensive materials, limiting its wide application. Some alternative low-cost adsorbents have received attention, such as the biopolymer chitin and its derivative chitosan.17,18 Chitin is a common primary material and widely distributed in the exoskeletons of crustaceans or fungal cell walls.19 Chitosan is a natural cationic polymer that can be obtained by N-deacetylation of chitin.17,20 In terms of adsorption capacity, chitosan shows more excellent adsorption performance than chitin, mainly due to its abundant hydroxyl functional groups and free amino (–NH2) groups. Chitosan is an excellent adsorbent for anionic and reactive dyes due to its chemical structure.21–23 However, chitosan shows weak adsorption performance for basic dyes.24,25 Due to low surface area and instability,26 chitosan is not an ideal absorbent for fast wastewater treatment. Thus, it is promising to modify chitosan to improve its adsorption capability for basic dyes and stability in various wastewaters.
To date, much modification research has focused on improving the adsorption capacity of chitosan or widening the range of application for various dyes, such as quarterized chitosan,25 magnetic chitosan,27,28 chitosan-activated carbon,29 chitosan clay,30 polyvinyl alcohol chitosan,31 and cross-linked chitosan.32 However, most modifications only changed the chitosan-active groups, not its original structures.33 Recently, through the design of 3D porous structures in some natural materials, excellent properties have been found, including catalysis, adsorption and electrochemical activities.34–36 The 3D porous structures not only reduce the original density of the material but also improve the exposure and accessibility of active sites to the target,37,38 which should be very useful for adsorption. The reported adsorbents generally had good adsorption capability at equilibrium, but the time interval of the equilibrium condition is long for most adsorbents, especially for chitosan-based adsorbents.39–41 To date, only a few 3D porous materials have been reported to be applied for the fast removal of dye from wastewater.42 Therefore, it is meaningful to introduce 3D porous structures into the adsorbent for the fast removal of dye from wastewater.
Here, we used chitosan as a carbon precursor to prepare a 3D porous structures adsorbent, which we named CTC. The main processes included pre-carbonization and activation with KOH at various temperatures. To study the adsorption capability of CTC towards basic dyes, MB was used as a representative basic dye. A homemade device was made to simulate rapid removal of basic dyes from flowing water. The results indicated that CTC not only showed a high adsorption capability towards MB at equilibrium but could also be applied for the fast removal of MB from flowing wastewater. The whole process of adsorption is feasible, spontaneous, and exothermic, and no secondary waste was produced. Furthermore, the obtained CTC is reusable for the removal of MB from wastewater. In summary, CTC is a promising adsorbent for real large-scale application.
2. Experimental section
2.1 Materials
Chitosan was purchased from the Guangzhou Qiyun Biotechnology Co. Ltd. According to the manufacturer's instructions, its molecular weight is 450 kDa, and the degree of deacetylation is above 95%. KOH was obtained from the Tianjin Fuchen Chemical Reagent Factory. During this experiment, the applied reactants were of analytical grade. MB (chemical formula: C16H18N3SCl·3H2O; molecular weight: 373.9; λmax = 665 nm) was a basic dye purchased from the Tianjin Damao Chemical Reagent Factory. Ethylene Diamine Tetraacetic Acid (EDTA) was purchased from Sigma. Oxalic acid was purchased from the Shanghai Macklin Biochemical Technology Company. In this study, the purity of the dyes was the original purity, without further purification.
2.2 Synthesis of CTC
Chitosan was directly heated to 450 °C in the presence of nitrogen at a heating rate of 5 °C min−1 and kept for 4 h at this temperature. The pre-carbonized char was mixed with KOH, and the impregnation ratio of KOH/char was 4. The mixtures were heated to 450 °C with a heating rate of 5 °C min−1 and maintained for 0.5 h at this temperature, followed by heating from 450 °C to 600 °C with a heating rate of 5 °C min−1 and holding for 0.5 h at 600 °C, with a final heating from 600 °C to 900 °C at a heating rate of 5 °C min−1, with a constant final temperature held for 1.5 h. After activation, the resulting CTC was ground, washed with an 0.1 M HCl solution and then distilled water until the pH was approximately 7, and it was dried at 105 °C overnight. The obtained sample was stored in a desiccator for later use. The quality of the output after each heating phase was counted. According to the counted data, the final yield of the CTC material was 22.15%.
2.3 Characterisation of CTC
The XRD patterns for chitosan and CTC were obtained with a Philips X'pert diffractometer using Cu Kα radiation at 36 kV and 20 mA over the 2θ range of 10–80°. The FTIR spectra for chitosan and CTC were recorded on a Nicolet Nexus 470 FTIR spectrometer in the range of 400–4000 cm−1 using KBr tablets containing the prepared materials. CTC structures were observed by SEM. The values of the BET surface areas of CTC and chitosan were obtained from the adsorption of N2 at 77 K using an accelerated surface area and porosimetry system (Tristar 3000, Micromeritics) and were calculated from the N2 adsorption/desorption isotherm data.
2.4 Adsorption experiments
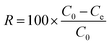
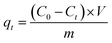
The adsorption experiments for MB were conducted by adding various doses of adsorbent into 100 mL of MB solutions with different initial concentrations. During adsorption, a thermostatted agitator was set at 140 rpm to perform the batch experiments. The absorbance values of residual dye solution were obtained by UV-vis spectrophotometry (Cary 50, Varian, USA) at a wavelength of 665 nm after filtration from the adsorbents. The flow rate is controlled by a vacuum pump (GM-0.33A, JINTENG, China), and the pH of the solution was adjusted with HCl (0.1 M and 0.01 M) and KOH (0.1 M and 0.01 M) in the fast wastewater treatment experiments. We obtained accurate values for residual MB concentrations using the linear regression of absorbance to the calibration curve of MB. The following equations were used to calculate the removal efficiency (R%) and the amount of adsorbed MB at time t (qt, mg g−1) and at equilibrium (qe, mg g−1).| |
 | (1) |
| |
 | (2) |
| |
 | (3) |
where C0, Ct and Ce (mg L−1) are the concentrations of MB solution at initial, time t and equilibrium, respectively. V (L) stands for the volume of MB solution, and m (g) is the mass of the adsorbent (CTC).
2.5 Desorption experiments
Desorption studies were performed by mixing 0.1 g of adsorbents with 50 mL of an aqueous MB solution at 100 mg L−1. The mixture was shaken at 140 rpm and 30 °C for 8 h. The solid phase was collected by filtration and washed several times with distilled water to remove any unabsorbed MB. MB-loaded adsorbents were regenerated in 50 mL of desorbing agents (distilled water, 0.1 M of EDTA, 0.1 M of hydrochloric acid, ethyl alcohol, and 0.1 M of oxalic acid) on a rotary shaker at 140 rpm for 8 h. The concentrations of MB in the elutes were determined to investigate the desorption efficiency, and the material was washed with distilled water until a neutral pH was obtained. The regenerated adsorbent was dried at 60 °C and reused in the next cycle of adsorption experiments.
3. Results and discussion
3.1 Synthesis and characterization of CTC
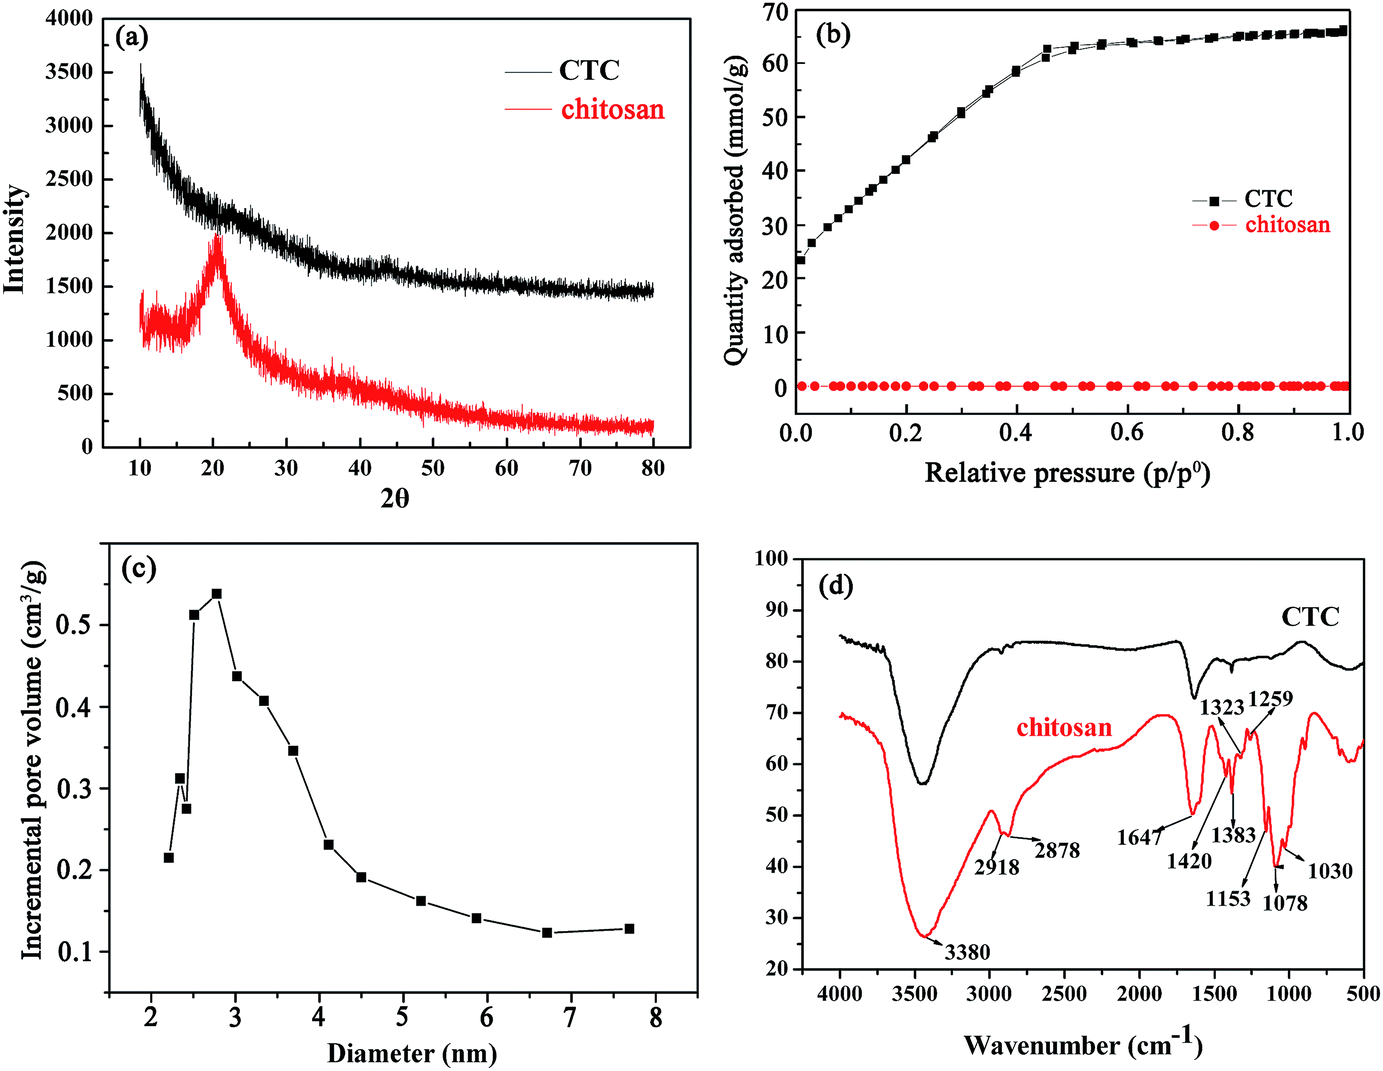
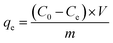
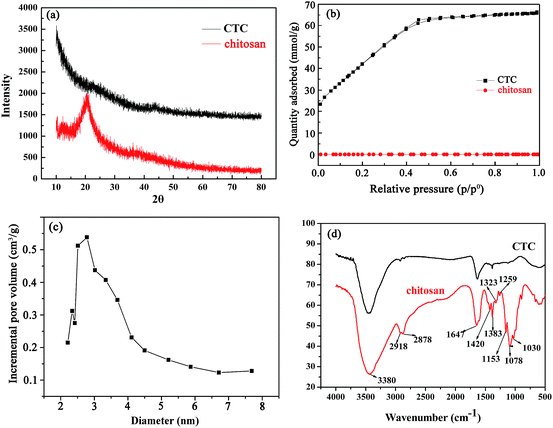
In this study, we used chitosan as a precursor. A simple synthesis comprised pre-carbonization and activation with KOH at different temperatures. Typical XRD patterns of CTC and chitosan are shown in Fig. 1a. The chitosan has a broad peak at 2θ = 20°, which is a crystalline feature of chitosan.43 After pre-carbonization and activation, the characteristic peak disappeared in the XRD pattern of CTC. This change was considered for the effect of high carbonization temperature and the activation of KOH, which might destroy the crystalline structure in the chitosan completely. Therefore, CTC contains mainly amorphous components. The nitrogen adsorption/desorption isotherms of chitosan and CTC were also presented in Fig. 1b. The isotherm of CTC corresponds to the type IV B.D.D.T classification,44 meaning that CTC is typical of mesoporous materials, while untreated chitosan can be considered as non-porous. According to the adsorption data, the BET surface areas of CTC were 3496 m2 g−1, while that of chitosan were only 0.70 m2 g−1. Thus, pre-carbonization and activation contributed a large surface area for CTC. The mechanism mainly included the reaction between KOH and pre-carbonized chitosan. During this process, the pores in the absorbent were constantly generated and expanded, with the depletion of carbon molecules from the char network and the generation of gas such as H2, CO and CO2.45–47 The generated soluble potassium salt was washed away, leaving rich pores. The pore size distributions of the CTC are shown in Fig. 1c. The results indicated that these samples contain small mesopores (2 to 8 nm). The surface functional groups of chitosan and CTC were also characterized by the FTIR spectrum. The results are shown in Fig. 1d. The principal spectral features of chitosan are as follows: 3380 cm−1 (O–H stretch superimposed on N–H stretch and inter- and extra-molecular hydrogen bonds of the polysaccharide), 2918 cm−1 and 2878 cm−1 (C–H stretch), 1647 cm−1 (amide I band, C![[double bond, length as m-dash]](https://www.rsc.org/images/entities/char_e001.gif) O stretch), 1597 cm−1 (NH2 bending), 1383 cm−1 (amide III band, C–N stretch), 1420 cm−1 and 1323 cm−1 (C–H bending), 1259 cm−1 (C–N stretch), 1155 cm−1 (bridge C–O–C stretch), and 1082 cm−1 and 1030 cm−1 (C–O stretch).48,49 Compared to chitosan, the FTIR spectral peak intensity of CTC at 1647 cm−1 decreased. This means that the C–N bond of the amide was broken after pre-carbonization and activation with KOH at various temperatures. In this process, gases were generated, including CO, H2 and CO2, leading to the formation of porous structures in CTC. The disappearance of the peaks at 1420 cm−1 and 1323 cm−1 for CTC can be attributed to fracturing of the C–H bond. The peaks at 1383 cm−1 and 1259 cm−1 decreased or disappeared. This is due to the decomposition of the N–H linkage. Meanwhile, the CTC peaks at 1155 cm−1 (bridge C–O–C stretch), 1082 cm−1 and 1030 cm−1 (C–O stretch) disappeared, possibly because both the bridge C–O–C and C–O bond were almost completely destroyed. Hence, the FTIR spectrum of CTC demonstrates that the surface groups of the original chitosan were greatly altered by pre-carbonization and activation with KOH at various temperatures. The surface morphology of CTC is shown in Fig. 2, and provides information on the size and structures of CTC. Various pores formed on the surface of CTC after pre-carbonization and activation with KOH at different temperatures. The large-diameter channels in CTC are presented in Fig. 2a, and countless small-diameter pores attached to the wall of large-diameter channels (Fig. 2b). Therefore, the obtained CTC has numerous pores that contribute to the remarkable surface area of CTC.
O stretch), 1597 cm−1 (NH2 bending), 1383 cm−1 (amide III band, C–N stretch), 1420 cm−1 and 1323 cm−1 (C–H bending), 1259 cm−1 (C–N stretch), 1155 cm−1 (bridge C–O–C stretch), and 1082 cm−1 and 1030 cm−1 (C–O stretch).48,49 Compared to chitosan, the FTIR spectral peak intensity of CTC at 1647 cm−1 decreased. This means that the C–N bond of the amide was broken after pre-carbonization and activation with KOH at various temperatures. In this process, gases were generated, including CO, H2 and CO2, leading to the formation of porous structures in CTC. The disappearance of the peaks at 1420 cm−1 and 1323 cm−1 for CTC can be attributed to fracturing of the C–H bond. The peaks at 1383 cm−1 and 1259 cm−1 decreased or disappeared. This is due to the decomposition of the N–H linkage. Meanwhile, the CTC peaks at 1155 cm−1 (bridge C–O–C stretch), 1082 cm−1 and 1030 cm−1 (C–O stretch) disappeared, possibly because both the bridge C–O–C and C–O bond were almost completely destroyed. Hence, the FTIR spectrum of CTC demonstrates that the surface groups of the original chitosan were greatly altered by pre-carbonization and activation with KOH at various temperatures. The surface morphology of CTC is shown in Fig. 2, and provides information on the size and structures of CTC. Various pores formed on the surface of CTC after pre-carbonization and activation with KOH at different temperatures. The large-diameter channels in CTC are presented in Fig. 2a, and countless small-diameter pores attached to the wall of large-diameter channels (Fig. 2b). Therefore, the obtained CTC has numerous pores that contribute to the remarkable surface area of CTC.
 |
| | Fig. 1 (a) XRD patterns of chitosan and CTC; (b) nitrogen adsorption/desorption isotherms of chitosan and CTC; (c) pore size distributions of CTC obtained by the BJH method; (d) FTIR spectrum of chitosan and CTC. | |
 |
| | Fig. 2 SEM photographs of CTC. (a) Large-diameter channels through CTC. (b) Numerous pores distributed on CTC surface. | |
3.2 Fast wastewater treatment experiments
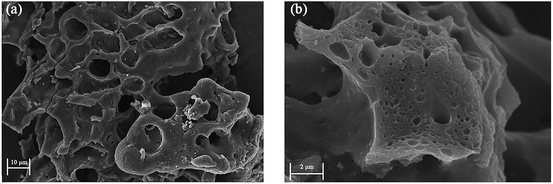
The performance during the fast treatment of wastewater is an important reference for the practical availability of adsorbents.50 In this study, another interesting finding is that CTC shows considerably fast wastewater treatment efficiency. We evaluated the removal efficiency of MB onto CTC using a homemade filter device (bottom area: 2.83 × 10⁻³ m2, height: 0.1 m), as shown in Fig. 3a. The flow rate of the aqueous solution is controlled at 1 × 10³ L m−2 h−1 by a vacuum pump. The initial blue MB solution became clear after passing through the CTC filter core (Fig. 3c). The effect of CTC dosage on the removal efficiency of MB from wastewater was investigated by adding MB solution (10 mg L−1) to the filter tube. A high removal rate of more than 93.4% was recorded for 4 g of absorbent (Fig. 4a), and the wastewater treatment rate reached 250 L g−1 h−1. However, the removal rates significantly decreased when the volume of MB solution was over 150 mL. As the speciation, degree of ionization, and surface charge of adsorbate are affected by solution pH,49 the effect of pH on the removal efficiency of CTC was also determined with a certain amount of absorbent (4 g) and the volume of MB solution (150 mL, 100 mg L−1). The results are shown in Fig. 4b. The MB–CTC system was pH-dependent. The removal amount of MB slowly increased as the solution pH increased from 2 to 8, followed by a significant increase from 8 to 12. The maximum removal amount of MB was up to 163.67 mg g−1 at pH 10. When the solution pH was in the range of 2 to 6, less removal of MB from the solution may be due to the protonation of the amine groups on the CTC surface, resulting in the decrease in available adsorbent sites for dye cations. When the pH of solution continuously increased from 8 to 10, the amount of protonated amine groups on the CTC surface might decrease, leading to the an obvious increase in the amount of MB from the solution. For the fast treatment of wastewater, the removal efficiency of MB on CTC was determined after various cycle times. The results showed that the adsorption efficiency was over 99.4% when the MB solution was cycled 4 times (Fig. 4c). To maximize the fast removal efficiency of CTC, we set a series of ratios of the amount of MB in wastewater to the weight of CTC. We found that fast removal efficiency was highest when the ratio was 0.375 (Fig. 4d). Therefore, we can determine the appropriate dosage of CTC according to the volume of wastewater and the concentration of dyes in wastewater to avoid waste.
 |
| | Fig. 3 (a) Experimental devices for fast water treatment experiments, where vacuum is applied to control water flow rates at 1 × 10³ L m−2 h−1. The blue solution in the funnel is MB solution (10 mg L−1); (b) CTC filter core with different doses; (c) close-up image of MB solution flowing through the CTC filter core. The initial blue MB solution changed to a colourless liquid after filtration. (d) Porous 3D microstructure of CTC. (e) Schematic of CTC for fast water treatment. | |
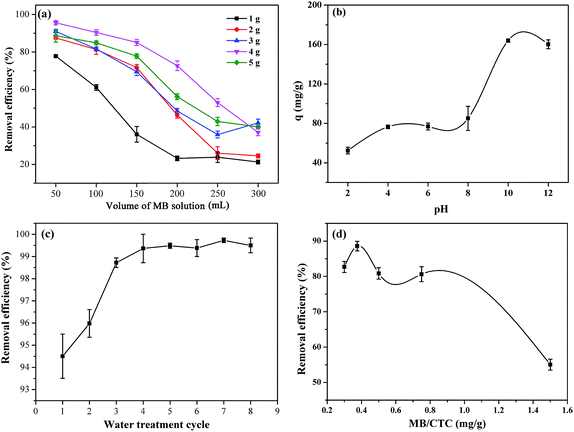 |
| | Fig. 4 (a) Removal efficiency of different amounts of MB on various doses of CTC (1 g, 2 g, 3 g, 4 g, and 5 g; MB concentration: 10 mg L−1). (b) Effect of solution pH on fast water treatment (CTC dose: 4 g, MB concentration: 100 mg L−1). (c) Effect of number of water cycles on fast water treatment (CTC dose: 4 g, MB concentration: 10 mg L−1). (d) Effect of ratios of MB amount in wastewater to weight of CTC (MB concentration: 10 mg L−1). | |
The excellent fast wastewater treatment performance of the CTC filter element was due to the 3D porous structures of CTC. These numerous pores played different roles as wastewater passed through the material. The large channels in CTC were conducive to the rapid passage of water. The small-diameter pores were attached on the wall of channels, which increased the chances of interaction between MB in solution and the active groups in CTC as MB solution passed through the channels. The 3D porous structures consisting of large-diameter channels and numerous pores enabled the rapid removal of MB from the flowing wastewater. Some studies have reported that materials with various 3D porous structures generally have excellent removal efficiency in fast wastewater treatment.42 The 3D porous structures of CTC loaded more active groups, which can be extended to other sewage treatments with special requirements. Therefore, CTC is not only an excellent adsorbent but also a promising base material for special adsorption.
3.3 Adsorption properties of MB on CTC
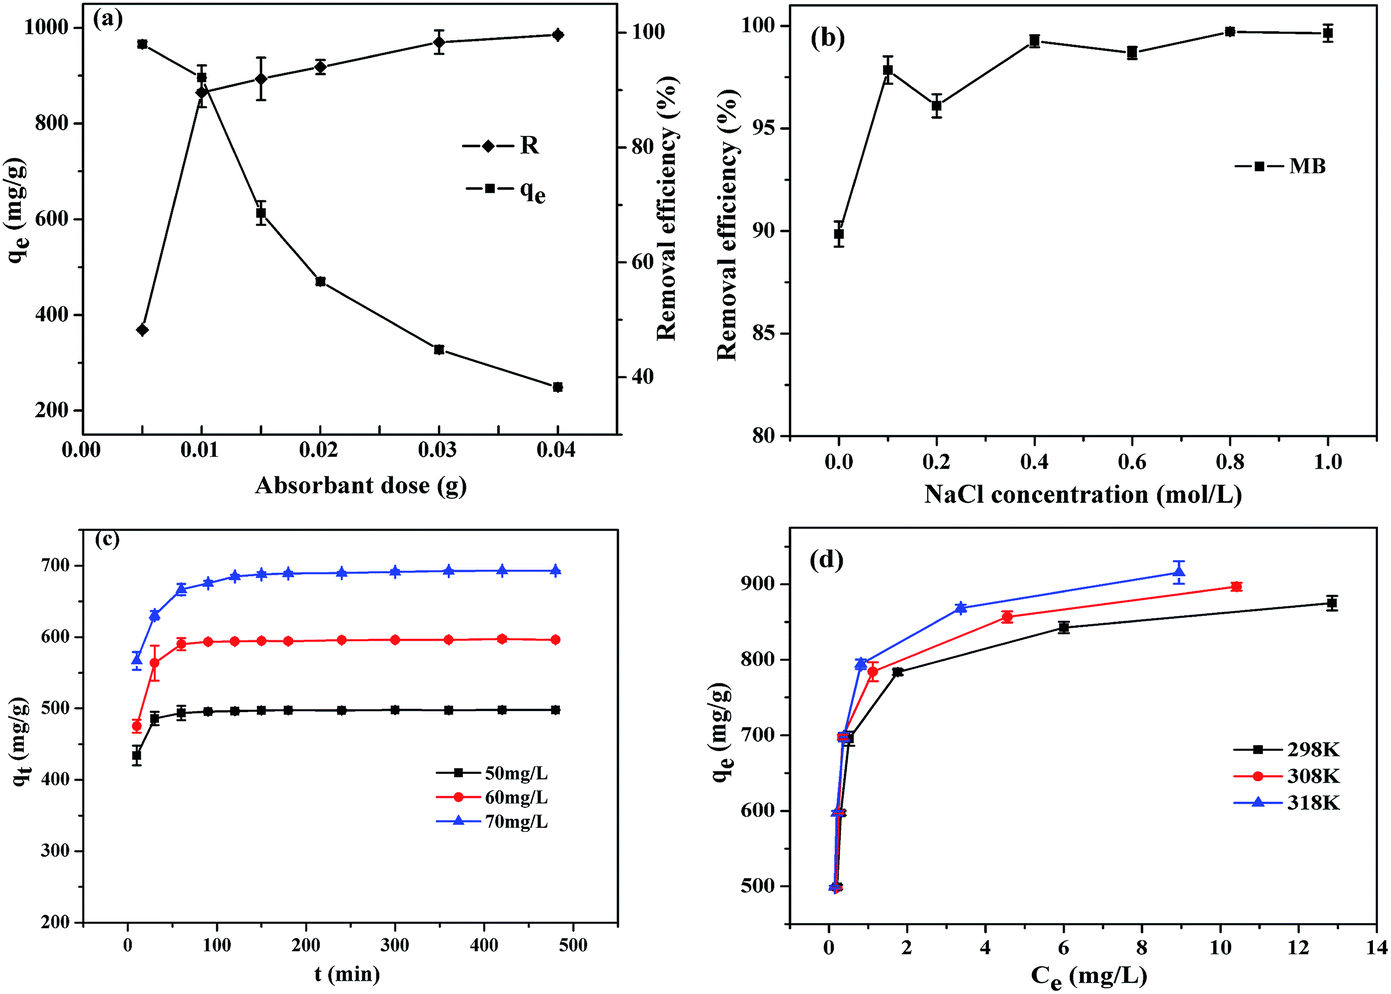
3.3.1 Effect of adsorbent dose. The effect of CTC dosage on the removal of MB from aqueous solutions was performed by dispersing different amounts (0.01–0.04 g) of CTC into a specific concentration of MB solution (100 mg L−1). The mixtures were stirred at 298 K and maintained for 8 h. The effect of adsorbent dose on the removal of MB is shown in Fig. 5a. There was an obvious increase from 89.12% to 99.50% adsorption efficiency when the CTC dosage ranged from 0.01 to 0.04 g. This increased adsorption could be explained by the increase in adsorbent sites available for dye cations, as induced by the increased CTC dosage. However, the adsorption capacities of MB onto CTC decreased from 956.23 to 249.43 mg g−1 when the CTC dose ranged from 0.01 to 0.04 g. Therefore, the optimal dosage of CTC is 0.01 g because both the removal efficiency and adsorption capacity are relatively high.
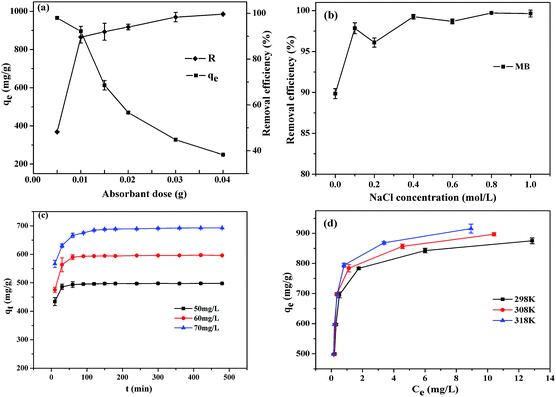 |
| | Fig. 5 (a) Effect of adsorbent dose on adsorption of MB (MB concentration: 100 mg L−1, temperature: 298 K, contact time: 8 h); (b) effect of various concentrations of NaCl solution on percentage removal of MB (adsorbent dose: 0.01 g, MB concentration: 100 mg L−1, temperature: 298 K, contact time: 8 h); (c) effects of initial concentration and contact time on adsorption of MB onto CTC (adsorbent dose: 0.01 g, temperature: 298 K); (d) adsorption isotherms of MB onto CTC (adsorbent dose: 0.01 g, contact time: 8 h). | |
3.3.2 Effect of ionic strength. The solution's ionic strength is another significant factor that affects dye adsorption. Fig. 5b shows the effect of ionic strength on the adsorption capacity of MB on CTC at different concentrations of NaCl. Different concentrations of NaCl ranged from 0 to 1 M and were mixed with a specific concentration of MB solution (100 mg L−1, 100 mL) with 0.01 g of adsorbent to determine the effect of salt (ionic strength) on the adsorption process. The samples were maintained for 8 h at 298 K. As seen from Fig. 5b, there is a slight effect on the removal of MB with increasing NaCl concentration. This result was similar to those of previous reports.51,52 During the adsorption of MB on CTC, the available sites for MB molecules could be occupied by ions from the salt due to the competitive effect. However, even with a high concentration of NaCl (1.0 mol L−1), there was a slight change in the removal capacity of MB on CTC, so CTC is an excellent adsorbent to remove MB in a high-salinity aqueous solution.
3.3.3 Effect of initial concentration and contact time. The adsorption experiments for MB on CTC were conducted at 298 K with different initial MB concentrations (50, 60, 70 mg L−1) and a CTC dosage of 0.01 g. The reaction time intervals of the experiment were 8 h, and the amount of absorbed MB was recorded. The results are shown in Fig. 5c. In the first 30 min, the adsorption rates rapidly increased. After 60, 90 and 120 min, the reaction reached equilibrium in the reaction systems with initial concentrations of MB of 50, 60 and 70 mg L−1. In the initial stage, there were many unoccupied adsorption sites for MB to adhere to, so the adsorption rate was high. However, the adsorption rate decreased when these adsorption sites were occupied by MB molecules. The lengthened time to reach equilibrium with the initial concentration of MB increased, mainly due to fiercer competition of MB molecules for active adsorption sites on CTC. The result is consistent with the report of Hameed et al.53 The amount of adsorbed MB onto CTC increased from 498.37 to 696.55 mg g−1 with the increasing initial concentration of MB from 50 to 70 mg L−1, mainly due to the increase in the driving force caused by the concentration gradient.
3.3.4 Effect of initial concentration and temperature. Three temperatures were established at 298 K, 308 K and 318 K in the experiment. The specific steps were to add 0.01 g CTC to MB solutions, with initial concentrations ranging from 50 to 100 mg L−1. The results were recorded after equilibrium for approximately 8 h. The results are shown in Fig. 5d. The adsorption capability gradually increased with an increase in dye concentration and temperature. The adsorption capability of MB on CTC increased from 498.54 to 925.93 mg g−1 when the MB concentration increased from 50 to 100 mg L−1 at 318 K. The results indicated that the initial MB concentration is one factor that influences dye removal. This may be due to the necessary driving force provided by the initial dye concentration, which offset MB mass transfer resistance between the solid and aqueous phases. According to previous reports, temperature is another key factor for the adsorption process. The adsorption capacity of MB (initial concentration 100 mg g−1) on CTC increases from 877.19 mg g−1 at 298 K to 925.93 mg g−1 at 318 K. MB molecules have a greater chance to cross the external boundary layer and the internal pores of the CTC particle when the temperature is improved, and thus diffusion more easily occurs. Adsorption is an endothermic reaction according to the result, in which the adsorption capacity increases with increasing temperature. Meanwhile, the maximum adsorption capacity of MB on CTC was 925.93 mg g−1 at 318 K, which is remarkable compared to some reported absorbents (Table 1). The removal of MB by adsorption onto CTC was due to MB in the MB+ cationic form. The mechanism for the removal of dye by adsorption may involve the following steps. The first step is the migration of dye from wastewater to the surface of the adsorbent (CTC). The second step is the diffusion of dye through the boundary layer to the surface of the adsorbent. Third, the dye combines with active sites on the surface of the adsorbent and diffuses into the interior pores of the adsorbent particle. In addition, the huge surface area of CTC provides more active sites and ensures efficient dye diffusion into the interior pores of the CTC particle. CTC is thus promising for application in wastewater treatment.
Table 1 Comparison of adsorption of MB onto various adsorbents
| Adsorbents |
T (°C) |
Maximum adsorption capacities (mg g−1) |
References |
| Biomass-based activated carbon |
30 |
259.25 |
54 |
| Sludge-based activated carbon |
30 |
263.16 |
55 |
| Bamboo-based activated carbon |
30 |
454.2 |
56 |
| Activated carbons from walnut shells |
25 |
315 |
57 |
| Chitosan-derived three-dimensional carbon |
25 |
890.32 |
This study |
The equilibrium data indicate the detailed characteristics of the adsorption capacity or dosage of CTC for removing pollutant under the given system conditions, namely, adsorption isotherms, which provide important bases to design adsorption systems.58–60 In the present study, we analysed the equilibrium data to determine the Langmuir or Freundlich isotherm model equations to fit the equilibrium data.
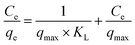
The Langmuir model assumes the adsorption of a single adsorbate onto a series of equivalent sites on the surface of the solid, with equal affinity and energy among binding sites. The adsorbed species have no interaction. The Langmuir isotherm model can be expressed by the following eqn (4):
| |
 | (4) |
where
Ce (mg L
−1) and
qe (mg g
−1) are the dye concentration and the amount of adsorbed MB at equilibrium, respectively.
KL (L mg
−1) and
qmax (mg g
−1) are the Langmuir constant and the maximum adsorption capacity, respectively. The Langmuir constant is related to the binding energy and the monolayer capacity of the sorption system.
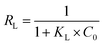
RL is an equilibrium constant to determine whether the adsorption process is favourable, and
RL is calculated by
eqn (5):
| |
 | (5) |
where
KL (L mg
−1) and
C0 (mg L
−1) are the Langmuir constant and initial MB concentration, respectively.
The adsorption isotherms are unfavourable, linear, and favourable when the RL values are >1, = 1, and <1, respectively. According to all values of RL calculated by the above equation, the range of RL is between 0 and 1, which indicated that the adsorption process of MB on CTC is favourable.
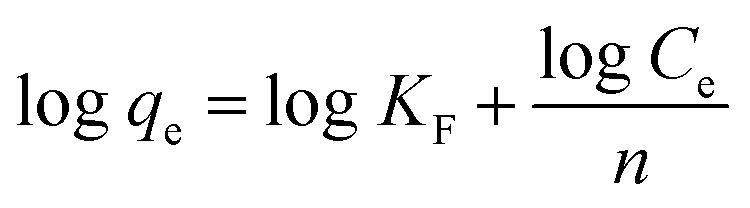
The Freundlich isotherm assumes that the adsorption of dyes occurs on heterogeneous surface by multilayer adsorption, which is sometimes non-ideal. It also assumes that the amount of adsorbed dye increases immensely when the concentration of initial dye increases. The Freundlich isotherm model equation is as follows:
| |
 | (6) |
The Langmuir and Freundlich isotherm model constants, along with the parameters and correlation coefficients, are summarized in Table 2. According to the correlation coefficient values (R2), the Langmuir model better describes the process of adsorption. The maximum adsorption capacity of CTC was 925.93 mg g−1 at 318 K, and the physical monolayer adsorption of MB on CTC occurs at specific homogeneous sites.
Table 2 Isotherm constants for adsorption of MB
| T (K) |
Langmuir model |
Freundlich model |
| qmax (mg g−1) |
KL (L mg−1) |
R2 |
KF (L g−1) |
1/n |
R2 |
| 298 |
890.32 |
5.6542 |
0.99986 |
680.72 |
0.11936 |
0.85468 |
| 308 |
909.09 |
6.4663 |
0.99978 |
709.50 |
0.12362 |
0.81821 |
| 318 |
925.93 |
7.2561 |
0.99988 |
732.11 |
0.13114 |
0.85169 |
3.4 Kinetic studies
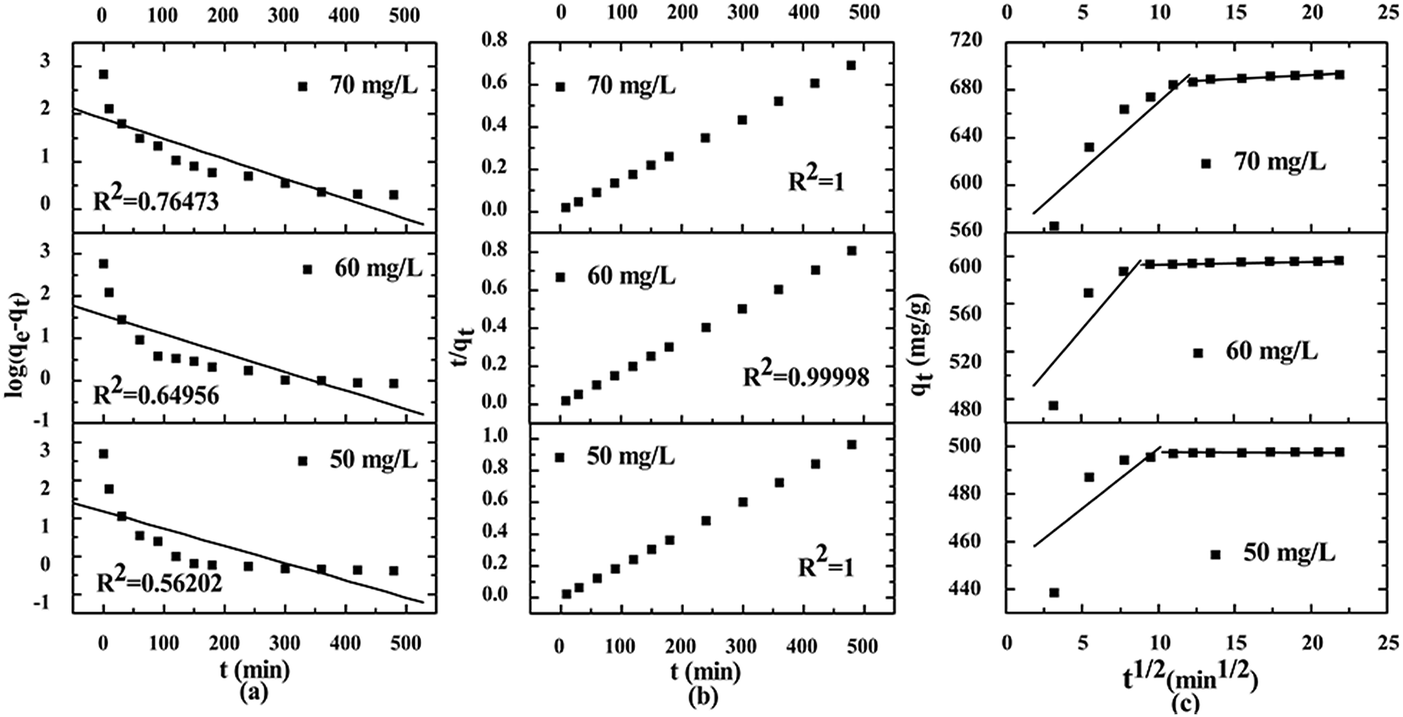
Kinetic models are usually used to explore the controlling mechanisms between dyes and the absorbent. Our results are shown in Fig. 6. The initial adsorption capacity of MB on CTC was high and sharply increased within 30 min. Thus, it is important to know the concrete controlling mechanisms for the adsorption process of MB on CTC. There were numerous chemical groups on the pore surface of CTC, which implied more types of interactions between MB and CTC. The kinetic models include pseudo-first-order, pseudo-second-order and intra-particle diffusion.44,45,56 Through these kinetic models, the behaviour of MB onto CTC was better understood. R2 represents the correlation coefficient of the model, which was used to judge whether the studied equation was suitable for the adsorption process. First, we used the pseudo-first-order equation to fit the experimental data as follows:| |
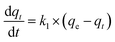 | (7) |
 |
| | Fig. 6 Adsorption kinetics for MB adsorption by CTC (adsorbent dose: 0.01 g, temperature: 298 K, contact time: 8 h). (a) Pseudo-first-order; (b) pseudo-second-order; (c) intra-particle diffusion model. | |
We applied the boundary conditions (qt = 0 at t = 0 and qt = qt at t = t) for definite integration, and eqn (7) shifted as follows:
| |
 | (8) |
where
qe and
qt represent the amount of MB absorbed at equilibrium and a specific time (
t), respectively, and
k1 represents the pseudo-first-order equation rate constant. The values of log(
qe −
qt)
versus t were obtained from the experimental kinetic data at various concentrations of MB, and the results are shown in
Fig. 6a. The pseudo-first-order constants obtained from experiments are presented in
Table 3. All calculated correlation coefficients
R2 were low, ranging from 0.39171 to 0.64956. In addition, the calculated theoretic values of
qe,cal are far from the experimental values of
qe,exp. According to the above results, we suggest that the pseudo-first-order model is not suitable to describe the adsorption process of MB on CTC.
Table 3 Kinetic parameters for MB adsorption onto CTC
| Kinetic models |
Dye concentration (mg L−1) |
| 50 |
60 |
70 |
| qe,exp (mg g−1) |
497.95 |
597.03 |
694.85 |
| Pseudo-first-order |
| qe,cal (mg g−1) |
15.07 |
35.69 |
80.30 |
| K1 (min−1) |
0.01040 |
0.01030 |
0.00972 |
| R12 |
0.56202 |
0.64956 |
0.76473 |
|
| Pseudo-second-order |
| qe,cal (mg g−1) |
498.51 |
598.80 |
699.30 |
| K2 (g mg−1 min−1) |
0.00406 |
0.00127 |
0.00053 |
| R22 |
1 |
0.99998 |
1 |
|
| Intra-particle diffusion |
| kP (mg g−1 min−1/2) |
1.74 |
3.71 |
4.94 |
| R32 |
0.70807 |
0.87092 |
0.84620 |
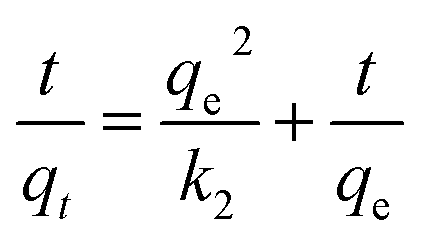
Another model of kinetic models, pseudo-second-order, could describe the adsorption process, presented as the following equation:
| |
 | (9) |
where
k2 is the pseudo-second-order rate constant. Under the boundary conditions
qt = 0 at
t = 0 and
qt =
qt at
t =
t, we integrated
eqn (9) and obtained the simple and linear equation as follows:
| |
 | (10) |
The values of qe and k2 are obtained experimentally from the slope and the intercept of plot t/qt versus t. The linear plot of t/qt versus t is shown in Fig. 6b, which facilitates the applicability of the pseudo-second-order equation. The detailed kinetic results are shown in Table 3, including k2, qe (qe,exp) and R22. According to the data in Table 3, the adsorption processes are well explained by the pseudo-second-order model because the correlation coefficients R22 are higher than 0.9999.
Finally, we used the intra-particle diffusion model to fit the experimental data. It is possible that there is intraparticle diffusion during adsorption, and the intra-particle diffusion equation is as follows:
where
kp is the intra-particle diffusion rate constant. The equation plots of
qt versus t1/2 of MB at different initial concentrations are shown in
Fig. 6c. The rate constants
kp,
I,
R32 are listed in
Table 3. The correlation coefficients
R32 are between 0.70807 and 0.87092, lower than the correlation coefficients
R22. Hence, the intra-particle diffusion model is not suitable to describe the adsorption of MB on CTC.
3.5 Thermodynamic parameters
The adsorption study was performed at 298, 308 and 318 K. The adsorption thermodynamic parameters were calculated according to the following equations, including changes in free energy (ΔG0), enthalpy (ΔH0), and entropy (ΔS0).| | |
ΔG0 = −Rgas × T × InKL
| (12) |
where, at equilibrium for the above equation, KL (L mg−1) represents the Langmuir constant, and Rgas (8.314 J mol−1 K−1) and T (K) represent the universal gas constant and the solution temperature, respectively. ΔG0 is the change in Gibbs free energy (kJ mol−1), and ΔH0 (kJ mol−1) and ΔS0 (J (K−1 mol−1)) are the heat of reaction and the change in entropy, respectively. ΔG0, ΔH0 and ΔS0 are shown in Table 4. These results suggest that the adsorption of MB on CTC is spontaneous; ΔG0 is −4.29 at 298 K, −4.78 at 308 K and −5.24 at 318 K. According to the above results, ΔG0 value is decreasing when the temperature slowly rises, which indicates that the adsorption process of MB on CTC is more active at higher temperature. The positive value of ΔH0 (9.86 kJ mol−1) indicates that the adsorption process of MB on CTC is endothermic. The positive entropy change ΔS0 (0.048 kJ mol−1 K−1) shows that disorder occurs at the solid-solution interface during MB adsorption. As the temperature increases, the decrease in the mobility of MB molecules enables the molecules to more easily adsorb onto the solid phase.
Table 4 Thermodynamic parameters for MB adsorption onto CTC
| Absorbent |
ΔH0 (kJ mol−1) |
ΔS0 (kJ mol−1 K−1) |
ΔG0 (kJ mol−1) |
| 298 K |
308 K |
318 K |
| CTC |
9.86 |
0.048 |
−4.29 |
−4.78 |
−5.24 |
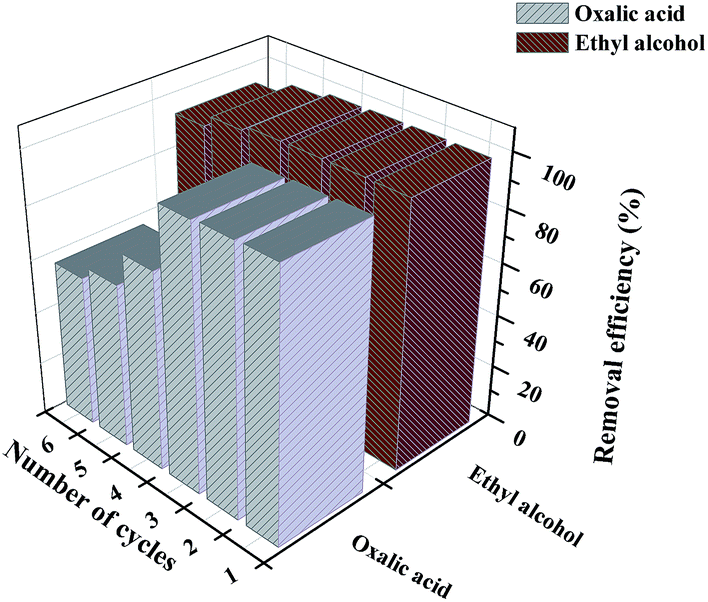
3.6 Desorption and reusability
The desorption efficiency and regeneration potential of absorbents is critical for the absorbent's economy and feasibility. Therefore, we studied the desorption efficiency and regeneration potential of CTC by the batch method using various desorption agents, such as distilled water, 0.1 M of EDTA, 0.1 M of hydrochloric acid, ethyl alcohol, and 0.1 M of oxalic acid solutions. The adsorption efficiencies of MB on CTC were summarized after repeated adsorption–desorption by five desorption agents (Fig. 7). The two best desorption agents are listed in Fig. 8. The results indicated that the highest desorption effect for MB was obtained using ethyl alcohol, and the adsorption efficiency of MB on CTC was not significantly decreased after 6 cycles; the efficiency was above 93%. Oxalic acid showed the second highest desorption effect. After 6 adsorption–desorption cycles of MB on CTC using 0.1 M oxalic acid solutions, the removal efficiency of MB on CTC decreased to 55%. Incomplete desorption can be attributed to the physical adsorption between adsorbent and MB.61 From the above results, CTC was a good reusable adsorbent and can be successfully applied to the removal of dyes from wastewater.
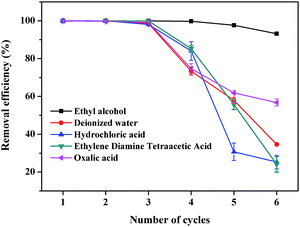 |
| | Fig. 7 Effect of adsorption–desorption cycles on removal efficiency of MB on CTC. | |
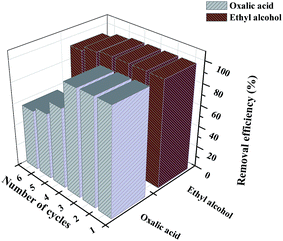 |
| | Fig. 8 Removal efficiency of CTC after repeated adsorption–desorption operations. | |
4. Conclusions
In summary, we prepared CTC with 3D porous structures consisting of mesopores and large-diameter channels via pre-carbonization and activation with KOH. The obtained CTC is applied as a low-cost and environmental friendly adsorbent for the removal of basic dyes. The results indicated that CTC has a remarkable adsorption capacity towards MB up to 925.83 mg g−1 in the equilibrium condition. Meanwhile, the excellent fast removal capability of MB from flowing wastewater was obtained, with a high removal rate up to 93.4% when the wastewater flowing rate was 250 L g−1 h−1. These excellent results are primarily due to the increased accessibility of active sites between MB molecules and CTC and the rich suitable pores for the diffusion of MB molecules. In addition, CTC was a good reusable adsorbent and could be successfully applied to recover MB from wastewater. Therefore, the obtained CTC could be a promising absorbent that can be widely used in practice. Our findings will encourage more efforts to design 3D porous structures in natural materials using controllable activation methods, and the obtained materials can be utilized as base materials for further modification.
Conflicts of interest
There are no conflicts to declare.
Acknowledgements
This work was supported by National Natural Science Foundation of China (Grant No. 41401564) and International cooperation project of Ministry of Science and technology (2015DFA11660).
References
- J. Sokolowska-Gajda, H. S. Freeman and A. Reife, Dyes Pigm., 1996, 30, 1–20 CrossRef CAS.
- I. Kabdaşli, O. Tünay and D. Orhon, Water Sci. Technol., 1999, 40, 261–267 Search PubMed.
- J. F. Gao, Q. Zhang, J. H. Wang, X. L. Wu, S. Y. Wang and Y. Z. Peng, Bioresour. Technol., 2011, 102, 805 CrossRef CAS PubMed.
- Y. C. Wong, Y. S. Szeto, W. H. Cheung and G. McKay, Langmuir, 2003, 19, 7888–7894 CrossRef CAS.
- Y. Gao, C. Li, J. Shen, H. Yin, X. An and H. Jin, J. Food Sci., 2011, 76, 125–129 CrossRef PubMed.
- Y. C. Wong, Y. S. Szeto, W. H. Cheung and G. Mckay, Process Biochem., 2004, 39, 695–704 CrossRef.
- N. Azbar, T. Yonar and K. Kestioglu, Chemosphere, 2004, 55, 35–43 CrossRef CAS PubMed.
- J. W. Lee, S. P. Choi, R. Thiruvenkatachari, W. G. Shim and H. Moon, Dyes Pigm., 2006, 69, 196–203 CrossRef CAS.
- J. H. Mo, H. L. Yong, J. Kim, J. Y. Jeong and J. Jegal, Dyes Pigm., 2008, 76, 429–434 CrossRef CAS.
- P. Sharma, H. Kaur, M. Sharma and V. Sahore, Environ. Monit. Assess., 2011, 183, 151 CrossRef CAS PubMed.
- O. H. Duygu and J. H. Van Leeuwen, J. Food Eng., 2010, 101, 106–112 CrossRef.
- J. S. Piccin, C. S. Gomes, L. A. Feris and M. Gutterres, Chem. Eng. J., 2012, 183, 30–38 CrossRef CAS.
- A. Tabara, C. Yamane, M. Abe and M. Seguchi, Cellulose, 2011, 18, 45–55 CrossRef CAS.
- K. Siwińska-Stefańska, M. Nowacka and T. Jesionowski, Dyes Pigm., 2012, 94, 338–348 CrossRef.
- L. Yu, W. W. Li, M. H. Lam and H. Q. Yu, Appl. Microbiol. Biotechnol., 2011, 90, 1119 CrossRef CAS PubMed.
- A. Debrassi, A. F. Corrêa, T. Baccarin, N. Nedelko, A. Ślawska-Waniewska, K. Sobczak, P. Dłużewski, J. M. Greneche and C. A. Rodrigues, Chem. Eng. J., 2012, 183, 284–293 CrossRef CAS.
- G. Crini, Bioresour. Technol., 2006, 97, 1061–1085 CrossRef CAS PubMed.
- L. Huo, S. Zhang, X. Guo, F. Xu, Y. Li and J. Hou, Angew. Chem., 2011, 50, 9697 CrossRef CAS PubMed.
- R. A. Muzzarelli, Chitin, Elsevier, 2013 Search PubMed.
- M. S. Chiou and H. Y. Li, Chemosphere, 2003, 50, 1095 CrossRef CAS PubMed.
- S. Chatterjee, S. Chatterjee, B. P. Chatterjee, A. R. Das and A. K. Guha, J. Colloid Interface Sci., 2005, 288, 30 CrossRef CAS PubMed.
- G. Annadurai, L. Y. Ling and J. F. Lee, J. Hazard. Mater., 2008, 152, 337 CrossRef CAS PubMed.
- Z. Bekçi, C. Özveri, Y. Seki and K. Yurdakoç, J. Hazard. Mater., 2008, 154, 254–261 CrossRef PubMed.
- G. Crini, F. Gimbert, C. Robert, B. Martel, O. Adam, N. Morincrini, G. F. De and P. M. Badot, J. Hazard. Mater., 2008, 153, 96–106 CrossRef CAS PubMed.
- M. Sarkar and P. Majumdar, Chem. Eng. J., 2011, 175, 376–387 CrossRef CAS.
- M. N. Kumar, R. A. Muzzarelli, C. Muzzarelli, H. Sashiwa and A. J. Domb, Chem. Rev., 2004, 104, 6017–6084 CrossRef PubMed.
- L. Zhou, Y. Wang, Z. Liu and Q. Huang, J. Hazard. Mater., 2009, 161, 995 CrossRef CAS PubMed.
- A. Mohseni-Bandpi, B. Kakavandi, R. R. Kalantary, A. Azari and A. Keramati, RSC Adv., 2015, 5, 73279–73289 RSC.
- A. H. Gedam and R. S. Dongre, RSC Adv., 2016, 6., 22639–22652 RSC.
- X. Li, Y. Li and Z. Ye, Chem. Eng. J., 2011, 178, 60–68 CrossRef CAS.
- G. Z. Kyzas and N. K. Lazaridis, J. Colloid Interface Sci., 2009, 331, 32 CrossRef CAS PubMed.
- R. P. Han, J. J. Zhang, P. Han, Y. F. Wang, Z. H. Zhao and M. S. Tang, Chem. Eng. J., 2009, 145, 496–504 CrossRef CAS.
- S. Sengupta, A. Goswami and R. Mondal, New J. Chem., 2014, 38, 2470–2479 RSC.
- Z. Liu, H. Nie, Z. Yang, J. Zhang, Z. Jin, Y. Lu, Z. Xiao and S. Huang, Nanoscale, 2013, 5, 3283–3288 RSC.
- X. Zhang, D. Liu, L. Yang, L. Zhou and T. You, J. Mater. Chem. A, 2015, 3, 10031–10037 CAS.
- F. L. Meng, Z. L. Wang, H. X. Zhong, J. Wang, J. M. Yan and X. B. Zhang, Adv. Mater., 2016, 28, 7948 CrossRef CAS PubMed.
- B. H. Hameed, A. A. Ahmad and N. Aziz, Chem. Eng. J., 2007, 133, 195–203 CrossRef CAS.
- Y. Xue, H. Hou and S. Zhu, Chem. Eng. J., 2009, 147, 272–279 CrossRef CAS.
- M. Sekar, V. Sakthi and S. Rengaraj, J. Colloid Interface Sci., 2004, 279, 307–313 CrossRef CAS PubMed.
- S. Senthilkumaar, P. R. Varadarajan, K. Porkodi and C. V. Subbhuraam, J. Colloid Interface Sci., 2005, 284, 78–82 CrossRef CAS PubMed.
- Y. Liu, Y. Tian, C. Luo, G. Cui and S. Yan, New J. Chem., 2015, 39, 5484–5492 RSC.
- F. Chen, A. S. Gong, M. Zhu, G. Chen, S. D. Lacey, J. Feng, Y. Li, Y. Wang, J. Dai and Y. Yao, ACS Nano, 2017, 11, 4275 CrossRef CAS PubMed.
- S. Kumar and J. Koh, Int. J. Mol. Sci., 2012, 13, 6102–6116 CrossRef CAS PubMed.
- C. Sheindorf, M. Rebhun and M. Sheintuch, J. Colloid Interface Sci., 1981, 79, 136–142 CrossRef CAS.
- M. A. Lillo-Ródenas, D. Cazorla-Amorós and A. Linares-Solano, Carbon, 2003, 41, 267–275 CrossRef.
- L. Chunlan, X. Shaoping, G. Yixiong, L. Shuqin and L. Changhou, Carbon, 2005, 43, 2295–2301 CrossRef.
- W. Qiao, A. Seongho Yoon and I. Mochida, Energy Fuels, 2006, 20, 1680–1684 CrossRef CAS.
- K. R. Hall, L. C. Eagleton, A. Acrivos and T. Vermeulen, Ind. Eng. Chem. Fundam., 1966, 5 CAS.
- V. S. Mane, I. D. Mall and V. C. Srivastava, Dyes Pigm., 2007, 73, 269–278 CrossRef CAS.
- B. Farizoglu, A. Nuhoglu, E. Yildiz and B. Keskinler, Filtr. Sep., 2003, 40, 41–47 CrossRef CAS.
- Y. S. Al-Degs, M. I. El-Barghouthi, A. H. El-Sheikh and G. M. Walker, Dyes Pigm., 2008, 77, 16–23 CrossRef CAS.
- L. Wang, J. Zhang, R. Zhao, C. Li, Y. Li and C. L. Zhang, Desalination, 2010, 254, 68–74 CrossRef CAS.
- B. Hameed, A. Ahmad and N. Aziz, Chem. Eng. J., 2007, 133, 195–203 CrossRef CAS.
- S. K. Theydan and M. J. Ahmed, J. Anal. Appl. Pyrolysis, 2012, 97, 116–122 CrossRef CAS.
- W.-H. Li, Q.-Y. Yue, B.-Y. Gao, Z.-H. Ma, Y.-J. Li and H.-X. Zhao, Chem. Eng. J., 2011, 171, 320–327 CrossRef CAS.
- B. Hameed, A. M. Din and A. Ahmad, J. Hazard. Mater., 2007, 141, 819–825 CrossRef CAS PubMed.
- J. Yang and K. Qiu, Chem. Eng. J., 2010, 165, 209–217 CrossRef CAS.
- Y. S. Ho and G. Mckay, Process Biochem., 1999, 34, 451–465 CrossRef CAS.
- Y. S. Ho and C. C. Chiang, Adsorption, 2001, 7, 139–147 CrossRef CAS.
- H. Yuh-Shan, Scientometrics, 2004, 59, 171–177 CrossRef.
- X. Li, Y. Li, S. Zhang and Z. Ye, Chem. Eng. J., 2012, 183, 88–97 CrossRef CAS.
|
| This journal is © The Royal Society of Chemistry 2018 |
Click here to see how this site uses Cookies. View our privacy policy here. 
 Open Access Article
 This Open Access Article is licensed under a Creative Commons Attribution-Non Commercial 3.0 Unported Licence
 a,
Yadong Li
a,
Yadong Li