 Open Access Article
Polysulfone foam with high expansion ratio prepared by supercritical carbon dioxide assisted molding foaming method
Zhengkun Li,
Yingbin Jia and
Shibing Bai *
*
State Key Laboratory of Polymer Materials Engineering, Polymer Research Institute of Sichuan University, Chengdu 610065, China. E-mail: baishibing@scu.edu.cn
First published on 12th January 2018
Abstract
Polysulfone (PSU) is considered as an important candidate for the fabrication of high-performance microcellular polymers, but the preparation of PSU foam with a high expansion ratio still remains a big challenge worldwide. In this study, high expansion ratio PSU foam was successfully prepared by a supercritical carbon dioxide (CO2) assisted molding foaming method. The foaming behavior of PSU under supercritical CO2 was systematically studied in various process conditions and different microcellular structures were created in PSU foams. The results showed that foaming temperature and CO2 concentration were the key factors to obtain microcellular foams with tailored microstructures. The cellular structure and expansion ratio of PSU foam obviously changed with different foaming temperatures. The expansion ratio and average cell size firstly increased and then decreased as foaming temperature increased. However, the cell density decreased and then remained stable as foaming temperature increased. The maximum expansion ratio of 11.0 was reached at the optimum foaming temperature of 200 °C. Cellular structure and morphologies of the foam changed obviously at CO2 concentrations below 5% and remained stable at CO2 concentrations above 5%. Finally, the prepared PSU foams exhibit excellent mechanical strength, good thermal conductivity, and superb heat retardancy, thus may have great potential application as a kind of substitute material in the electrical wire and cable industry, railway and steamer transportation, oil and gas platforms, military use and in other fields.
1. Introduction
Microcellular polymer foam, usually prepared by gas dispersion in a solid plastic, is widely used in industry, agriculture, construction, transportation and other fields.1 Compared with solid materials, there are many excellent properties of foamed polymers, such as light mass, special high strength,2,3 good heat insulation4,5 and soundproof performance.6 Currently, the most widely used general plastic foams mainly include polyurethane (PU), polystyrene (PS), polyvinyl chloride (PVC), polyethylene (PE), phenolic resin (PF) foam, and so on. However, because of the poor matrix performance of general plastics, these foams have a number of drawbacks such as being easy to burn,7,8 low mechanical strength,9 and poor thermal stability10 etc., and therefore they cannot meet the requirements in some fields, especially in high-tech fields.Compared with general plastics, special engineering plastics have excellent comprehensive properties. Polysulfone (PSU) is one of the most commonly used special engineering plastics, which has many outstanding properties, for instance, high modulus, strength and hardness, and especially an intrinsic flame retardant property. In addition, it also has outstanding thermal stability, chemical solvent resistance, and eximious aging resistance. Therefore, there is a broad application prospect for PSU in many fields, such as in aerospace, the automotive industry, insulation materials, microelectronics packaging, flexible circuit boards and other high-tech fields.11,12 PSU foam has also been used in the electrical wire and cable industry as an environmental-friendly material, and it is foreseeable that PSU foam will be a desirable manufacturing material in railway and steamer transportation, oil and gas platforms, military use and in other fields. However, as there are few related studies, it is urgent to research PSU foams and related applications. It is very difficult to prepare PSU foam because of its high processing temperature (270–300 °C). Meanwhile, the foaming agent is difficult to be absorbed by PSU at this high temperature. The lack of high temperature foaming agents and the corresponding foaming equipment has become the biggest obstacle13 to prepare PSU foam. Therefore, some new methods should be developed.
Polymer foam prepared by supercritical fluid (SCF) is a newly developed green foam technology. There are many unique characteristics for supercritical carbon dioxide (scCO2) such as high solubility and diffusivity.14 In addition, it has other advantages like critical state (31.26 °C, 7.29 MPa) is very easy to be realized. So, it can be used in the fields of foaming, especially engineering plastic foaming. Ma Z.15 has prepared polyphenylene sulfide (PPS)/polyether sulfone (PES) foam materials with scCO2 by solid batch foaming method, but there was a pretty small expansion ratio, which was only 3. Sorrentino et al.16 processed polyphenylsulphone (PPSU) and PES foam through the batch foaming and solid-state foaming methods respectively, and found that PPSU and PES foam materials only had the largest expansion ratio at 4 with the optimum foaming conditions whether in the batch foaming method or in the solid-state method. Guo et al.17 reported the fabrication of PSU foams by solid-state foaming process and found the average cell size decreased with the increasing of the CO2 concentration in the polymer, but the expansion ratio was still low. PSU foam is usually prepared through batch foaming or solid-state foaming by scCO2,18–20 but there exist some shortages: low CO2 solubility at foaming temperature or gas escape because of open environment during the foaming process. Owning to these problems, the foam density is larger, even close to unfoamed sample, and it is difficult to realize the industrialized production. Thus, how to produce high expansion ratio foams becomes a new urgent problem.
As we know, low temperature and high pressure will increase the CO2 absorption of polymers. If making PSU absorb more CO2 at low temperature and high pressure, and offering a closed environment by the mold to reduce the gas escape at the pressure holding stage, under these conditions there still remains a large amount of CO2 in the melt matrix at the foaming process. So the PSU foam with high expansion ratio will be obtained. However, few studies on foaming have been found through this method in a closed environment. In this work, the new method was used to prepare a series of PSU foams, and their structures, influence factors, and performance were investigated.
2. Experimental section
2.1. Materials
The PSU (Udel® PSU P-1700) used in this study was supplied by Solvay Company in the United States. Melt flow index (MFI) is 7 g/10 min (ASTMD-1238). Glass transition temperature (Tg) of the material was measured using a Q20 differential scanning calorimetry apparatus (TA, America), with a heating rate of 10 °C min−1. Tg was determined to be 187 °C using the half-height method. Density (ρ) was 1.24 g cm−3. Carbon dioxide (CO2) was supplied by Taiyu Airproduct with a purity higher than 99.9%.2.2. CO2 adsorption
The PSU pellets were first treated in a vacuum oven at 100 °C for 6 h to remove the low molecular weight species, and then placed in a pressure vessel with a certain pressure and certain temperature for a certain time. Then samples were periodically taken out from the pressure vessel by quickly reducing the pressure to atmospheric pressure in the 30 s and immediately weighed on a Mettler AE240 analytical scale accurate to ±10 μg to measure gas uptake. The saturation pressure was 6 MPa, 8 MPa, 10 MPa, and 12 MPa, the saturation temperature was 25 °C, 45 °C, 65 °C, and 85 °C and the saturation time was 1 h, 2 h, 4 h, 6 h, 9 h, and 12 h, respectively.2.3. Foaming
In this study, a new foaming method was proposed, as shown in Fig. 1. First, the pellet sample was placed in a high pressure vessel at 25 °C and 12 MPa for different time to make sure polymer absorb different concentration CO2. Subsequently, the sample was put out from the vessel and immediately transferred into the mold. After that the mold filled with the pellet sample was pressed to 20 MPa in 10 seconds by the press vulcanizer, which was maintained at a high temperature-foaming temperature. 5 minutes was needed for the polymer to foam a supersaturation state PSU/CO2 solution. The next step was opening mold and pressure released, just in this stage cell nucleation, growth, and solidification were accomplished instantly. In this study, the foaming temperature was 170 °C, 180 °C, 190 °C, 200 °C, 210 °C and 220 °C, and the saturation time was 1 h, 2 h, 4 h, 6 h, 9 h, and 12 h, respectively. The size of the mold was 6 mm × 100 mm × 100 mm.2.4. Characterizations
 | (1) |
3. Results and discussion
3.1. CO2 adsorption
The CO2 concentration of PSU was investigated under a wide range of processing conditions. Fig. 2a and b respectively shows CO2 adsorption in PSU at different saturation temperatures under 12 MPa and saturation pressures at 45 °C. It can be seen that the CO2 concentration in the PSU increased and then reached equilibrium with the increasing time. After reaching equilibrium, the CO2 concentration decreased with the temperature increasing. When saturation temperature was 25 °C, the CO2 concentration was 8.68%, nearly two times of that at 85 °C. Thus, it can be predicted that the CO2 concentration in the polymer is pretty small when the temperature is up to foaming temperature, which will have a great influence on foaming. As for the influence of saturation pressure, it can be seen that the CO2 concentration increased with the pressure increasing. Especially, the CO2 concentration at 12 MPa was also nearly two times of that at 6 MPa. This meant it is beneficial for foaming at a higher pressure atmosphere. However, there was an open environment or gas escape in traditional foaming methods. While in the new foaming method, a closed environment was offered by the mold to reduce the gas escape at the pressure holding stage, under these conditions there still remains a large amount of CO2 in the melt matrix at the foaming process. So the PSU foam with high expansion ratio will be obtained. In order to increase the CO2 concentration in the polymer, the saturation pressure 12 MPa and the saturation temperature 25 °C have been chosen in the experiment.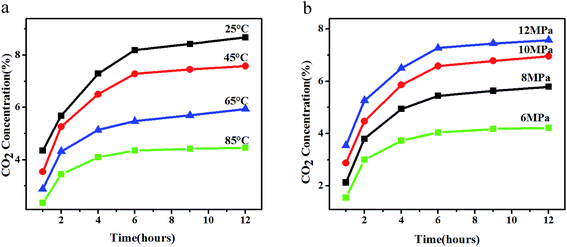 | ||
| Fig. 2 CO2 adsorption in PSU at different saturation temperatures under 12 MPa (a) and different saturation pressures at 45 °C (b). | ||
3.2. CO2 plastication
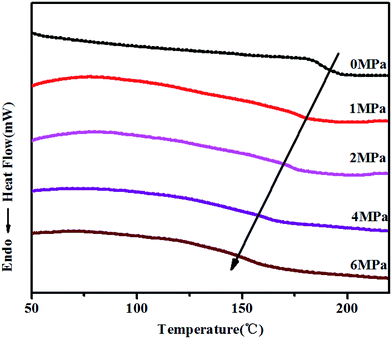
Fig. 3 is HP-DSC heating curves of PSU under different CO2 pressures. It can be clearly found that there is a significant decrease of the Tg under CO2. As CO2 is a Lewis acid, the carbon atom lack of electronic in the CO2 molecule can become electron acceptor,21 thus there will be a special interaction between CO2 molecule and some groups like phenyl group, sulfuryl group.22 And CO2 as a small molecule plasticizer, can magnify the distance between PSU molecules, augment the free volume of the molecules and weaken attraction between the molecules, and thus increase mobility between polymer molecular chains. Thus, there is a big reinforce for polymer plastication and foaming temperature significantly decreases.Table 1 is Tg data from HP-DSC heating curves, and the influence of CO2 on the Tg can be received. Under CO2 pressure from 1 MPa to 6 MPa, the Tg linearly decreased with the increase of CO2 pressure, which meant that the processing properties has been greatly promoted by the addition of CO2.
| Pressure (MPa) | 0 | 1 | 2 | 4 | 6 |
| Tg (°C) | 187 | 177 | 171 | 160 | 152 |
Polymer viscosity is an important influence factor in polymer foaming23,24 and high pressure capillary test was done in this research. As shown in Fig. 4, at the CO2 concentration below 5%, the polymer shear viscosity reduced with the increase of CO2 concentration, which was in agreement with the previous reports.25 However, when at CO2 concentration above 5%, the polymer shear viscosity kept stable with the increase of CO2 concentration. This indicated that too high CO2 concentration didn't influence the viscosity of PSU. But the viscosity had an obvious decrease under the effect of CO2. So there would be a perfect way for PSU to solve the problem of difficult processing and to provide the appropriate foaming agent.
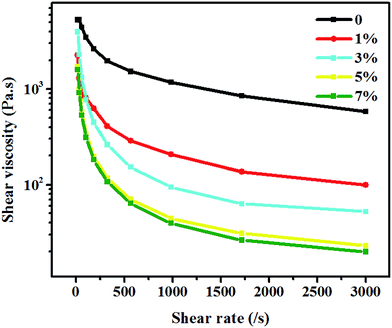 | ||
| Fig. 4 High pressure capillary curve of PSU at different CO2 concentrations with temperature (280 °C). | ||
3.3. Foaming
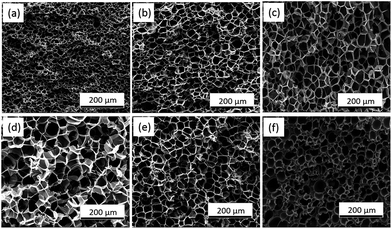 | ||
| Fig. 5 SEM pictures of PSU foams at different foaming temperatures with CO2 concentration (7%): (a) 170 °C, (b) 180 °C, (c) 190 °C, (d) 200 °C, (e) 210 °C, (f) 220 °C. | ||
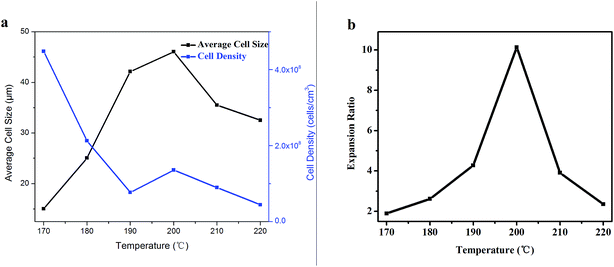
Fig. 6 shows average cell diameter, cell density and expansion ratio of PSU foams at different foaming temperatures. With the increase of temperature from 170 °C to 200 °C, the average cell size and expansion ratio showed an increasing trend after the first increase, while the cell density decreased slowly. As we all know, that the polymer viscosity and melt strength decreased with the temperature increasing is the main reason. Thus, the bubble growth resistance decreased with the temperature increasing, which would lead to a bigger cell diameter. During the bubble growth process, the big bubbles merged with each other caused by touching. And there would be bigger and fewer bubble because of the above merging, which means high expansion ratio. However, as the temperature further rose, the viscosity and melt strength of polymer continuously reduced, which will result the bubble easy to collapse, as shown in Fig. 5f. Thus, the expansion ratio, average cell size, and cell density became smaller, while cell wall became thicker.
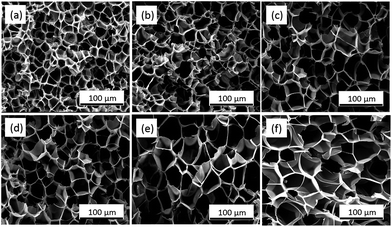 | ||
| Fig. 7 SEM pictures of PSU foams at different CO2 concentrations with foaming temperature (200 °C): (a) 1.8%, (b) 3.3%, (c) 4.4%, (d) 5.3%, (e) 7.0%, (f) 9.0%. | ||
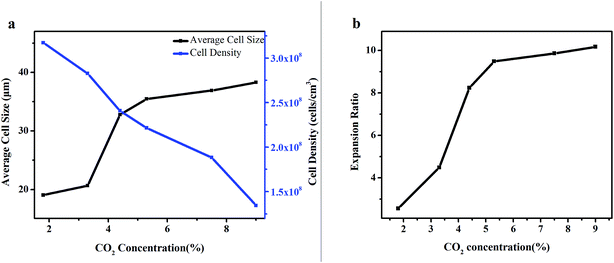
In addition, as shown in Fig. 8, with the increase of CO2 concentration, the cell density decreased gradually, while the average cell size and expansion ratio showed a rapid increasing tendency with the CO2 concentration from 1% to 5% and then kept stable with the CO2 concentration from 5% to 9%. This was in accordance with the viscosity of the polymer in Fig. 4. When the CO2 concentration was below 5%, the higher the CO2 concentrations, the more obvious plasticizing effect for polymer, so the average cell size and expansion ratio of polymer increased. However, when the CO2 concentration was above 5%, the viscosity of polymer remains stable, so the average cell size and expansion ratio also remained stable.
3.4. Macromorphology and properties
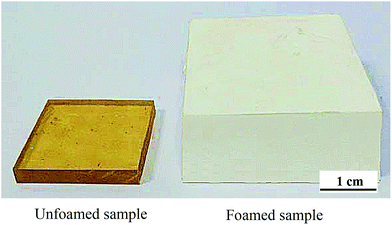
Compared with the unfoamed sample, there is a great change for foamed sample after foaming on the macromorphology. As shown in Fig. 9, it can be clearly found that unfoamed sample was amber-like and transparent, while the foamed sample looked white and volume increases greatly.Next, different kinds of properties of PSU foams were tested in the research, such as mechanical properties, thermal properties, and flame retardancy, as shown in Table 2. For mechanical properties of polymer foam, compression strength (P) and tensile strength (σ) were measured respectively. And thermal conductivity (λ), heat desorption temperature (HDT) and limit oxygen index (LOI) were tested to characterise the thermal properties and flame retardancy of the foam. Compared with general plastic foams, PSU foam in the study had lots of outstanding performance, such as mechanical properties at least an order of magnitude higher than that of other general plastic foams and heat distortion temperature up to 168 °C. Especially, the LOI of the PSU foam was 27.5%, means that it belonged to a flame retardant material. What's more, compared with other commercial special engineering plastic foams as shown in Table 2, the properties of PSU foam have been close to or even exceeded part properties of them.
| EPSa | Plastazote® HD110b | Airex® C70 PVCc | Airex® R82 PEIc | Rohacell® S PMId | PSU | |
|---|---|---|---|---|---|---|
| a Data come from product specification of EPS Industry Alliance, in America.b Data come from product specification of Zotefoams company, in England.c Data come from product specification of Airex company, in Switzerland.d Data come from product specification of Rohm company, in Germany. | ||||||
| ρ (kg m−3) | 16–64 | 110 | 100 | 110 | 110 | 110 |
| P (MPa) | 0.09–0.55 | 0.78 | 2.0 | 1.4 | 2.8 | 2.18 |
| σ (MPa) | 0.21–0.74 | 2.3 | 2.7 | 2.2 | 3.2 | 2.08 |
| HDT (°C) | 60–70 | 100 (ref. 28) | 120 | 190 | 200–220 | 168 |
| λ (W m−1 K−1) | 0.031–0.038 (ref. 29) | 0.037–0.042 (ref. 30) | 0.035 | 0.040 | 0.038 | 0.042 |
| LOI (%) | 18 (ref. 8) | 17.5 (ref. 31) | 30 | 35 | 29 | 27.5 |
4. Conclusions
High expansion ratio PSU foam has been prepared by using a new kind of PSU foaming method with scCO2 as foaming agent assisted mold pressing. There was a great reduction for the Tg by HP-DSC test and decrease for the viscosity by high pressure capillary test, which indicated that it is feasible for PSU to foam by supercritical CO2. In addition, the foaming process parameters were also obtained by CO2 adsorption test.PSU foams with various average cell sizes, cell densities, and expansion ratios have been attained by tailoring the foaming temperature and CO2 concentration individually. At the foaming temperature from 170 °C to 200 °C, average cell size and expansion ratio increased, while cell density decreased. After that, all were opposite with before as the temperature from 200 °C to 220 °C. Of course, there existed the best foaming temperature at 200 °C. When the CO2 concentration increased, average cell size and expansion ratio increased rapidly with CO2 concentration from 1% to 5% and then kept stable above 5%, while cell density gradually decreased during the CO2 concentration increasing.
Compared with general plastic foams, there were excellent mechanical properties for the PSU foam such as high compression strength and tensile strength, and there were also other excellent performances like high heat distortion temperature, good thermal conductivity and perfect flame retardancy. Moreover, the properties of PSU foam have been close to or even more than part properties of other commercial special engineering plastic foams. The results demonstrate that PSU foam in the study is promising to be used as a kind of substitute material in electric wire and cable industry, railway and steamer transportation, oil and gas platform, military and other fields.
Conflicts of interest
There are no conflicts to declare.Acknowledgements
This work was financially supported by National Natural Science Foundation of China (51573117, 51433006, 51721091), Science and technology support program of Sichuan Province (2015GZ0067) and State key laboratory polymer materials engineering (No. sklpme2016-3-01).References
- J. Miltz and G. Gruenbaum, Polym. Eng. Sci., 1981, 21, 1010–1014 CAS.
- T. Tanaka, T. Aoki, T. Kouya, M. Taniguchi, W. Ogawa, Y. Tanabe and D. R. Lloyd, Desalin. Water Treat., 2010, 17, 37–44 CrossRef.
- J. Miltz, O. Ramon and S. Mizrahi, J. Appl. Polym. Sci., 1989, 38, 281–290 CrossRef CAS.
- R. Williams and C. Aldao, Polym. Eng. Sci., 1983, 23, 293–298 CAS.
- D. Kajiya, M. Imanishi and K.-i. Saitow, J. Phys. Chem. B, 2016, 120, 785–792 CrossRef CAS PubMed.
- A. Cummings and S. P. Beadle, J. Sound Vib., 1994, 175, 115–133 CrossRef.
- X. C. Bian, J. H. Tang, Z. M. Li, Z. Y. Lu and A. Lu, J. Appl. Polym. Sci., 2007, 104, 3347–3355 CrossRef.
- G. Wang, X. Chen, P. Liu and S. Bai, J. Appl. Polym. Sci., 2016, 134 DOI:10.1002/app.44356.
- C. Okolieocha, T. Köppl, S. Kerling, F. J. Tölle, A. Fathi, R. Mülhaupt and V. Altstädt, J. Cell. Plast., 2015, 51, 413–426 CrossRef.
- H. Demir, M. Sipahioglu, D. Balkose and S. Ulku, J. Mater. Process. Technol., 2008, 195, 144–153 CrossRef.
- E. Mahmoudi, L. Y. Ng, M. M. Ba-Abbad and A. W. Mohammad, Chem. Eng. J., 2015, 277, 1–10 CrossRef CAS.
- S. Habibi, A. Nematollahzadeh and S. A. Mousavi, Chem. Eng. J., 2015, 267, 306–316 CrossRef CAS.
- S. Aktas, H. Gevgilili, D. Kalyon, I. Küçük and A. Sunol, Hum. Mol. Genet., 2013, 20, 3606–3619 Search PubMed.
- S. Pourmortazavi and S. Hajimirsadeghi, Ind. Eng. Chem. Res., 2005, 44, 6523–6533 CrossRef CAS.
- Z. Ma, G. Zhang, X. Shi, Q. Yang, J. Li, Y. Liu and X. Fan, J. Appl. Polym. Sci., 2015, 132 DOI:10.1002/app.42634.
- L. Sorrentino, M. Aurilia and S. Iannace, J. Appl. Polym. Sci., 2011, 122, 3701–3710 CrossRef CAS.
- H. Guo, A. Nicolae and V. Kumar, J. Polym. Sci., Part B: Polym. Phys., 2015, 53, 975–985 CrossRef CAS.
- M. Sauceau, J. Fages, A. Common, C. Nikitine and E. Rodier, Prog. Polym. Sci., 2011, 36, 749–766 CrossRef CAS.
- B. Krause, K. Diekmann, N. Van der Vegt and M. Wessling, Macromolecules, 2002, 35, 1738–1745 CrossRef CAS.
- H. Sun, J. E. Mark, S. C. Tan, N. Venkatasubramanian, M. D. Houtz, F. E. Arnold and C. Y. Lee, Polymer, 2005, 46, 6623–6632 CrossRef CAS.
- S. Kazarian, M. Vincent, F. Bright, C. Liotta and C. Eckert, J. Am. Chem. Soc., 1996, 118, 1729–1736 CrossRef CAS.
- D. Kajiya, M. Imanishi and K. I. Saitow, J. Phys. Chem. B, 2016, 120, 785 CrossRef CAS PubMed.
- M. A. Jacobs, M. F. Kemmere and J. T. F. Keurentjes, Polymer, 2004, 45, 7539–7547 CrossRef CAS.
- K. A. Arora, A. J. Lesser and T. J. McCarthy, Macromolecules, 1998, 31, 4614–4620 CrossRef CAS.
- X. Chen, J. J. Feng and C. A. Bertelo, Polym. Eng. Sci., 2006, 46, 97–107 CAS.
- P. Agarwal, R. Somani, W. Weng, A. Mehta, L. Yang, S. Ran, L. Liu and B. Hsiao, Macromolecules, 2003, 36, 5226–5235 CrossRef CAS.
- R. Alamo, M. Kim, M. Galante, J. Isasi and L. Mandelkern, Macromolecules, 1999, 32, 4050–4064 CrossRef CAS.
- C. P. Park, J. Cell. Plast., 2002, 38, 129–138 CrossRef CAS.
- J. Schellenberg and M. Wallis, J. Cell. Plast., 2010, 46, 209–222 CrossRef CAS.
- J. Martínez-Díez, M. Rodríguez-Pérez, J. De Saja, L. A. Y. Rábago and O. Almanza, J. Cell. Plast., 2001, 37, 21–42 CrossRef.
- Z. Wang, B. Qu, W. Fan and P. Huang, J. Appl. Polym. Sci., 2001, 81, 206–214 CrossRef CAS.
| This journal is © The Royal Society of Chemistry 2018 |


