 Open Access Article
Creative Commons Attribution 3.0 Unported Licence
Nonstoichiometric oxygen in Mn–Ga–O spinels: reduction features of the oxides and their catalytic activity
O. A. Bulavchenko *ab,
O. S. Venediktovaab,
T. N. Afonasenkoc,
P. G. Tsyrul'nikovc,
A. A. Saraev
 ab,
V. V. Kaichev
 ab and
S. V. Tsybulyaab
aBoreskov Institute of Catalysis SB RAS, Lavrentieva Ave. 5, Novosibirsk, 630090, Russia. E-mail: isizy@catalysis.ru
bNovosibirsk State University, Pirogova Str. 2, Novosibirsk, 630090, Russia
cInstitute of Hydrocarbons Processing SB RAS, Neftezavodskaya Str. 54, Omsk, 644040, Russia
First published on 27th March 2018
Abstract
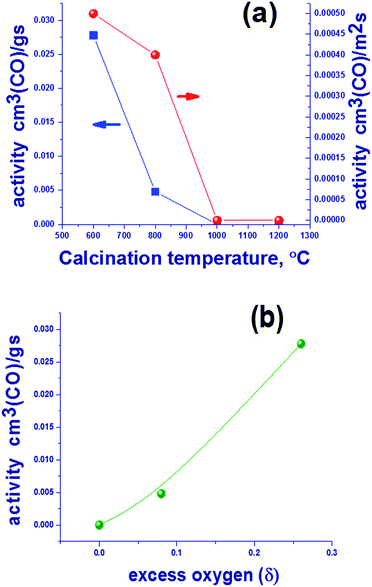
The subject of this study was the content of oxygen in mixed oxides with the spinel structure Mn1.7Ga1.3O4 that were synthesized by coprecipitation and thermal treatment in argon at 600–1200 °C. The study revealed the presence of excess oxygen in “low-temperature” oxides synthesized at 600–800 °C. The occurrence of superstoichiometric oxygen in the structure of Mn1.7Ga1.3O4+δ oxide indicates the formation of cationic vacancies, which shows up as a decreased lattice parameter in comparison with “high-temperature” oxides synthesized at 1000–1200 °C; the additional negative charge is compensated by an increased content of Mn3+ cations according to XPS. The low-temperature oxides containing excess oxygen show a higher catalytic activity in CO oxidation as compared to the high-temperature oxides, the reaction temperature was 275 °C. For oxides prepared at 600 and 800 °C, catalytic activity was 0.0278 and 0.0048 cm3 (CO) per g per s, and further increase in synthesis temperature leads to a drop in activity to zero. The process of oxygen loss by Mn1.7Ga1.3O4+δ was studied in detail by TPR, in situ XRD and XPS. It was found that the hydrogen reduction of Mn1.7Ga1.3O4+δ proceeds in two steps. In the first step, excess oxygen is removed, Mn1.7Ga1.3O4+δ → Mn1.7Ga1.3O4. In the second step, Mn3+ cations are reduced to Mn2+ in the spinel structure with a release of manganese oxide as a single crystal phase, Mn1.7Ga1.3O4 → Mn2Ga1O4 + MnO.
Introduction
The ability of manganese cations to change their oxidation state makes Mn-containing oxides efficient catalysts for various processes: oxidation of hydrocarbons, CO, and VOCs1–6 and the selective reduction of NOx with NH3.7Of special interest are Mn-containing oxides with a spinel structure that possess a high thermal stability and are able to intercalate additional cations. The catalytic properties of Mn-containing oxides were examined in different processes: Mn–Co oxides are promising for the oxidation of CO, propene,8 and benzyl alcohol,9 as materials for fuel cells and oxygen reduction/evolution electrocatalysts;10,11 Ga–Co–Mn can be employed for visible-light-driven water oxidation;12 Mn–Al spinels are precursors of the active component of catalysts for the oxidation of CO and hydrocarbons;13 Zn–Mn–Al oxides are used for the reduction of nitrobenzene to nitroazobenzene;14 and Mn–Fe as Fenton catalysts toward catalytic degradation of highly concentrated methylene blue.15
The spinel structure is described by a general formula AB2O4, where A is a divalent cation, and B is a trivalent one. In a normal spinel, divalent cations A are located in tetrahedral positions, and trivalent cations B located in octahedral positions; however, in some compounds a partial or complete inversion may take place: divalent cation A resides in the octahedral position, while trivalent B in the tetrahedral one. Nonstoichiometry of the metal/oxygen ratio is commonly implemented in the spinel structure via the cationic vacancies with preservation of the closest oxygen packing, A1−x1B2−x2[]yO4; in this case, the chemical formula can be written as AB2O4+δ, hence it follows that the structure includes superstoichiometric (excess) oxygen, which under certain conditions can pass to the gas phase and become reactive.
A relation between oxygen nonstoichiometry in Mn-containing oxides with the spinel structure and their catalytic properties was investigated only in several works. In particular it was shown that the Mn3+ cation in Zn1−xMnxAl2O4+δ (0 < x < 1) is the active site for reduction of nitrobenzene,16 which may occur only in the case of partial inversion of spinel and appearance of cationic vacancies.14 For Mn–Co oxides, the activity in the oxidation of benzyl alcohol depends on the concentration of trivalent cations and, accordingly, on the oxygen content in the exposed planes and in the sub-layer.9
In this connection, it seems important to examine the effect of oxygen nonstoichiometry on the catalytic properties in oxidation reactions. On Mn-containing oxides, oxidation reactions are known to proceed through the Mars–van Krevelen mechanism,9 according to which in the first step lattice oxygen oxidizes the substrate which is accompanied by generation of an oxygen vacancy, and in the second step the reduced catalyst is reoxidized by gas-phase molecular oxygen. To investigate the effect of oxygen nonstoichiometry in Mn-containing oxides on the catalytic properties, we placed the manganese cation in the redox inert matrix of gallium oxide, which is able to form spinel structures. The oxidation of CO served as a model reaction. Previously, we investigated the conditions of formation of Mn–Ga oxides in a wide range of Mn/Ga cation ratio from 2 to 0.5 and calcination temperatures 600–1200 °C.17 This paper considers in detail the redox properties of Mn–Ga oxides with the spinel structure and the reduction of Mn cations in spinel by in situ XRD, XPS, and TPR, as well as the effect of excess oxygen on the activity in the oxidation of CO.
Experimental
Preparation
The calculated amount of Ga(NO3)3 and Mn(NO3)2 aqueous solutions was poured into a round-bottom flask. Precipitation was carried out under stirring with a gradual addition of a 5 M NH4OH solution to bring the pH of the solution to 9. A mechanical stirrer rotated at 450 rpm. After a subsequent aging at 60 °C for 2 h, the precipitate was filtered, washed with distilled water on a filter to pH 6, and dried at 120 °C for 2 h.The samples with Mn![[thin space (1/6-em)]](https://www.rsc.org/images/entities/char_2009.gif) :
:![[thin space (1/6-em)]](https://www.rsc.org/images/entities/char_2009.gif) Ga = 1.7
Ga = 1.7![[thin space (1/6-em)]](https://www.rsc.org/images/entities/char_2009.gif) :
:![[thin space (1/6-em)]](https://www.rsc.org/images/entities/char_2009.gif) 1.3 were calcined in an inert argon medium at 600, 800, 1000, and 1200 °C. Calcination was performed with a gas flow rate of 50–60 mL min−1 for 4 h. This was followed by cooling in the inert medium at a rate of 10 mL min−1 until reaching the room temperature. A series of samples with Mn
1.3 were calcined in an inert argon medium at 600, 800, 1000, and 1200 °C. Calcination was performed with a gas flow rate of 50–60 mL min−1 for 4 h. This was followed by cooling in the inert medium at a rate of 10 mL min−1 until reaching the room temperature. A series of samples with Mn![[thin space (1/6-em)]](https://www.rsc.org/images/entities/char_2009.gif) :
:![[thin space (1/6-em)]](https://www.rsc.org/images/entities/char_2009.gif) Ga = 1.7
Ga = 1.7![[thin space (1/6-em)]](https://www.rsc.org/images/entities/char_2009.gif) :
:![[thin space (1/6-em)]](https://www.rsc.org/images/entities/char_2009.gif) 1.3 was chosen for further studies as the X-ray nearly single-phase for all temperatures.17
1.3 was chosen for further studies as the X-ray nearly single-phase for all temperatures.17
Simple oxides Mn2O3 and Mn3O4 were synthesized from Mn(NO3)2 by calcination at 650 and 1200 °C in air for 4 h.
XRD
Powder X-ray diffraction was carried out using a Bruker D8 Advance Diffractometer (Germany) with the CuKα radiation (λ = 1.5418 Å) in the θ/2θ geometry. The diffractometer was equipped with a LynxEye linear semiconductor detector. A nickel filter was used to eliminate the CuKβ component. A 2θ range from 15 to 80° was scanned using a step of 0.05° and a counting time of 2 s at each point.The diffraction data were interpreted using software programs and databases. In particular, the phase composition was determined with the use of PDF-4+ powder diffraction database.18 Sizes of coherent scattering region (CSR) were calculated by the Scherrer formula using 311 reflection of spinel.19
In situ XRD
In situ X-ray diffraction study was carried out under hydrogen reduction conditions on a D8 Advance diffractometer equipped with a reaction chamber XRK-900 (Anton Paar, Austria). The hydrogen flow rate was 40 mL min−1; and heating rate, 10° min−1.XPS
X-ray photoelectron spectroscopy was applied for the chemical analysis of the catalysts after reduction in hydrogen. XPS studies were performed on an X-ray photoelectron spectrometer (SPECS Surface Nano Analysis GmbH, Germany) equipped with a XR-50M X-ray source with a twin Al/Ag anode, a FOCUS-500 X-ray monochromator, a PHOIBOS-150 hemispherical electron energy analyzer, and a high-pressure cell. The core-level spectra were obtained using the monochromatic AlKα radiation (hν = 1486.74 eV) under ultrahigh vacuum conditions. Charge correction was performed by setting the Ga 2p3/2 peak at 1117.9 eV. Relative element concentrations were determined from the integral intensities of XPS peaks using the cross-sections according to Scofield. For a detailed analysis, the spectra were fitted into several peaks after the background subtraction by the Shirley method. The fitting procedure was performed using the CasaXPS software.20 The line shapes were approximated by the multiplication of Gaussian and Lorentzian functions.The Mn–Ga sample synthesized at 600 °C was treated in the high-pressure cell by the following procedure. Loading of the sample, evacuation to ultrahigh vacuum (10−7 mbar), and admission of a gas (hydrogen, oxygen or argon, ∼1000 Torr, cell volume ∼ 0.2 L); heating to a specified temperature for 10 min and treatment at this temperature for 30 min; evacuation of the cell and cooling to room temperature in a vacuum; recording of XP spectra.
Catalytic tests
Catalytic tests were performed in a flow regime in a glass reactor 170 mm in length and 10 mm in diameter. The initial gas mixture composition was 1% CO, 2% O2, 8% N2, and He the rest. For changing the CO conversion, the flow rate of the gas mixture was varied in the range of 200–570 mL min−1. The oxidation of CO was carried out at 275 °C. The reactant mixture before and after the reactor was analyzed by a chromatograph equipped with a packed column (zeolite CaA, 3 m) and a thermal conductivity detector.Catalytic activity was calculated from the CO conversion at different flow rates, taking into account the mass of the catalyst, according to the formula:
| W(CO) = [C0 − Ccur] × V/(60 × mcat), [cm3 (CO) per g per s] |
| Ccur = C0 × (1 − (P0 − Pcur/P0)), |
To compare the samples, their activities must be extrapolated to the same conversion of CO (in our case, 50% conversion):
| W(CO)50% = 0.5 × W/Cavcur, |
| Cavcur = (C0 + Ccur)/2, (%) |
Before the catalytic tests, the samples were mixed with a γ-Al2O3 binder (inactive under the used conditions) in a weight ratio of 1![[thin space (1/6-em)]](https://www.rsc.org/images/entities/char_2009.gif) :
:![[thin space (1/6-em)]](https://www.rsc.org/images/entities/char_2009.gif) 1, pelletized and fractionated. The tests were performed with the fraction 0.8–1.4 mm. Effect of mixing with Al2O3 was taken into account during the calculations of catalytic activity.
1, pelletized and fractionated. The tests were performed with the fraction 0.8–1.4 mm. Effect of mixing with Al2O3 was taken into account during the calculations of catalytic activity.
TPR
The temperature-programmed reduction in hydrogen (TPR-H2) was performed with 100 mg of a sample in a quartz reactor using a flow setup equipped with a thermal conductivity detector. The reducing mixture (10 vol% of H2 in Ar) was fed at 40 mL min−1. The rate of heating from room temperature to 900 °C was approximately 10 °C min−1.TG
The experiments were made on a STA 409 PC Luxx (Netzsch) derivatograph. Concentrations of the gas mixture components were measured using a QMS-200 mass spectrometer. Samples were heated to 1000 °C at a rate of 10 °C min−1. Argon flow rate was 70 mL min−1.Results and discussion
State of the initial samples
![[thin space (1/6-em)]](https://www.rsc.org/images/entities/char_2009.gif) :
:![[thin space (1/6-em)]](https://www.rsc.org/images/entities/char_2009.gif) Ga ratio 1.7
Ga ratio 1.7![[thin space (1/6-em)]](https://www.rsc.org/images/entities/char_2009.gif) :
:![[thin space (1/6-em)]](https://www.rsc.org/images/entities/char_2009.gif) 1.3 synthesized at 600–1200 °C in argon corresponds mainly to the Mn3−xGaxO4 spinel phase [JCPDS no. 38-0181]. Lattice parameters and average CSR sizes are listed in Table 1. One can see that CSR and lattice parameters of spinel increase with temperature. The origin of differences in the lattice parameters was discussed in details in our previous work17 and is related to the presence of excess oxygen.
1.3 synthesized at 600–1200 °C in argon corresponds mainly to the Mn3−xGaxO4 spinel phase [JCPDS no. 38-0181]. Lattice parameters and average CSR sizes are listed in Table 1. One can see that CSR and lattice parameters of spinel increase with temperature. The origin of differences in the lattice parameters was discussed in details in our previous work17 and is related to the presence of excess oxygen.
| Calcination temperature of oxide, °C | Lattice parameter of Mn1.7Ga1.3O4, Å | CSR, Å | Weight loss, % | Estimated oxygen excess δ in Mn1.7Ga1.3O4+δ |
|---|---|---|---|---|
| 600 | 8.413(4) | 100 | 1.65 | 0.26 |
| 800 | 8.462(1) | 350 | 0.5 | 0.08 |
| 1000 | 8.481(1) | 650 | 0 | 0.00 |
| 1200 | 8.478(1) | >1000 | 0 | 0.00 |
Table 1 lists weight losses of Mn1.7Ga1.3O4 600–1200 °C samples upon heating in an argon flow from 25 to 1000 °C. As the calcination temperature is raised, weight losses decrease from 1.65% for the oxide synthesized at 600 °C to 0% for 1200 °C. The oxygen content in spinel was estimated under the assumption that weight losses are related to the loss of excess oxygen in comparison with the stoichiometric ratio M![[thin space (1/6-em)]](https://www.rsc.org/images/entities/char_2009.gif) :
:![[thin space (1/6-em)]](https://www.rsc.org/images/entities/char_2009.gif) O = 3
O = 3![[thin space (1/6-em)]](https://www.rsc.org/images/entities/char_2009.gif) :
:![[thin space (1/6-em)]](https://www.rsc.org/images/entities/char_2009.gif) 4, where M is Ga or Mn. Such oxygen is weakly bound and can readily pass into the gas phase when the temperature is increased and/or the oxygen partial pressure is decreased. According to these data, the content of excess oxygen decreases with increasing the treatment temperature.
4, where M is Ga or Mn. Such oxygen is weakly bound and can readily pass into the gas phase when the temperature is increased and/or the oxygen partial pressure is decreased. According to these data, the content of excess oxygen decreases with increasing the treatment temperature.
According to XRD date upon heating to 1000 °C in argon, the spinel structure is retained, but the lattice parameter increases from 8.413(4) to 8.460(1) Å, which can be attributed to the observed oxygen losses.17
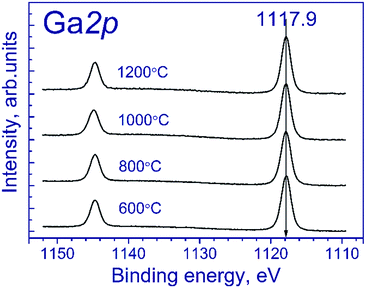
Fig. 1 shows the Ga 2p spectra of the tested samples. The Ga 2p spectrum is represented by the Ga 2p3/2–Ga 2p1/2 spin-orbital doublet, and the integral intensity ratio of its lines is 2![[thin space (1/6-em)]](https://www.rsc.org/images/entities/char_2009.gif) :
:![[thin space (1/6-em)]](https://www.rsc.org/images/entities/char_2009.gif) 1. The Ga 2p3/2 spectra of the tested samples are described by a single symmetric peak with the binding energy in the region of 1117.9 eV. According to the literature,21–23 position of the peak corresponds to gallium in the Ga3+ state. The state of manganese is commonly identified using the Mn 2p3/2 binding energy: according to the literature,24–37 manganese in MnO, Mn2O3 and MnO2 oxides is characterized by the Mn 2p3/2 binding energy in the range of 640.4–641.7, 641.5–641.9, and 642.2–642.6 eV, respectively. As seen from the indicated data, Mn2+ and Mn3+ compounds have close binding energies of Mn 2p3/2, which complicate their identification.
1. The Ga 2p3/2 spectra of the tested samples are described by a single symmetric peak with the binding energy in the region of 1117.9 eV. According to the literature,21–23 position of the peak corresponds to gallium in the Ga3+ state. The state of manganese is commonly identified using the Mn 2p3/2 binding energy: according to the literature,24–37 manganese in MnO, Mn2O3 and MnO2 oxides is characterized by the Mn 2p3/2 binding energy in the range of 640.4–641.7, 641.5–641.9, and 642.2–642.6 eV, respectively. As seen from the indicated data, Mn2+ and Mn3+ compounds have close binding energies of Mn 2p3/2, which complicate their identification.
To identify correctly the manganese state, it is necessary to take into account also the shape of Mn 2p spectrum, specifically, the intensity and relative position of shake-up satellites, the presence of which is determined by multielectron processes.26,28,38 To estimate parameters of the Mn 2p spectra deconvolution into individual components, we recorded the spectra of reference compounds Mn3O4, Mn2O3, and MnO2, which contain manganese in the Mn2+, Mn3+ and Mn4+ states, respectively.
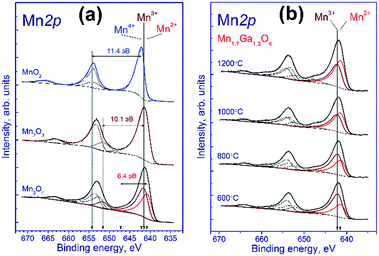
Fig. 2a shows the Mn 2p spectra of manganese oxides. It is known that the Mn 2p spectrum is represented by the Mn 2p3/2–Mn 2p1/2 spin-orbital doublet whose integral intensity ratio is 2![[thin space (1/6-em)]](https://www.rsc.org/images/entities/char_2009.gif) :
:![[thin space (1/6-em)]](https://www.rsc.org/images/entities/char_2009.gif) 1 and spin-orbital splitting (the difference between binding energies of Mn 2p1/2 and Mn 2p3/2) is 11.8 eV. The Mn 2p spectrum of Mn2O3 comprises the Mn 2p3/2–Mn 2p1/2 doublet and the corresponding shake-up satellites; the binding energy of Mn 2p3/2 is 641.5 eV, and the difference in binding energy between the Mn 2p3/2 peak and the corresponding shake-up satellite is 10.1 eV. A similar pattern is observed for MnO2, the binding energy being equal to 642.2 eV, and the difference in binding energy between the Mn 2p3/2 peak and its shake-up satellite, 11.4 eV.
1 and spin-orbital splitting (the difference between binding energies of Mn 2p1/2 and Mn 2p3/2) is 11.8 eV. The Mn 2p spectrum of Mn2O3 comprises the Mn 2p3/2–Mn 2p1/2 doublet and the corresponding shake-up satellites; the binding energy of Mn 2p3/2 is 641.5 eV, and the difference in binding energy between the Mn 2p3/2 peak and the corresponding shake-up satellite is 10.1 eV. A similar pattern is observed for MnO2, the binding energy being equal to 642.2 eV, and the difference in binding energy between the Mn 2p3/2 peak and its shake-up satellite, 11.4 eV.
 | ||
| Fig. 2 Mn 2p spectra of the studied samples. The spectra were normalized to the integral intensity of the corresponding Ga 2p spectra. | ||
The Mn3O4 compound comprises both the Mn2+ and Mn3+ cations; therewith, the fraction of Mn2+ constitutes 33%, and that of Mn3+, 67%. The fitting of the Mn 2p spectrum revealed that in the synthesized Mn3O4 compound the fraction of Mn2+ constitutes 40%, and Mn3+, 60%, which is close to the stoichiometric composition. The Mn 2p3/2 binding energy of the Mn2+ state is 640.8 eV, and the difference in binding energy between the Mn 2p3/2 peak and the corresponding shake-up satellite, 6.4 eV. As was noted above, fitting parameters obtained for the model manganese compounds were used to identify the states of manganese in the tested Mn–Ga systems.
Fig. 2b shows the Mn 2p spectra of mixed Mn–Ga oxides treated in argon at different temperatures. The Mn 2p spectra are described by two Mn 2p3/2–Mn 2p1/2 doublets assigned to manganese in the Mn2+ and Mn3+ states, and by the corresponding shake-up satellites located at a distance of 6.4 and 10.1 eV from the main peaks. It should be noted that the Mn 2p spectra of the tested samples have no peaks located at a distance of 11.4 eV from the main peak, which is typical of the shake-up satellite of manganese in the Mn4+ state. In other words, manganese in the systems under consideration is in two states, Mn2+ and Mn3+. The Mn 2p3/2 peak assigned to manganese in the Mn2+ state lays at 641.5–641.6 eV, and that of manganese in the Mn3+ state, at 642.2–642.3 eV. Therewith, the indicated binding energies are higher than those observed for model manganese compounds Mn3O4 and Mn2O3 (640.8 eV for Mn2+ and 641.5 eV for Mn3+). A likely cause of the revealed differences is that manganese resides in the structure of mixed oxide whose local environment differs from the environment in simple oxide, and this produces the observed increase in the Mn 2p3/2 binding energy.
The relative concentrations (atomic ratios) of elements in the subsurface layer of the samples estimated by XPS and the Mn 2p3/2 binding energies are listed in Table 2. For the samples synthesized at 600–1000 °C, the [Mn]/[Ga] atomic ratio was 1.36–1.39, which is close to the stoichiometric composition 1.31, whereas for the sample treated at 1200 °C, a much higher atomic ratio, 1.87, was observed. Hence, an increase in the calcination temperature is accompanied by surface enrichment with manganese cations. For the low-temperature oxides treated at 600–800 °C, 67–60% of manganese cations in the 3+ state are observed, while for the high-temperature oxides this value is somewhat lower, ∼50%. For a compound with the composition Mn1.7Ga1.3O4, according to electroneutrality balance, Mn3+ should constitute 41%, and Mn2+ 59%; however, all the tested samples have a greater Mn3+ amount. Such behavior can be attributed to the oxidation on the manganese surface; but the presence of excess oxygen in the low-temperature oxides, as revealed by TG and XRD, should be taken into account as well.
| Sample | [Mn]/[Ga] | Mn 2p3/2 | |||||
|---|---|---|---|---|---|---|---|
| Total | [Mn2+]/[Ga] | [Mn3+]/[Ga] | Mn2+ | Mn3+ | 2+, % | 3+, % | |
| 600 °C | 1.37 | 0.45 | 0.91 | 641.6 | 642.2 | 33 | 67 |
| 800 °C | 1.36 | 0.55 | 0.82 | 641.5 | 642.2 | 40 | 60 |
| 1000 °C | 1.39 | 0.69 | 0.70 | 641.6 | 642.3 | 50 | 50 |
| 1200 °C | 1.87 | 0.97 | 0.91 | 641.5 | 642.3 | 52 | 48 |
Since the spinel structure has the closest oxygen packing, the presence of additional oxygen should indicate the occurrence of defects – cationic vacancies. This suggests that an increase in the synthesis temperature results in a loss of excess oxygen, which decreases the number of cationic vacancies. Oxygen losses may be related not only to the oxidized surface (according to XPS) but also to the bulk structure, because an increase in the lattice parameters is observed (Table 1). Further studies are focused on the reduction of Mn–Ga and are aimed to reveal changes in the bulk and on the surface of the system during a loss of excess oxygen.
Investigation of the hydrogen reduction of Mn1.7Ga1.3O4 spinel
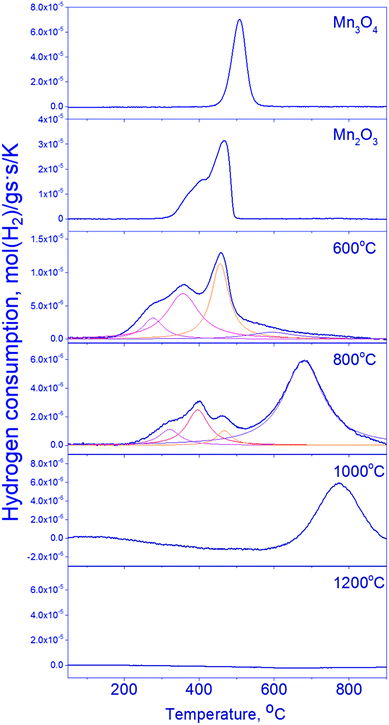
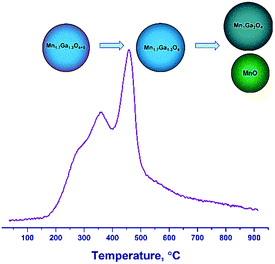
The reduction of mixed Mn–Ga oxides differs essentially from the reduction of simple oxides. Low-temperature peaks at 280–470 °C and high-temperature peaks at 600–770 °C are observed on the TPR curves. Hydrogen absorption in two temperature ranges is typical of the samples synthesized at 600–800 °C. Therewith, the Mn1.7Ga1.3O4-800 °C sample has a pronounced hydrogen absorption peak at 680 °C; absorption in the region of 500–700 °C without a distinct maximum is observed on the curve of Mn1.7Ga1.3O4-600 °C. The TPR profile of the oxide treated at 1000 °C has only the high-temperature peak at 770 °C. Hydrogen absorption is not observed in Mn1.7Ga1.3O4-1200 °C; probably, it is reduced at higher temperatures (>900 °C).
For Mn1.7Ga1.3O4 compounds calcined at 600 and 800 °C, it can be supposed that TPR maxima in the low-temperature region correspond to the removal of weakly bound oxygen. Similar low-temperature TPR peaks were observed upon reduction of MnFe2O4, which was synthesized by the sol–gel method with subsequent calcination at 400–600 °C in air. The TPR curve had three peaks, which were assigned to the following reduction sequence: MnFe2O4 → MnFe2O4−δ → MnO–FeO-solid solution → α-Fe.41
The higher is the calcination temperature, the stronger is the shift of hydrogen absorption peaks toward high temperatures, which produces a decrease in the total amount of absorbed hydrogen (Table 3).
| Sample | Tmax | Amount of absorbed hydrogen, mmol g−1 | Total hydrogen absorption, mmol g−1 |
|---|---|---|---|
| 600 °C | 280 | 0.33 | 3.45 |
| 355 | 1.09 | ||
| 455 | 1.04 | ||
| 600 | 0.99 | ||
| 800 °C | 320 | 0.15 | 2.07 |
| 400 | 0.29 | ||
| 470 | 0.09 | ||
| 680 | 1.57 | ||
| 1000 °C | 770 | 0.93 | 0.93 |
The high-temperature TPR maximum at 600–800 °C obviously corresponds to the reduction of manganese cations to the Mn2+ state. Whether the reduction proceeds in the bulk of spinel or is accompanied by the release of MnO as a single phase – this question will be elucidated by means of in situ XRD and XPS.
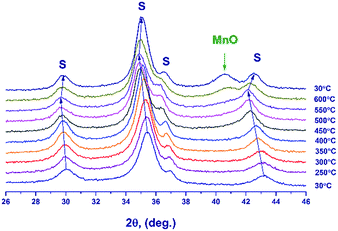
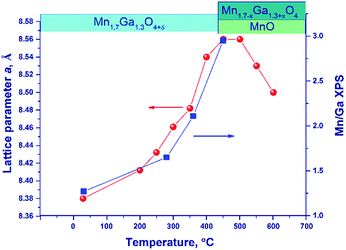
Fig. 6 illustrates the temperature dependence of the spinel lattice parameters upon reduction. The lattice parameter increases from 8.413 to 8.560 Å in the range from 30 to 450 °C and then drops to 8.501 Å. The decrease in the lattice parameter is accompanied by the formation of the MnO phase.
For comparison purposes, Fig. 6 shows also the [Mn]/[Ga] atomic ratio on the surface as revealed by XPS, which will be discussed below.
An additional experiment was carried out to exclude the effect of thermal expansion: after heating in a hydrogen flow to 450 °C (until the MnO phase is formed) and to 600 °C, the lattice parameter was measured at room temperature.
In the temperature range of 25–450 °C, the unit cell parameter of spinel increases from 8.413(4) to 8.492(2) Å. The observed increase in the lattice parameter cannot be related to segregation of Mn cations on the surface (the XPS data are presented below) because an increase in the relative content of Ga3+ in the spinel bulk should decrease the lattice parameter. Thus, the observed change in the lattice parameter correlates with the loss of excess oxygen (the low-temperature TPR peak, Fig. 4). Nevertheless, noteworthy is the fact that the lattice parameter of spinel at 450 °C (8.492(2) Å) exceeds the parameters of the high-temperature oxides under consideration, 8.481(1)–8.478(1) Å (1000 and 1200 °C), although the indicated samples do not contain excess oxygen (according to the TG and TPR data). This may be related to rearrangements in the spinel structure and charge state of manganese cations.
At 600 °C the lattice parameter decreases to 8.454 Å, which is accompanied by the emergence of the MnO phase. The spinel parameter after reduction at 600 °C is close to the value indicated for Mn1Ga2O4, 8.451 Å [JCPDS no. 38-0181]. A decrease in the lattice parameter during the reduction at 500–600 °C is associated with the release of manganese cations from the solid solution to the MnO phase and with the increase in the relative Ga content in spinel. Accordingly, it can be expected that at 600 °C manganese cations are completely reduced to Mn2+ with the formation of MnGa2O4 and MnO phases.
Thus, the reduction is accompanied by changes in the lattice parameter, which testify to structural rearrangements caused by the removal of excess oxygen and the release of manganese cations with the formation of MnO oxide.
| Treatment (temperature and medium) | [Mn]/[Ga] | [O*]/[Mn] | [O*]/[Ga] | [O*]/[Mn] + [Ga] | ||
|---|---|---|---|---|---|---|
| Total | [Mn2+]/[Ga] | [Mn3+]/[Ga] | ||||
| a [O*] – oxygen in the structure of mixed oxide. | ||||||
| Treatment in Ar | ||||||
| Fresh | 1.37 | 0.45 | 0.91 | 2.45 | 3.35 | 1.4 |
| 200 °C-Ar | 1.48 | 0.73 | 0.75 | 2.3 | 3.4 | 1.4 |
| 400 °C-Ar | 1.54 | 0.96 | 0.58 | 1.9 | 2.9 | 1.2 |
![[thin space (1/6-em)]](https://www.rsc.org/images/entities/char_2009.gif) |
||||||
| Treatment in H2 | ||||||
| 280 °C-H2 | 1.81 | 1.04 | 0.77 | 2.31 | 4.17 | 1.5 |
| 360 °C-H2 | 2.33 | 1.00 | 1.33 | 1.39 | 3.23 | 0.97 |
| 450 °C-H2 | 3.26 | 1.22 | 2.04 | 1.24 | 4.03 | 0.95 |
| Treatment (temperature and medium) | Mn 2p3/2 | Ga 2p3/2 | O 1s | |||
|---|---|---|---|---|---|---|
| Mn2+ | Mn3+ | Mn2+, % | Mn3+, % | |||
| Treatment in Ar | ||||||
| Fresh | 641.6 | 642.2 | 33 | 67 | 1117.9 | 530.6 |
| 200 °C-Ar | 641.0 | 642.2 | 49 | 51 | 1117.9 | 530.6 |
| 400 °C-Ar | 640.9 | 642.3 | 62 | 38 | 1117.9 | 530.6 |
![[thin space (1/6-em)]](https://www.rsc.org/images/entities/char_2009.gif) |
||||||
| Treatment in H2 | ||||||
| 280 °C-H2 | 641.1 | 642.2 | 58 | 42 | 1117.9 | 530.6 |
| 360 °C-H2 | 641.1 | 641.8 | 43 | 57 | 1117.9 | 530.6 |
| 450 °C-H2 | 641.1 | 641.8 | 37 | 63 | 1117.9 | 530.3 |
As for the initial samples, the Ga 2p spectra of Mn–Ga oxide (600 °C) recorded after treatment in argon and reduction in hydrogen are described by one symmetric peak at 1117.9 eV (spectra not shown), which corresponds to Ga3+.19–21 This peak was used for calibration of the binding energy scale.
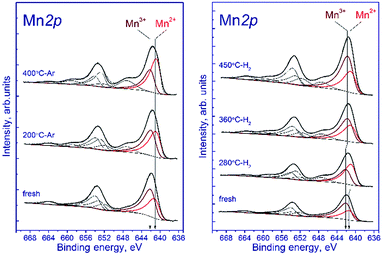
Fig. 7a shows the Mn 2p spectra of the tested sample that were recorded after the treatment in argon. According to deconvolution of the Mn 2p spectra of the sample into individual components, manganese is in two states, Mn2+ and Mn3+. As the treatment temperature is raised, the Mn 2p3/2 peak attributed to manganese in the Mn2+ state shifts from 641.5 to 640.9 eV. A possible reason is the formation of the manganese-containing particles on the sample surface in which the chemical environment of manganese is close to that in MnO. The Mn 2p3/2 peak assigned to manganese in the Mn3+ state lays at 642.2–642.3 eV indicating that Mn3+ cations reside in the structure of a mixed Mn–Ga oxide.
 | ||
| Fig. 7 Mn 2p spectra of the studied samples. The spectra were normalized to the integral intensity of the corresponding Ga 2p spectra. | ||
Relative concentrations (atomic ratios) of elements in the subsurface layer, which were estimated by XPS, are listed in Table 5. The treatment in argon decreases the oxygen content: the [O]/[Mn] atomic ratio droppes from 2.45 to 1.9. Simultaneously, the [Mn]/[Ga] atomic ratio increases from 1.3 to 1.5, which indicates that manganese is segregated as MnO on the surface of mixed oxide. This is evidenced also by an increase in the fraction of Mn2+ from 33% to 62%. On the surface, the [Mn2+]/[Ga] ratio increases from 0.48 to 0.96, while [Mn3+]/[Ga] decreases from 0.91 to 0.58 (Table 4). Surface enrichment with manganese is also observed for the initial sample calcined at 1200 °C, in comparison with other samples of this series (Table 2). The [O]/[Mn + Ga] ratio decreases from 1.4 to 1.2, which agrees with the weight losses and the removal of excess oxygen revealed by TGA.
Fig. 7b shows the Mn 2p spectra of the tested sample that were recorded after its reduction in hydrogen. The shape of the Mn 2p spectra indicates that manganese is in two states, Mn2+ and Mn3+. The presence of manganese in the Mn4+ state is not observed. Similar to the treatment in argon, the treatment in hydrogen at 280 °C leads to the shift of the Mn 2p3/2 peak attributed to Mn2+ from 641.6 to 641.0 eV; this fact testifies to the formation of the manganese-containing particles on the catalyst surface in which the chemical environment of manganese is close to that in MnO. The Mn 2p3/2 peak assigned to Mn3+ also shifts from 642.3 to 641.8 eV; however, the observed effect takes place at 360 °C, which may indicate the formation of individual particles containing manganese in the Mn3+ state (probably Mn2O3). In both cases, the decrease in the Mn 2p3/2 binding energy is accompanied by an abrupt increase in the [Mn2+]/[Ga] and [Mn3+]/[Ga] atomic ratios.
The surface content of Mn2+ increases from 33% to 58% upon reduction in hydrogen at 280 °C and then decreases to 43% (360 °C) and 37% (450 °C) when the temperature is raised. The decrease in the relative content of Mn2+ on the surface during the hydrogen reduction seems unusual, because the process occurs in a reducing atmosphere and should be accompanied by a decrease in the oxidation state of manganese cations, as in the case of treatment in argon. However, the reduction is accompanied by segregation of manganese cations on the surface; therewith, the [Mn2+]/[Ga] atomic ratio gradually increases from 0.45 to 1.22 upon heating in hydrogen from 25 to 450 °C. The [Mn3+]/[Ga] atomic ratio changes abruptly during the reduction: it decreases from 0.92 to 0.77 upon heating from 25 to 280 °C, then sharply increases to 1.3 at 360 °C, and reaches 2.0 at 450 °C.
Upon reduction of the sample in hydrogen at different temperatures, the [Mn]/[Ga] atomic ratios increase from 1.4 to 3.3, and the [Mn2+]/[Ga] and [Mn3+]/[Ga] atomic ratios also increase, indicating the segregation of manganese on the surface. This fact is also supported by a decrease in the [O]/[Mn + Ga] atomic ratio (Table 4). Fig. 6 sums up data on the [Mn]/[Ga] atomic ratio in the subsurface layer as compared to the bulk characteristic – the lattice parameter of spinel in dependence on temperature; a correlation between the XRD and XPS data is seen.
Hence, the XPS data demonstrate that the treatment in argon or in hydrogen produces changes in the surface composition: manganese cations Mn2+ segregate, and the [O]/[Mn + Ga] atomic ratio decreases. It means that the removal of excess oxygen is accompanied not only by structural rearrangement but also by surface modification. At the same time, changes in the Mn2+/Mn3+ surface ratio that occur in the hydrogen atmosphere seem unusual: an increase in the concentration of Mn3+ and a decrease in Mn2+; however, they allow proposing a scheme of the initial step of reduction.
Therefore, the hydrogen reduction of Mn–Ga oxides with the spinel structure in the temperature range of 30–900 °C can be presented as follows. For the samples synthesized at 600–800 °C, a two-step reduction of the oxide is observed, which is indicated by changes in the lattice parameter and by the TPR data. According to TG and TPR, the initial samples contain a certain amount of excess oxygen, Mn1.7Ga1.3O4+δ, as compared to the stoichiometric content. In the first step, excess oxygen is removed, which is accompanied by an increase in the lattice parameter. The increase in the lattice parameter correlates with changes in the surface composition (the enrichment with manganese cations) revealed by XPS. In the second step, the Mn3+ cations are reduced to Mn2+, and manganese cations pass from the spinel structure to the MnO phase, thus changing the spinel composition from Mn1.7Ga1.3O4 to MnGa2O4 (Fig. 8).
For the high-temperature samples synthesized by calcination at 1000–1200 °C in argon, a single-step reduction of the oxide is observed. Initially, Mn cations are formally in the oxidation states Mn2+ (1.0) and Mn3+ (0.7) according to the formula Mn12+Mn0.73+Ga1.33+O4; as a result of reduction, all Mn3+ cations turn into Mn2+. Probably, redistribution of Mn and Ga cations over tetrahedral and octahedral positions, respectively, with the formation of Mn1Ga2O4 spinel and the release of the MnO phase, becomes favorable.
Conclusions
A series of Mn1.7Ga1.3O4 mixed oxides synthesized by coprecipitation with subsequent calcination in argon at 600–1200 °C has been studied. TG and TPR studies revealed the presence of excess oxygen in the samples synthesized at 600–800 °C. The loss of oxygen upon heating in argon (according to TG) and the presence of low-temperature peaks of hydrogen absorption (according to TPR) are observed for such oxides. An increase in the synthesis temperature to 1000–1200 °C results in the formation of mixed oxides not containing superstoichiometric oxygen. A correlation was found between the content of excess oxygen in the Mn–Ga oxides and their catalytic activity in the oxidation of CO.The process of hydrogen reduction of the Mn–Ga oxides with the spinel structure has been studied. For the samples synthesized at 600–800 °C, a two-step reduction of the oxide is observed. According to TPR and in situ XRD studies, excess oxygen is removed in the first step. An increase in the lattice parameter correlates with changes in the surface composition revealed by XPS, which indicates that changes in the bulk of the oxide modify the sample surface. The removal of excess oxygen upon reduction (which shows up as an increase in the lattice parameter) is accompanied by surface enrichment with manganese cations. In the second step, Mn3+ cations are reduced to Mn2+ in the spinel structure with the release of the MnO phase.
Conflicts of interest
There are no conflicts to declare.Acknowledgements
This work was conducted within the framework of the budget project # AAAA-A17-117041710079-8 for Boreskov Institute of Catalysis. The authors thank V. A. Rogov for TPR-H2 measurements.Notes and references
- M. C. Álvarez-Galván, V. A. De La Peña O'Shea, J. L. G. Fierro and P. L. Arias, Catal. Commun., 2003, 4, 223 CrossRef.
- C. Lahousse, A. Bernier, P. Grange, B. Delmon, P. Papaefthimiou, T. Ioannides and X. Verykios, J. Catal., 1998, 178, 214 CrossRef CAS.
- J. M. Gallardo-Amores, T. Armaroli, G. Ramis, E. Finocchio and G. Busca, Appl. Catal., B, 1999, 22, 249 CrossRef CAS.
- J. I. Gutiérrez-Ortiz, B. de Rivas, R. López-Fonseca, S. Martín and J. R. González-Velasco, Chemosphere, 2007, 68, 1004 CrossRef PubMed.
- R. Craciun, B. Nentwick, K. Hadjiivanov and H. Knözinger, Appl. Catal., A, 2003, 243, 67 CrossRef CAS.
- H. Xu, N. Yan, Z. Qu, W. Liu, J. Mei, W. Huang and S. Zhao, Environ. Sci. Technol., 2017, 51, 8879 CrossRef CAS PubMed.
- F. Kapteijn, L. Singoredjo, A. Andreini and J. A. Moulijn, Appl. Catal., B, 1994, 3, 173 CrossRef CAS.
- B. Faure and P. Alphonse, Appl. Catal., B, 2015, 180, 715 CrossRef.
- L. Yao, L. Zhang, Y. Liu, L. Tian, J. Xu, T. Liu, D. Liu and C. Wang, CrystEngComm, 2016, 18, 8887 RSC.
- F. Cheng, J. Shen, B. Peng, Y. Pan, Z. Tao and J. Chen, Nat. Chem., 2011, 3, 79 CrossRef CAS PubMed.
- M. Mahmoud, T. A. Gad-Allah, K. M. El-Khatib and F. El-Gohary, Bioresour. Technol., 2011, 102, 10459 CrossRef CAS PubMed.
- F. Conrad, M. Bauer, D. Sheptyakov, S. Weyeneth, D. Jaeger, K. Hametner, P. E. Car, J. Patscheider, D. Günther and G. R. Patzke, RSC Adv., 2012, 2, 3076 RSC.
- O. A. Bulavchenko, T. N. Afonasenko, P. G. Tsyrul'nikov and S. V. Tsybulya, Appl. Catal., A, 2013, 459, 73 CrossRef CAS.
- J. Ziółkowski, A. M. Maltha, H. Kist, E. J. Grootendorst, H. J. M. De Groot and V. Ponec, J. Catal., 1996, 160, 148 CrossRef.
- M. Li, Q. Gao, T. Wang, Y. S. Gong, B. Han, K. S. Xia and C. G. Zhou, Mater. Des., 2016, 97, 341 CrossRef CAS.
- A. Maltha, H. F. Kist, B. Brunet, J. Ziolkowski, H. Onishi, Y. Iwasawa and V. Ponec, J. Catal., 1994, 149, 356 CrossRef CAS.
- O. S. Venediktova, O. A. Bulavchenko, T. N. Afonasenko, P. G. Tsyrul'nikov, Z. S. Vinokurov and Y. A. Chesalov, et al., J. Alloys Compd., 2017, 725, 496 CrossRef CAS.
- ICDD, PDF-4+ Database, ed. S. Kabekkodu, International Centre for Diffraction Data, Newtown Square, PA, USA, 2012 Search PubMed.
- P. Scherre, Math. Phys. Kl, 1918, 98 Search PubMed.
- N. Fairley, http://www.casaxps.com.
- H. Fan, G. Wang and L. Hu, Solid State Sci., 2009, 11, 2065 CrossRef CAS.
- K. Bao, L. Wang, J. Yan, H. Sun, R. Guo and Y. Wu, J. Alloys Compd., 2013, 552, 26 CrossRef CAS.
- L. Qin, C. Xue, Y. Duan and L. Shi, Phys. B, 2009, 404, 190 CrossRef CAS.
- E. Regan, T. Groutso, J. B. Metson, R. Steiner, B. Ammundsen, D. Hassell and P. Pickering, Surf. Interface Anal., 1999, 1064 CrossRef CAS.
- M. Oku, K. Hirokawa and S. Ikeda, J. Electron Spectrosc. Relat. Phenom., 1975, 7, 465 CrossRef CAS.
- V. D. Castro and G. Polzonetti, J. Electron Spectrosc. Relat. Phenom., 1989, 48, 117 CrossRef.
- J. F. Bondi, K. D. Oyler, X. Ke, P. Schiffer and R. E. Schaak, J. Am. Chem. Soc., 2008, 131, 9144 CrossRef PubMed.
- Y.-F. Han, F. Chen, Z. Zhong, K. Ramesh, L. Chen and E. Widjaja, J. Phys. Chem. B, 2006, 110, 24450 CrossRef CAS PubMed.
- Y.-F. Han, L. Chen, K. Ramesh, Z. Zhong, F. Chen, J. Chin and H. Mook, Catal. Today, 2008, 131, 35 CrossRef CAS.
- X. Yang, X. Wang, G. Zhang, J. Zheng, T. Wang, X. Liu, C. Shu, L. Jiang and C. Wang, Int. J. Hydrogen Energy, 2012, 37, 11167 CrossRef CAS.
- K. Ramesh, L. Chen, F. Chen, Y. Liu, Z. Wang and Y.-F. Han, Catal. Today, 2008, 131, 477 CrossRef CAS.
- Y. Liu, J. Li, W. Li, Y. Li, Q. Chen and F. Zhan, J. Power Sources, 2015, 299, 492 CrossRef CAS.
- W. Kong, B. Gao, C. Jiang and A. Chang, J. Alloys Compd., 2015, 650, 305 CrossRef CAS.
- L. Zhang, Z. Tang, S. Wang, D. Ding, M. Chen and H. Wan, Surf. Sci., 2012, 606, 1507 CrossRef CAS.
- P. R. Jadhav, M. P. Suryawanshi, D. S. Dalavi, D. S. Patil, E. A. Jo, S. S. Kolekar, A. A. Wali, M. M. Karanjkar, J.-H. Kim and P. S. Patil, Electrochim. Acta, 2015, 176, 523 CrossRef CAS.
- M. A. Kostowskyj, D. W. Kirk and S. J. Thorpe, Int. J. Hydrogen Energy, 2010, 35, 5666 CrossRef CAS.
- T. Hishida, K. Ohbayashi and T. Saitoh, J. Appl. Phys., 2013, 113, 043710 CrossRef.
- X. Feng and D. F. Cox, Surf. Sci., 2016, 645, 23 CrossRef CAS.
- E. R. Stobbe, B. A. De Boer and J. W. Geus, Catal. Today, 1999, 47(1–4), 161–167 CrossRef CAS.
- L. Christel, A. Pierre and D. A. M. R. Abel, Thermochim. Acta, 1997, 306, 51 CrossRef CAS.
- L. Zhang and Y. Wu, J. Nanomater., 2013, 2013, 640940 Search PubMed.
| This journal is © The Royal Society of Chemistry 2018 |

