
 Open Access Article
 This Open Access Article is licensed under a
 Creative Commons Attribution 3.0 Unported Licence
Detection of mercury ions in water using a membrane-based colorimetric sensor
N. A. Azmi,
S. H. Ahmad and
S. C. Low *
*
School of Chemical Engineering, Engineering Campus, Universiti Sains Malaysia, Seri Ampangan, 14300 Nibong Tebal S.P.S. Penang, Malaysia. E-mail: chsclow@usm.my; siewchun@gmail.com; Fax: +60 4 599 6908; Tel: +60 4 599 6412
First published on 2nd January 2018
Abstract
A basic requirement of colorimetric sensors is that they must allow the analyte to access the chromophores. This study elucidates the fundamental sensitivity of membrane morphology (membrane pore sizes between 0.32 and 1.30 μm) and its influence on the loading of chromophores (dithizone, DTZ, in present work), to detect mercury (Hg2+) at concentrations ranging from 3 ppm to 10 ppm. The flat sheet cellulose acetate (CA) membrane acts as the platform for dithizone loading through non-covalent hydrogen bonding of DTZ to the CA membrane. The membranes were prepared by using different polymer-dissolving solvents (formic acid and acetic acid) with the addition of water as the non-solvent to improve the membrane porosity. A significant positive correlation between the membrane porosity and the sensor's sensitivity was observed through the visible color changes of the colorimetric membrane strip from green (color intensity at R-axis of 70) to magenta (color intensity at R-axis of 187) when it was in contact with 3 ppm Hg2+ solution. A colorimetric strip allowing naked eye detection at 3 ppm Hg2+ was achieved. This work demonstrates that the physical and chemical characteristics of a membrane are important factors that determine the performance and sensitivity of a colorimetric sensor.
1. Introduction
Mercury and its derivatives are toxic metals that are highly soluble in water, contributing towards the contamination of ecosystems. Indeed, excessive concentrations of mercury are detrimental, as this metal tends to accumulate in biological organisms,1–3 and in turn, all living organisms along the food chain of a given ecosystem become contaminated.4–6 Aside from natural activities, industrial processes involved in mining and petrochemicals, or other human activities such as the use of fungicidal sprays, household bleach, acid and caustic chemicals, also have the potential to release mercury.7,8Concern over the distinct toxicity of mercury has stimulated research aimed at developing cost-effective, rapid and facile methods to monitor mercury in different industrial and food samples, including, but not limited to, chemical precipitation, adsorptive membranes,9 spectrophotometry10,11 and chemical sensors. Chemical sensors can further be classified into two main types: electrochemical sensors12–15 and optical sensors. A potentiometric sensor is an example of an electrochemical sensor, which relies on the measurement of the electrical potential difference between two electrodes and converts this into a measurable signal. Meanwhile, an optical sensor converts a chemical/biological reaction into a light or a color signal. Among these methods, optical sensors (colorimetric16–19 and fluorescence20–24 sensors) appear to offer the simplest technique to determine the presence of target analytes in a testing solution, because of the capacity for naked-eye recognition and short detection time. Indeed, the sensor output signal gives measurable color changes without any spectroscopic instrumentation25 upon reaction of a target analyte with the optical indicator ligand that is immobilized on the membrane substrate.26–28
The optical indicator diphenylthiocarbazone, also known as dithizone, is a type of chromogenic reagent that serves as a selective and optical transducer for colorimetric sensors.29–31 It contains azo and hydrosulfide groups, which are able to perform as good ligands on the membrane platform.27,32 For example, Zargoosh and Babadi33 developed an optical sensor by covalently immobilizing dithizone onto an agarose membrane for direct detection of Pb2+ ions in industrial waste and environmental samples without any pre-concentration step. The absorbance differences obtained in their research show the feasibility of using dithizone as an optical indicator for fast metal ion detection. Furthermore, Momidi et al.34 proposed the idea of colorimetric chemosensors developed from thiocarbohydrazide derivatives, shedding light on the possibility of selective detection of heavy metal ions in aqueous medium. In their study,34 receptor moieties comprising hydroxy groups (–OH), thiocarbonyl groups (–C![[double bond, length as m-dash]](https://www.rsc.org/images/entities/char_e001.gif) S–) and imine groups (CN) serve as the binding sites for cation detection. For example, the binding of Hg2+ ions to the receptor leads to a visible color change from colorless to yellow and from colorless to pale pink for Cd2+ ions. However, the data collection relies on UV-visible spectroscopic titration experiments and Benesi–Hildebrand (B–H) plots, which require trained personnel and infrastructure. This finding would be more interesting if there was no need for sophisticated devices to observe the color changes.
S–) and imine groups (CN) serve as the binding sites for cation detection. For example, the binding of Hg2+ ions to the receptor leads to a visible color change from colorless to yellow and from colorless to pale pink for Cd2+ ions. However, the data collection relies on UV-visible spectroscopic titration experiments and Benesi–Hildebrand (B–H) plots, which require trained personnel and infrastructure. This finding would be more interesting if there was no need for sophisticated devices to observe the color changes.
The dithizone ligand is able to form colored complexes with metal ions, where the response of the color change is dependent on the types of the metal ions that react. Our previous work focused on the conceptual study of a dithizone-colorimetric sensor and its binding mechanism with a cellulose acetate (CA) membrane, which was used as the immobilization and detection platform.35 Various metal ions including Hg2+, Cu2+ and Zn2+ were tested. The study confirmed the feasibility of applying a porous CA membrane as the solid detection platform, and its sensitive binding interactions with dithizone demonstrated its practical applications for on-site quick detection of heavy metals. The prepared dithizone-CA colorimetric sensor exhibited quick detection (within 1 min) and was found to be capable of displaying distinctive color changes in response to the presence of Hg2+, Cu2+ and Zn2+ ions in the testing samples.
Indeed, the effectiveness of a colorimetric sensor is also influenced by the choice of substrate (platform). The most frequently used inorganic substrates, such as glass and silica gel, are dimensionally stable (resistant to swelling). Unfortunately, these inorganic substrates have the disadvantage of limited surface area and porosity.36 On the other hand, organic polymer substrates, such as polyvinylidene difluoride (PVDF)37,38 and cellulose derivatives,39 are commonly used in colorimetric sensors because they offer high mechanical strength, and good thermal and chemical stability. Moreover, they are commercially available with several types of microstructure. Therefore, membrane-based sensors with organic polymer substrates have been extensively explored in recent years. The immobilization capacity of a transducer membrane to bind the optical indicator ligand ultimately determines the feasibility and performance of a sensor.40
A polymeric membrane is often used as the porous substrate to hold the optical indicator ligand. Indeed, the porosity of a membrane is critical for the rapid exposure of the chromophores to the testing solutions that contain potential analytes. An effective sensor can be achieved with high-porosity membranes that serve as nano- or micro-structured supports.41 Unfortunately, the majority of immobilization strategies for optical indicator ligands have involved conventional practices, which focus on immobilizing procedures and/or binding interactions of the optical indicator ligand to the substrate used for immobilization. Indeed, in-depth studies of the substrate/membrane used to immobilize chromophores, in terms of the membrane material and pore structure, are also essential. Varying the membrane morphologies will affect the immobilization mechanisms, which will further determine the binding sensitivity of a colorimetric sensor.27,42
A basic requirement of all colorimetric sensors is to allow the analyte access to the chromophores. This study elucidates the fundamental sensitivity of the membrane morphology and its influence on the loading of chromophores (dithizone in the present work) to detect Hg2+. The first part of the research was focused on the membrane synthesis by manipulating the membrane pore structures with various polymer-dissolving solvents (formic acid and acetic acid) and non-solvent (deionized water, DI). Then, the membrane–dithizone interactions and the dithizone loading capacity, based on different membrane pore structures, were evaluated in terms of the chemistry interaction properties and the physical morphology of the membrane. The sensitivity of the sensor was determined by the naked-eye detection of Hg2+ at different concentrations in aqueous media and by quantitatively analyzing the membrane dot color intensity using color definition data of RGB triplet color space.
2. Experimental
2.1. Materials
Cellulose acetate (CA) polymer (with an acetyl content of 40%) and acetic acid (ACS reagent ≥ 99.7%) were supplied by Sigma-Aldrich (St. Louis, MO). Formic acid (98–100%), ethanol, diphenylthiocarbazone (dithizone, DTZ) and mercury(II) nitrate monohydrate, were supplied by Merck (Darmstadt, Germany). All chemicals used were of analytical grade and used without further purification.2.2. Membrane preparation
Different microstructures of the membrane platforms were prepared by dissolving a specific concentration of CA polymer in formic acid (FA) and acetic acid (AA) solvent, as per the membrane dope formulations tabulated in Table 1. The method is essentially the same as that given in our previous paper35,43 with some adjustments. First, the polymer dopes were stirred at 250 rpm for 4 hours to ensure the complete dissolution of polymer and then the mixture was degassed to remove air bubbles. Subsequently, the casting dope was cast onto a glass plate with a 500 μm clearance gap of the casting blade. The cast-film was then immersed in a distilled water coagulation bath overnight. Then, the solidified membrane was removed from the coagulation bath and immersed in ethanol solution for 4 hours. Lastly, the prepared membrane was air-dried and stored in a sealed plastic bag prior to further use for characterization, functionalization or performance tests.| Membrane id | Casting dope composition (wt%) | |||
|---|---|---|---|---|
| CA | AA | FA | DI (non-solvent) | |
| CA-AA | 17.0 | 83.0 | 0.0 | 0.0 |
| CA-FA | 17.0 | 0.0 | 83.0 | 0.0 |
| CA-FA:30DI | 17.0 | 0.0 | 58.1 | 24.9 |
| CA-FA:40DI | 17.0 | 0.0 | 49.8 | 33.2 |
The surfaces and cross-sectional morphologies of the membranes were observed using a scanning electron microscope (Hitachi TM3000, Tokyo, Japan) at an accelerating voltage of 5 kV. For cross-sectional analysis, the membranes were fractured using liquid nitrogen. All samples were coated with a layer of platinum (Pt) to prevent surface charge. As for the chemical properties of the membrane, the presence of functional groups with affinity to bind with dithizone was analyzed using a Thermo Scientific FTIR spectroscopy system (NICOLET iS10, USA). Each spectrum was obtained from 32 scans at a 45° incident angle using a diamond crystal over the wavenumber range of 1800–1100 cm−1.
2.3. Immobilization of dithizone (DTZ) on the membrane surface
The flat sheet CA membrane was cut into 5 mm × 40 mm strips, which were used for dithizone immobilization by immersion in 100 ppm DTZ solution in ethanol for 20 min. Subsequently, the wet membrane was removed and allowed to air dry for 2 hours. The successfully DTZ-coated membrane changed from opaque white to dark green, indicating the successful immobilization of dithizone on the CA membrane surface. The sensor strips were then ready to be used for the trace analysis of mercury ions.2.4. Trace analysis of mercury using DTZ-membrane optical sensor
The qualitative and quantitative responses of the DTZ-coated membrane sensors were studied by dipping the sensor strips in 4 mL of Hg2+ solutions (ranging from 3 ppm to 10 ppm) for 16 hours to ensure complete color change in response to the presence of Hg2+ ions. The qualitative assessment of the color change for the membrane strips was performed with the naked eye and the membrane color image was quantitatively converted to the RGB triplet color space. RGB triplet color space is color definition data in which red, green and blue colors are added together in a specific color space to reproduce a broad array of colors. Color images of the membrane sensors (5 mm × 40 mm) before and after testing with Hg2+ ions were taken using a digital camera. The photo images were divided into 18 portions (4.5 mm × 2.5 mm) in which the hue saturation value (HSV) and RGB color space of the sensor strips were processed by color assessment software (imagecolorpicker.com). The 3-dimensional RGB values from the 18 portions of a single image were then analyzed in a 3D scatter plot (red, green and blue color space representing the z-, x- and y-axes), by using an online analytics and data visualization tool, Plotly (Montreal, Quebec, Canada).3. Results and discussion
The efficacy of a colorimetric sensor relies upon the binding interactions between the optical indicator ligand (dithizone, DTZ in present work) and the immobilizing platform (cellulose acetate, CA, membrane) to push the detection ability of the sensor to the lowest possible concentration. Hence, the key structural features of the CA polymer and the formed membranes were verified by ATR-FTIR (Fig. 1) prior to being used as the porous substrate to immobilize DTZ. In Fig. 1, a strong peak observed at around 1735 cm−1 was attributed to the CO stretching vibration of the overlapped ester-carbonyl (acetyl) groups that are connected to the ring structure of the CA polymer. CO is believed to be responsible for binding with DTZ through exposure to the partial negative charge on the carbonyl oxygen atom where the electrons are delocalized between the two oxygen atoms. This will be displayed in more detail later in Fig. 2.
 | ||
| Fig. 1 ATR-FTIR spectra of (a) CA polymer, (b) CA-AA membrane and (c) CA-FA membrane. | ||
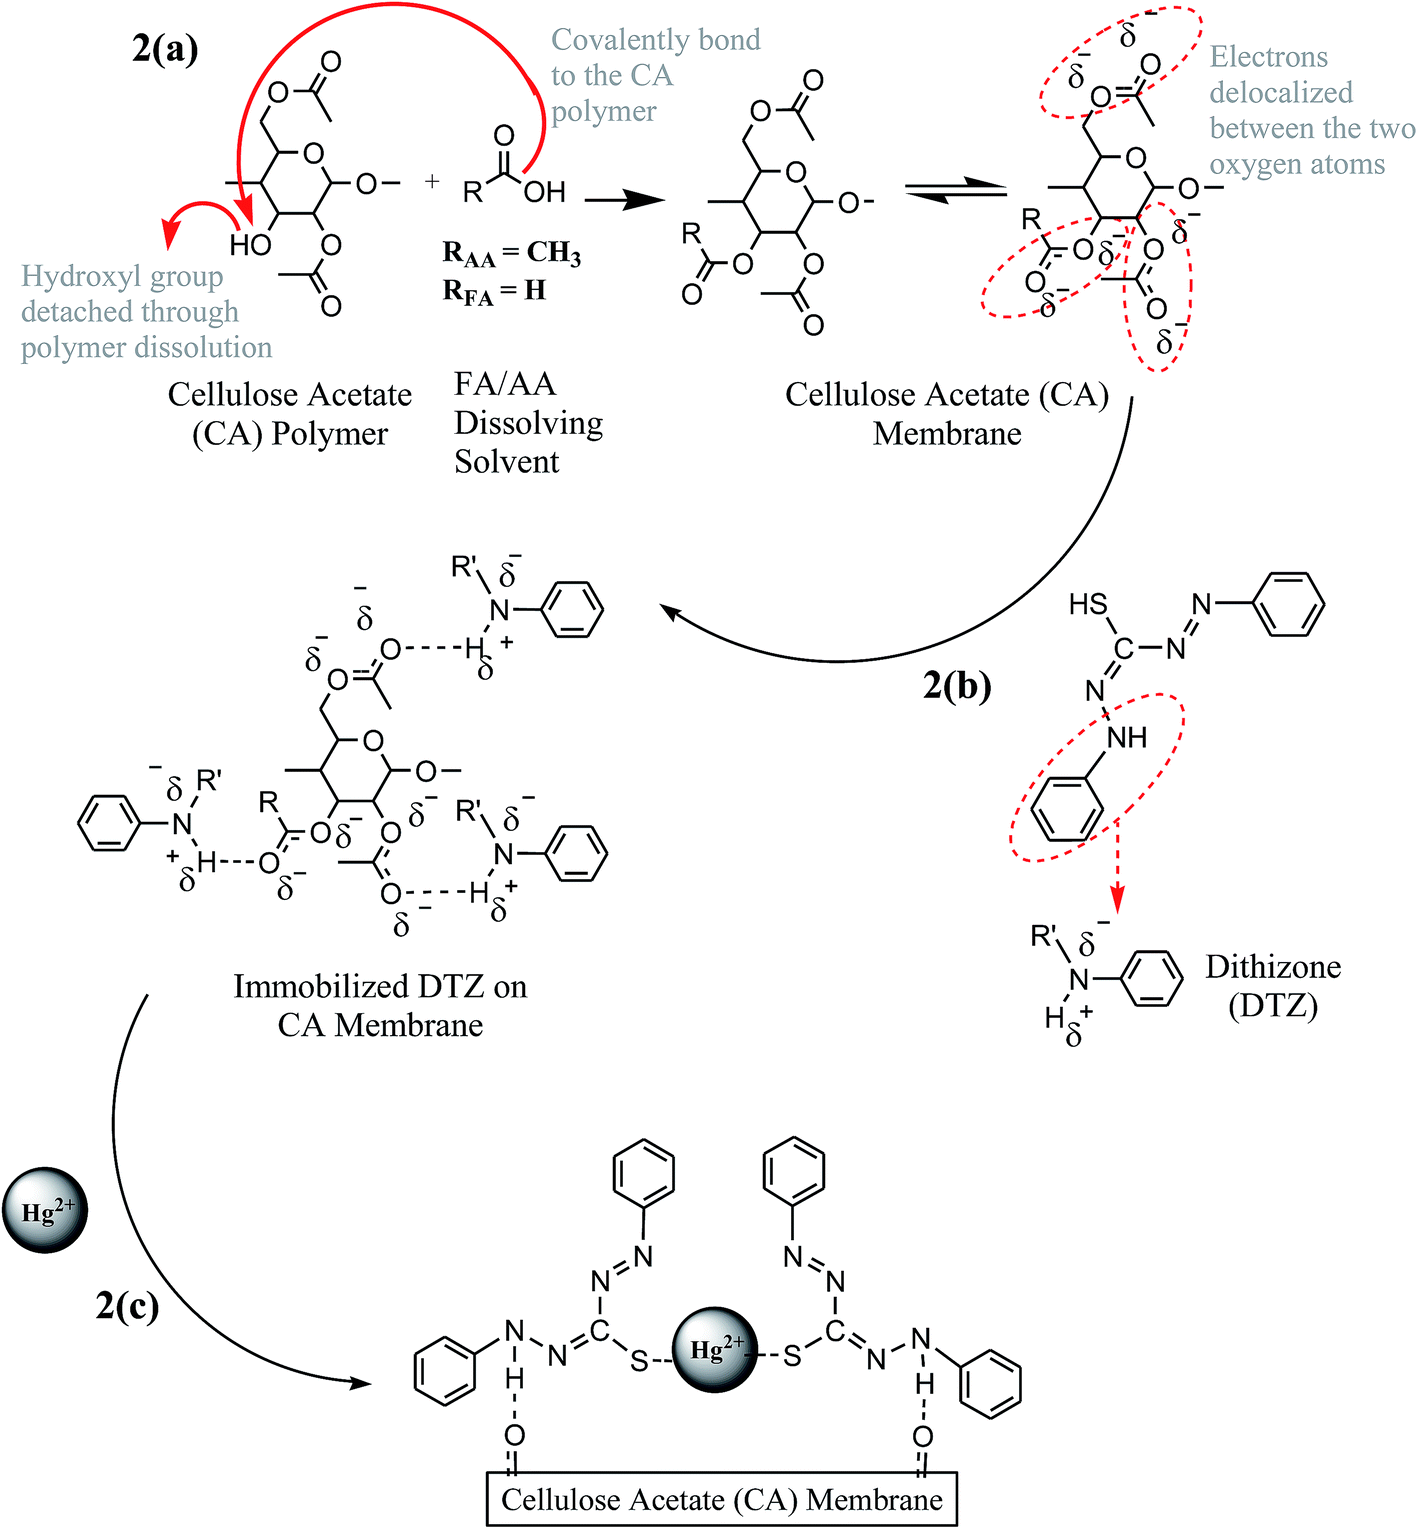 | ||
| Fig. 2 Schematic representation of (a) CA membrane formation, (b) DTZ interaction with CA membrane and (c) Hg2+–DTZ complex. | ||
Interestingly, an increase in the peak intensity of CO was observed after membrane formation. This increase in peak intensity may be due to the interactions between the FA/AA dissolving solvent and the CA polymer during membrane formation,16 which is schematically explained in Fig. 2a. On average, the area under the CO peak of the CA-FA membrane (17.74) was found to be slightly higher than that of the CA-AA membrane (15.67) and the CA polymer (10.61), with the peak somewhat shifted from 1735 cm−1 to 1730 cm−1. It is believed that, during hydrolysis, the hydroxyl group connected to the polymer ring structure of CA was broken through polymer dissolution, eventually leaving the central carbon atom to be electropositively charged. Subsequently, the deprotonated carboxyl group from AA or FA solvent was covalently bonded to the carbon atom of the CA polymer (Fig. 2a). Therefore, the peak intensities of CO increased after the membrane formation (Fig. 1).
Similarly, a strong C–O–C stretching peak of ether groups was found at 1230 cm−1 (Fig. 1). At this identified peak, the C–O–C peaks of the CA-AA and CA-FA membranes were obviously stronger than those of the CA polymer, mainly due to dissolution of solvent during the membrane formation, as discussed above. The CA-AA and CA-FA membranes possess higher areas under the peaks (25.06 and 22.47, respectively) than the CA polymer (17.37), due to the covalent interaction between a –COOR group from the FA/AA solvent and the CA polymer. In this study, the strong carbonyl group of CO with a partially negative charge (Fig. 2a) has a higher electron affinity to attract the partially positive DTZ (Fig. 2b) as compared to the C–O–C ether group. Therefore, it is believed that the carbonyl group acts as the main binding site for DTZ loading. Thus, the latter discussions are focused on the CO functional group of the membrane.
From Fig. 2a, it is fundamental to note that the reaction between the FA/AA solvent and the CA polymer consequently leads to an extra functional peak of CO and this additional functional group is used for DTZ immobilization (Fig. 2b). In addition, the CA membrane is hydrophilic in nature and has a good wettability to polar solvents. This fact has further strengthened our confidence regarding the presence of the more CO polar bond, and chemisorption of DTZ in polar solvent (ethanol) can be easily achieved. Interactions between DTZ and the CA membrane are schematically sketched in Fig. 2b. In this study, DTZ worked as an active optical ligand adsorbed onto the membrane surface for heavy metal detection.
In order to immobilize dithizone onto the CA membrane, a pair of hydrogen-bond donor and acceptor groups need to be recognized. In dithizone, the electronegative nitrogen atom to which the hydrogen atom is bonded strips electron density from the hydrogen atom (Nδ−⋯Hδ+), which leads to a partial positive charge on the hydrogen atom. In this case, the partially negative nitrogen from dithizone acts as a hydrogen-bond donor. On the other hand, it was expected that the CO ester-carbonyl (acetyl) group from the CA membrane will become partially negative when the electrons are delocalized between two oxygen atoms (Fig. 2a). Delocalization of the electron pairs is possible since these oxygen atoms possess the same number of unpaired electrons. This partially negative oxygen atom of the carbonyl group acts as a hydrogen-bond acceptor to interact with DTZ. As a possible mechanism, the partially positive hydrogen atom (–NH group) of DTZ is electrostatically attracted to the partially negative oxygen atom (carbonyl group, CO) of CA (Fig. 2b). The H+ is partially transferred from –NH (hydrogen-bond donor) to the carbonyl oxygen atom (hydrogen-bond acceptor). This non-covalent hydrogen bonding of DTZ to the CA membrane eventually creates a stable binding between the CA polymer and DTZ, which is particularly crucial for an effective membrane sensor to form the Hg2+–DTZ complex (Fig. 2c) during the detection of mercury in aqueous solution.
From the above discussion, it is very likely that the CA-FA membrane will be in a good position for DTZ immobilization with its stronger CO peaks, as evidenced in Fig. 1. However, successful DTZ immobilization does not merely depend on the chemical properties, but is also affected by the physical microstructure of the membrane. In this work, the produced CA-AA and CA-FA membranes were assembled into colorimetric sensors to detect Hg2+ in the concentration range of 3–10 ppm, and the results are depicted in Fig. 3. During the sensor assembly, the neat membranes were first immersed in DTZ solution until the membrane strips changed from opaque white (Fig. 3b) to dark green (Fig. 3c). The retained green color on the membrane strips after several washing steps reaffirmed the successful immobilization of DTZ on the membrane surfaces, which were then ready to be used to detect Hg2+.
 | ||
| Fig. 3 (a) SEM surface morphology of the CA membranes. (b) Opaque white color of CA membranes. (c) Dithizone (DTZ) immobilized on CA membrane strip or the control membrane. (d) Performances of DTZ-colorimetric sensors at different Hg2+ concentrations (3, 5 and 10 ppm). | ||
Upon immersion of the sensor strips in aqueous Hg2+ at 3 ppm, a portion of the membrane strip started to change from green to orange for both the CA-AA-DTZ and CA-FA-DTZ membranes. The color change was due to the formation of the Hg2+–DTZ complex in solution as described in Fig. 2c. The Hg2+–DTZ complex, with a Hg2+![[thin space (1/6-em)]](https://www.rsc.org/images/entities/char_2009.gif) :DTZ ratio of 1:2, was formed through the binding sites of DTZ at nitrogen or sulfur atoms.44–46 Apparently, two DTZ atoms are required to form a complexation reaction with Hg2+ ions:
:DTZ ratio of 1:2, was formed through the binding sites of DTZ at nitrogen or sulfur atoms.44–46 Apparently, two DTZ atoms are required to form a complexation reaction with Hg2+ ions:
| H2DTZ + CA membrane = (HDTZ) − CA | (1) |
| Hg2+ + 2(HDTZ)–CA = Hg2+(DTZ–CA)2 + 2H+ | (2) |
The hydrogen-bond donors in dithizone (H2DTZ) are nitrogen and sulfur atoms (Fig. 2b). In present work, the –NH group of DTZ is involved in a hydrogen bonding interaction with the CO group of the CA membrane (eqn (1)), leaving the sulfur atom available to bind with Hg2+ ions (eqn (2)). During hydrolysis in Hg2+ solution, the hydrogen atom from the –SH group leaves the sulfur atom with one free valence electron. In order to form a stable Hg2+–DTZ complex, two sulfur atoms of the DTZ molecule are required (Fig. 2c), thus contributing to the DTZ:Hg2+ ratio of 2:1, as described in eqn (2). Theoretically, the sulfur group has a higher tendency to interact with Hg2+ ions due to its strong thiophilic properties.47 According to the Hard and Soft Acids and Bases (HSAB) theory, a soft acid will combine with a soft base and vice versa. Since mercury (Hg2+) is a soft acid, it prefers to ligate through the sulfur atom rather than the nitrogen atom.
In this work, the analysis of dot color intensity (RGB triplet value) was used to confirm the extent of the color changes on the membrane sensor. Visual evaluation of the colors was carried out by comparing the dot color intensity of the tested sensors with their control membranes (membrane sensor before testing with the Hg2+ solution). The results are depicted in Fig. 3d. An overlapped color intensity plot was obtained for the CA-AA-DTZ membranes before and after testing with 3 ppm of Hg2+ solution (left 3D scattered plot in Fig. 3d). These overlapped RGB values indicate the insignificant color changes or low efficiency of the CA-AA-DTZ sensor when it was used to detect a low concentration (3 ppm) of the Hg2+ solution. The membrane sensor only showed a weak color change from green to greenish-orange. In contrast, the CA-FA-DTZ sensor demonstrated a non-overlapping data plot (right 3D scattered plot in Fig. 3d), even when it was used to detect Hg2+ at low concentration (3 ppm). A more precise data distribution (lower standard deviation) was found, implying better color change performance with homogeneous color distributions on the surface of the membrane strips.
The correlation between Hg2+ concentration and the effectiveness of the optical sensors (the extent of the color change) was highly related to the difference between the RGB value of the tested sensor and that of its control membrane, as depicted in Fig. 3d. Hypothetically, a DTZ-membrane that captures a higher amount of Hg2+ will demonstrate a color distribution that moves towards to the hot color region (red, R-axis, reacted color from Hg2+–DTZ complexes) from the cold color region (green, G-axis, the original DTZ-membrane color). It was expected that the greater the color intensity difference of the tested strip (hot color) from the control membrane (cold color) at the R-axis, then the higher the detection efficiency of the membrane to capture Hg2+. In this study, the membranes changed from green (control membrane before testing with the Hg2+ ion solution) to orange and magenta (membranes tested with Hg2+ solution with the formation of Hg2+–DTZ complexes).
In a solution containing 10 ppm of Hg2+ (Fig. 3d), both the CA-AA-DTZ and CA-FA-DTZ sensor strips displayed full color changes from green to orange and light magenta, respectively. These colors fall in the hot-color region and were found to show an increase in the data plot intensity at the R-axis. Interestingly, the color intensity plot at the G-axis (green color) for the CA-FA-DTZ membrane was found to be shifted to the left. The decrease in green color intensity (original color for the CA-FA-DTZ membrane) was due to the formation of Hg2+–DTZ complexes when the higher concentrations of Hg2+ (5 ppm and 10 ppm) were tested. All the detection sites of the CA-FA-DTZ membrane were occupied to execute the complete color change (with no green color observed), and hence, a lower value of the color intensity was observed at the G-axis. However, the green background was still visible at the G-axis for the CA-AA-DTZ membrane, even at 5 ppm and 10 ppm of the Hg2+ solution. The color intensity plot at the G-axis was not reduced as expected. This might be due to the entrapment of DTZ inside the larger pore structure (Fig. 3a) of the CA-AA-DTZ membrane, which reduces the efficiency of the color change during Hg2+ detection.
Despite the fact that there was some inconsistency of color distribution on the membrane strip at low Hg2+ concentration, i.e., some overlapping color intensity plots at 3 ppm for the CA-AA-DTZ membrane, the DTZ-CA sensor strips demonstrated higher hot-color intensity with an increase in the metal concentration. In this work, the lowest concentration of Hg2+ ions used for the detection was at 3 ppm. However, the current study was not specifically designed to observe the amount of the detected metal, but focused on the improvement of metal detection by manipulating the membrane physical structure and chemical properties.
The DTZ loading capacity is closely related to the physical microstructure of a membrane. Therefore, an interconnected porous substrate was needed (in the present work the porous CA membrane was used) to accommodate the immobilization of the optical ligand, DTZ, onto the membrane surface, as to interact with Hg2+ in the testing solution. A porous membrane is critical for the rapid exposure of dithizone to the testing samples containing potential analytes. Indeed, a sensor is often better served by the use of a highly-porous membrane as the detection platform. As for the membrane physical structure, the miscibility/solubility parameter between the solvent and non-solvent during the phase inversion procedure in membrane formation will strongly affect the membrane porosity. In this study, deionized water (DI) was utilized as the non-solvent to induce membrane porosity and formic acid (FA) acted as the solvent to dissolve the CA polymer. The ratio of FA to DI was adjusted based on a constant CA polymer weight of 17 wt% and the SEM micrographs of the synthesized membranes are presented in Fig. 4.
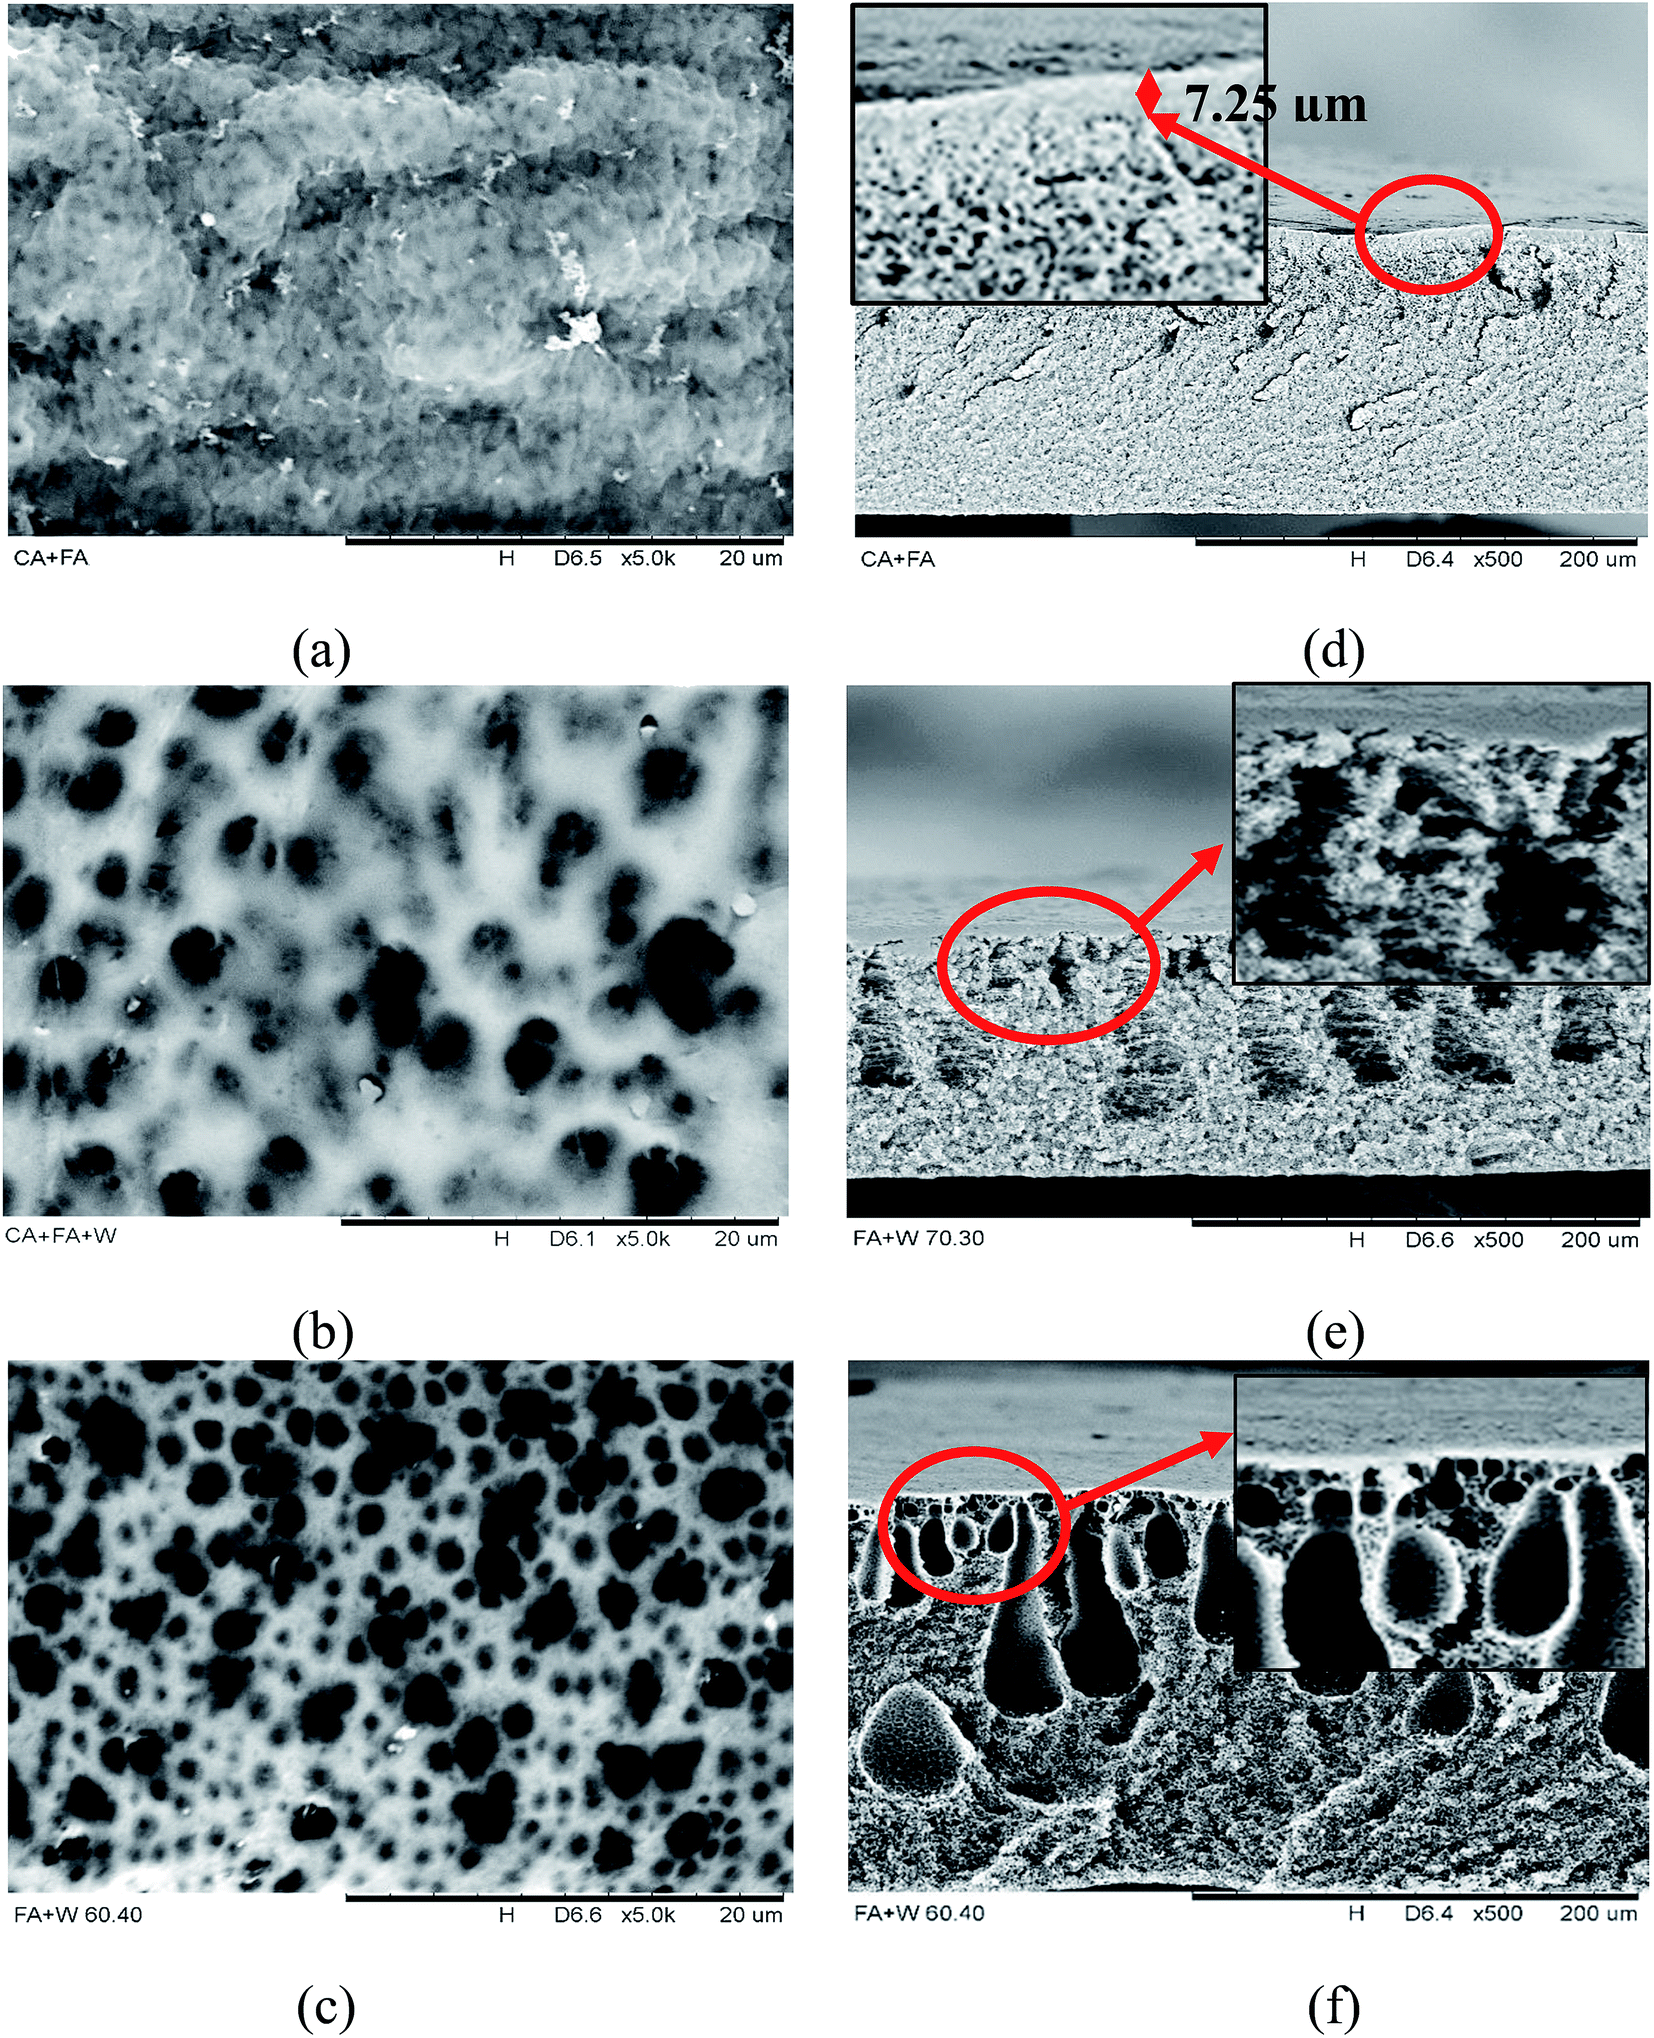 | ||
| Fig. 4 SEM surface and cross-sections for (a and d) CA-FA, (b and e) CA-FA:30DI and (c and f) CA-FA:40DI membranes. | ||
The CA-FA membrane (Fig. 4a and d) exhibits a dense-skin layer with a thickness of 7.25 μm and also possesses a sponge-like porous substructure beneath this dense skin. The membrane comprises a larger surface area with its own characteristic smaller pores. Indeed, the formation of the dense-skin layer was attributed to the differences in the solubility parameters for FA solvent in the casting dope and water in the coagulant bath during membrane solidification. The CA polymer, FA solvent, and water have Hansen solubility indices of 25.1 MPa1/2, 27.6 MPa1/2 and 47.9 MPa1/2, respectively.48–50 The high solubility differences in FA (27.6 MPa1/2) and water (47.9 MPa1/2) caused delayed demixing during phase inversion, which is often associated with the formation of a dense skin top-layer on the membrane–air interface.
In contrast, when the non-solvent (deionized water, DI) was added into the casting dope, the CA FA:30DI membrane displays a porous surface (Fig. 4b) with a sponge-like shape around the finger-like structure in the cross-sectional image (Fig. 4e). It can be assured that this type of membrane consists of larger pores and has higher porosity, compared to the CA-FA membrane. As noted above, the differences in the solubility parameters for the solvent and non-solvent affect the membrane morphology. The highly porous and finger-like structures found in Fig. 4b and e may due to the mixing of the solubility properties of FA and DI in the casting dope. This creates a smaller difference between the solubility properties of the casting dope (mixing of FA and water) and those of the coagulation bath (water), thus enhancing the miscibility of the casting dope (FA–DI) with the non-solvent (DI water) during solvent exchange. Furthermore, the addition of a small amount of water in the casting dope will reduce the thermodynamic miscibility of the dope and result in faster precipitation during phase inversion.51 The thermodynamic instability of the casted film will enhance the diffusion of solvent into the coagulation bath52 to form a solidified membrane.
As more DI water was added to the casting dope, the CA-FA:40DI membrane demonstrated an even more porous structure (Fig. 4c). As is also apparent from Fig. 4f, finger-like structures were formed with larger voids compared to those of the CA-FA:30DI membrane (Fig. 4e). This proves that the addition of non-solvent (DI water) in the polymer dope is capable of increasing the membrane porosity.53 Indeed, a membrane with high porosity has the advantage of facilitating the overall immobilization process, where the diffusion resistance of DTZ attached onto the porous matrix is lower, and there are plenty of voids.27,42 However, further increasing the amount of water will cause the membrane to lose its mechanical properties due to the formation of macrovoids or over-sized finger-like structures. Furthermore, a highly porous membrane with larger pores tends to have relatively lower surface area availability, subsequently decreasing the total membrane surface area necessary for DTZ immobilization to take place.
Fig. 5 illustrates the effect of non-solvent composition on membrane porosity by showing the specific pore size and the pore diameter distribution. The pore size distribution was measured based on approximately 60 pores for each membrane, to increase the accuracy of the pore distribution trend. As seen in Fig. 5, the CA-FA membrane (Fig. 5a) appears to have the smallest pore size with a mean diameter of 0.319 ± 0.149 μm. Meanwhile, with increasing DI content in the casting dope, the CA-FA:30DI membrane (Fig. 5b) and CA-FA:40DI membrane (Fig. 5c) have mean diameters of 0.698 ± 0.217 μm and 1.297 ± 0.398 μm, respectively. These results are consistent with the variation in membrane structure indicated in Fig. 4, confirming that the addition of the higher amount of non-solvent in the dope solution leads to the formation of the larger membrane pores.53 Again, this confirms the ability of water to act as an effective pore former that increases the porosity of the membrane and leads to larger void structures.
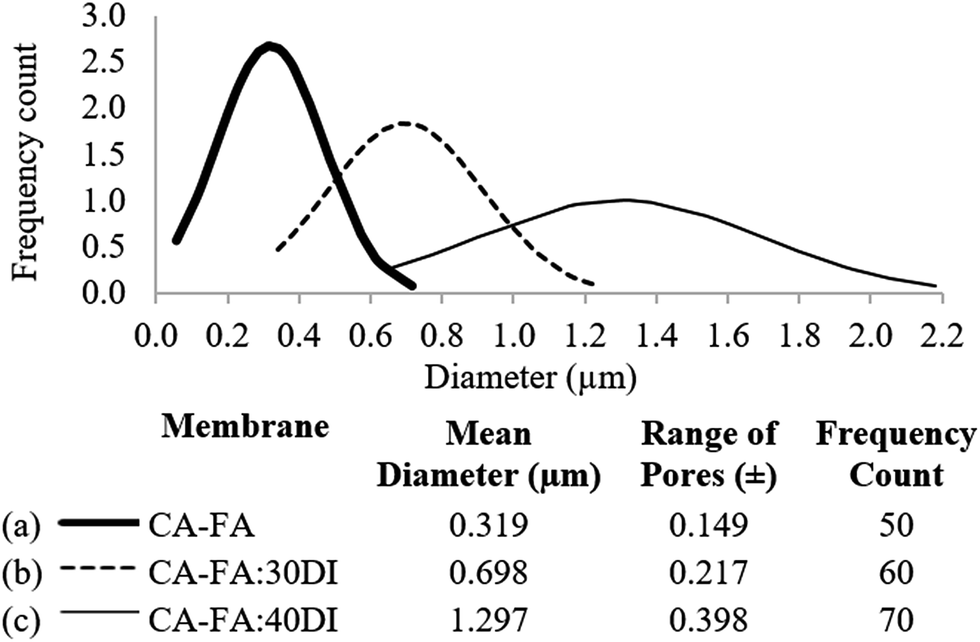 | ||
| Fig. 5 Pore diameter distribution for (a) CA-FA, (b) CA-FA:30DI and (c) CA-FA:40DI membranes. | ||
The increase in the membrane porosity was expected to give a different type of color assessment due to the varying level of DTZ immobilization on the membrane surface. The performances of the DTZ-immobilized CA-FA, CA-FA:30DI and CA-FA:40DI membranes for the detection of Hg2+ (3–10 ppm) were assessed, and the results are displayed in Fig. 6.
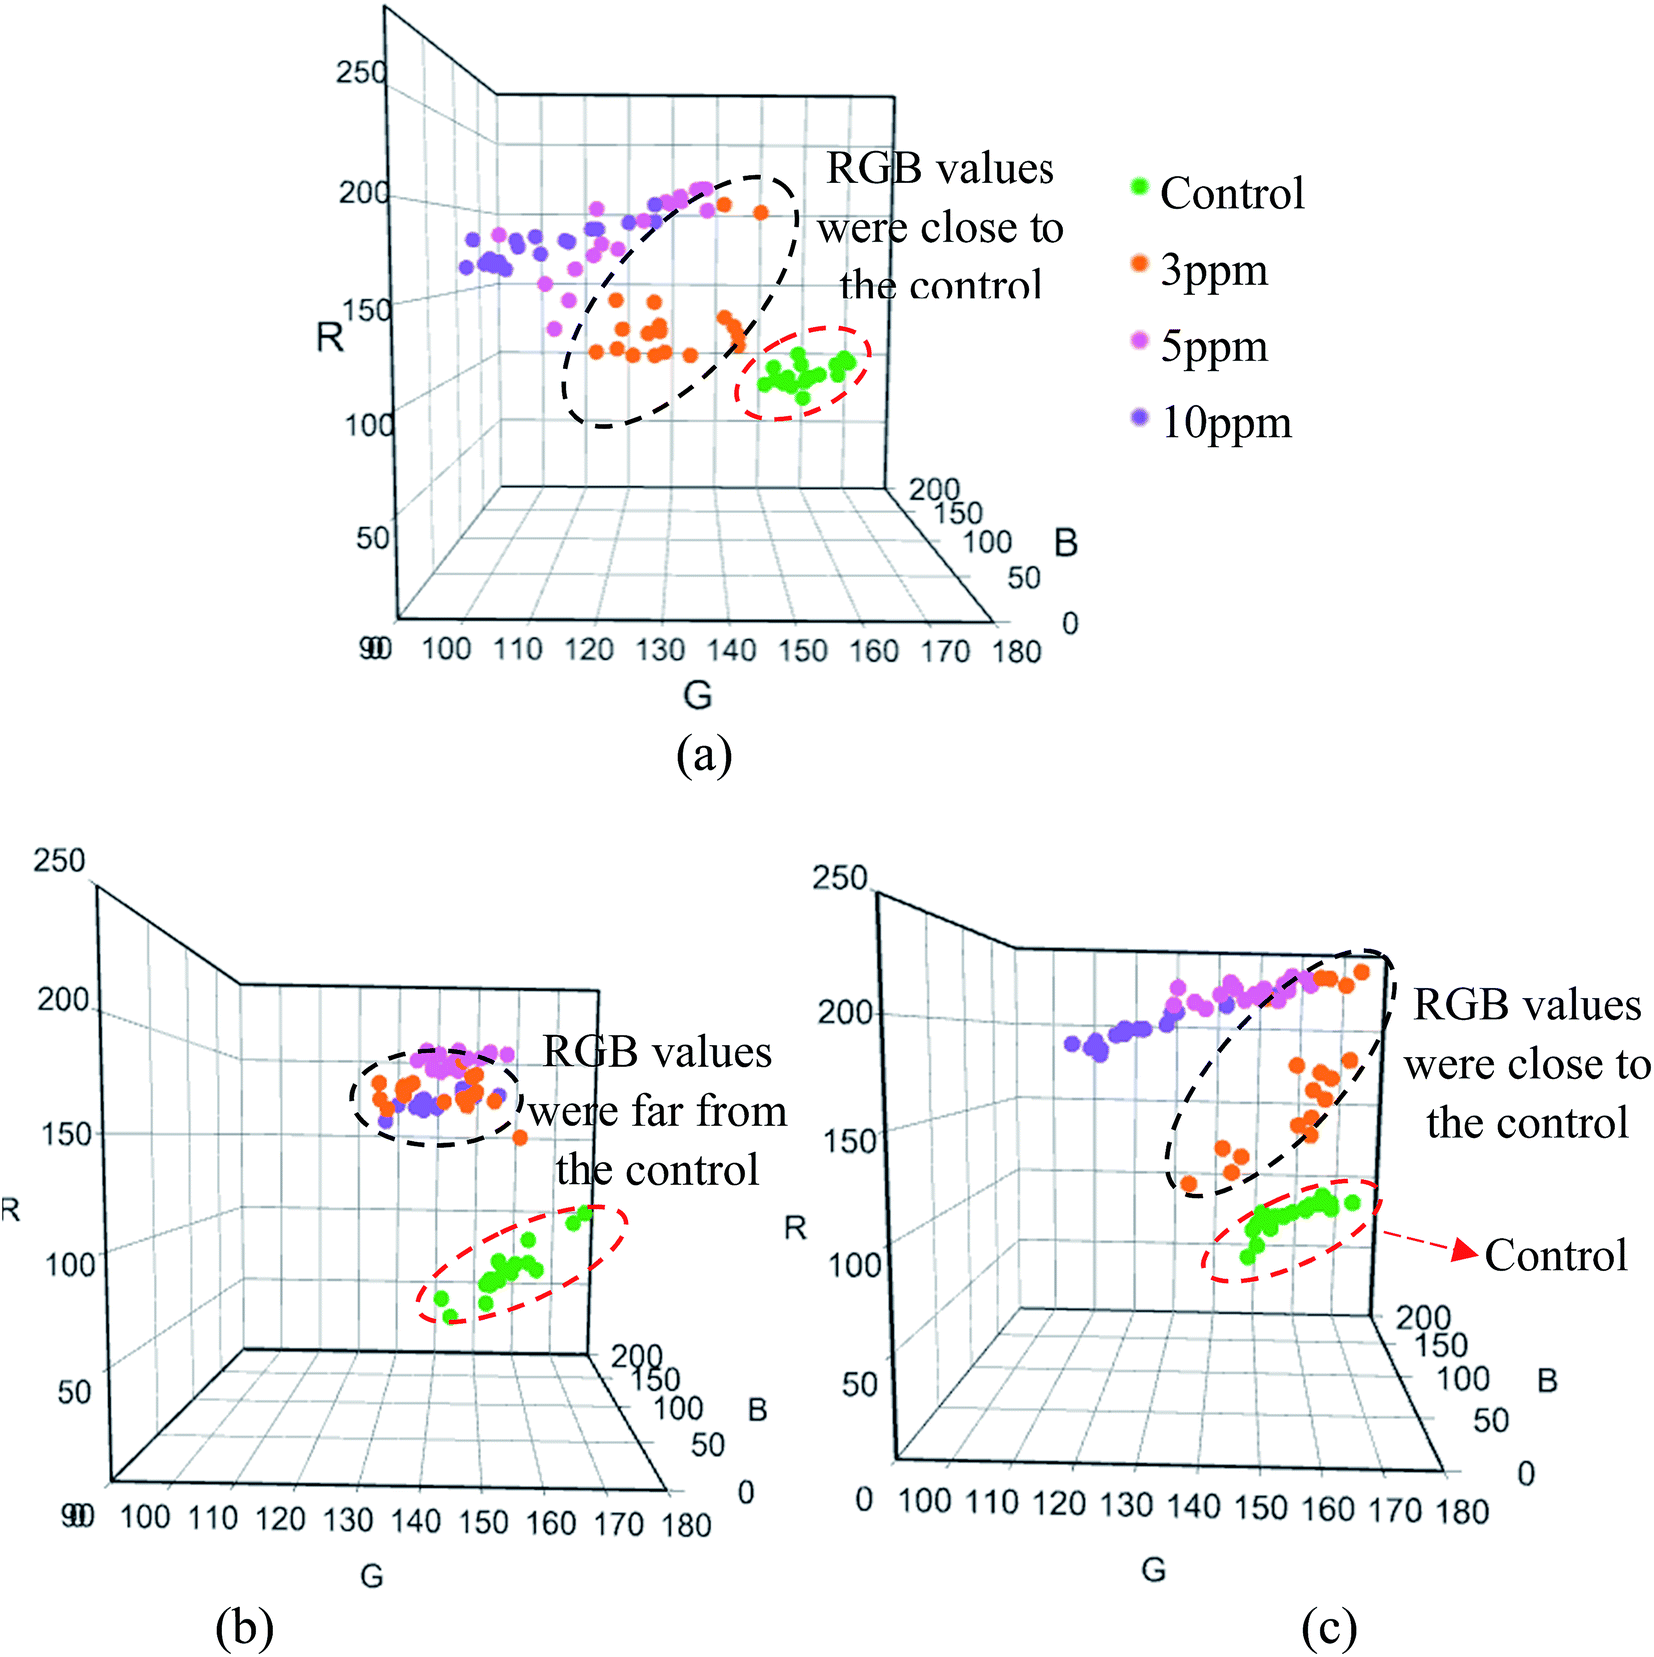 | ||
| Fig. 6 Performances of the DTZ-colorimetric sensors: (a) CA-FA, (b) CA-FA:30DI and (c) CA-FA:40DI, for the detection of Hg2+. | ||
Contrary to expectations, there were no significant differences in the RGB values (green color) of all control membranes prior to Hg2+ detection. In other words, the immobilization level of DTZ on the membrane surfaces was the same, regardless of the variations in membrane structure. However, when the membranes were tested with 3 ppm Hg2+ solution, differences in the RGB values were observed, as highlighted in Fig. 6 and 7. Not all of the surface area of the CA-FA-DTZ sensor strip changed from green to greenish-orange color; thus, the distribution of the RGB values was close to that of the control membrane (Fig. 6a). Meanwhile, major color changes from green to light magenta and greenish-orange for the CA-FA:30DI-DTZ (Fig. 6b) and CA-FA:40DI-DTZ (Fig. 6c) membranes, respectively, were identified.
 | ||
| Fig. 7 Color value at R-axis for DTZ-colorimetric sensor: (a) CA-FA, (b) CA-FA:30DI and (c) CA-FA:40DI tested with 3 ppm Hg2+ solution. | ||
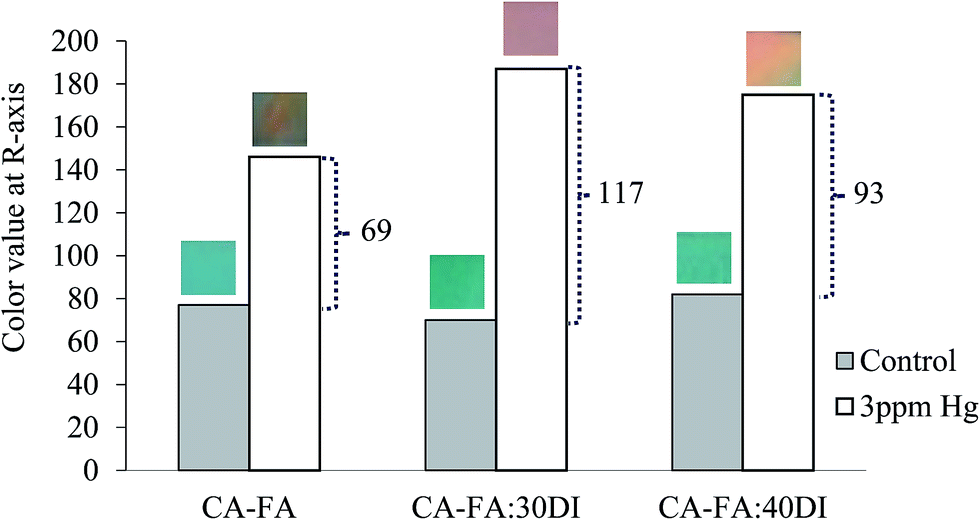
In Fig. 6b, the RGB values for the CA-FA:30DI-DTZ membrane sensor tested with 3 ppm of Hg2+ are far from those of the control membrane and are close to the hot-color region, relative to that of the CA-FA:40DI-DTZ (Fig. 6c) and CA-FA-DTZ (Fig. 6a) membranes. As mentioned earlier, the greater the distance of color distribution from the control membrane, the better the sensitivity of the membrane sensor to detect Hg2+. Fig. 7 further analyzes the color intensity at the R-axis for the membrane sensors tested in 3 ppm Hg2+. The R-axis was chosen because it is the hot-color region that represents the color changes due to the formation of Hg2+–DTZ complexes. As expected, the CA-FA:30DI-DTZ membrane demonstrated the highest difference in R-value from its control membrane, i.e. 117 in comparison to CA-FA-DTZ (63) and CA-FA:30DI-DTZ (93). As discussed earlier, the CA-FA:30DI-DTZ membrane comprises a porous surface with finger-like structures, and it is thus easier for DTZ molecules to be immobilized on the membrane surface, further increasing the detection efficiency. Logically, the CA-FA:40DI-DTZ membrane, which has the highest porosity, should show better detection. However, the membrane was found to have over-sized pores, i.e. 1.3 μm, which is almost two-fold (0.7 μm) and four-fold (0.3 μm) that of the CA-FA:30DI-DTZ and CA-FA-DTZ membranes, respectively. The total surface area of this membrane was found to be the lowest and thus, the membrane possesses fewer binding sites to accommodate DTZ molecules, which is further demonstrated by the lower efficiency of the sensor.
It was hypothesized that the sensor would respond differently (different RGB values) when a higher amount of DI (non-solvent) is added into the casting dope, due to the different membrane microstructures that affect DTZ immobilization. However, a closer inspection revealed that there was only a small difference in RGB values for the CA-FA:30DI-DTZ and CA-FA:40DI-DTZ sensors at 5 ppm and 10 ppm Hg2+. Interestingly, both CA-FA:30DI-DTZ and CA-FA:40DI-DTZ demonstrated similar color intensity plots, as shown in Fig. 6b and c, respectively. Both types of sensors (Fig. 6b and c) exhibited overlapping RGB data when tested with 5 ppm and 10 ppm Hg2+. This might be due to color saturation effects. Despite this, the above results still confirm that an appropriate amount of DI water in the casting dope does play a prominent role in improving the sensitivity of the membrane sensor to detect Hg2+. In this work, CA-FA:30DI-DTZ performed best, and was found to have a detection sensitivity of 3 ppm, which is preferable for metal sensing applications.
4. Conclusions
Taken together, these findings highlight the role of membrane structure in the successful immobilization of dithizone (DTZ). The CA membrane-based sensors with DI water added as a non-solvent (CA-FA:30DI-DTZ and CA-FA:40DI-DTZ) demonstrate higher membrane porosity, which improves the detection sensitivity for Hg2+. All of the prepared membrane sensors demonstrate obvious color changes at 5 ppm. Nevertheless, membrane sensors with high sensitivity (ability to detect lower Hg2+ concentration) are preferable for metal sensing applications. In this work, the CA-FA:30DI-DTZ membrane sensor showed better potential to detect the lower concentration of Hg2+ (3 ppm).Conflicts of interest
There are no conflicts of interest to declare.Acknowledgements
The authors gratefully acknowledge the financial support from MOSTI EScience Fund (305/PJKIMIA/6013393). N. A. Azmi is financially assisted by the Ministry of Higher Education (MOHE).References
- M. Barakat, Arabian J. Chem., 2011, 4, 361–377 CrossRef CAS.
- M. Castro-González and M. Méndez-Armenta, Environ. Toxicol. Pharmacol., 2008, 26, 263–271 CrossRef PubMed.
- S. Majumder, G. Gangadhar, S. Raghuvanshi and S. Gupta, J. Water Process Eng., 2015, 6, 136–143 CrossRef.
- P. B. Tchounwou, C. G. Yedjou, A. K. Patlolla and D. J. Sutton, Heavy Metal Toxicity and the Environment, Springer Basel, Basel, 2012 Search PubMed.
- H. Jaman, D. Chakraborty and P. Saha, Clean: Soil, Air, Water, 2009, 37, 704–711 CrossRef CAS.
- S. M. Husnain, J.-H. Kim, C.-S. Lee, Y.-Y. Chang, W. Um and Y.-S. Chang, RSC Adv., 2016, 6, 35825–35832 RSC.
- A. Rezaee, J. Derayat, S. Mortazavi, Y. Yamini and M. Jafarzadeh, Am. J. Environ. Sci., 2005, 1, 102–105 CrossRef CAS.
- B. V. Tangahu, S. R. Sheikh Abdullah, H. Basri, M. Idris, N. Anuar and M. Mukhlisin, Int. J. Chem. Eng., 2011, 2011, 31 CrossRef.
- R. Sitko, M. Musielak, B. Zawisza, E. Talik and A. Gagor, RSC Adv., 2016, 6, 96595–96605 RSC.
- D. P. Torres, M. B. Martins-Teixeira, S. Cadore and H. M. Queiroz, J. Environ. Sci. Health, Part B, 2015, 50, 514–522 CrossRef CAS PubMed.
- J. Fan, Y. Qin, C. Ye, P. Peng and C. Wu, J. Hazard. Mater., 2008, 150, 343–350 CrossRef CAS PubMed.
- M. Fayazi, M. A. Taher, D. Afzali and A. Mostafavi, Sens. Actuators, B, 2016, 228, 1–9 CrossRef CAS.
- E. A. Osipova, V. E. Sladkov, A. I. Kamenev, V. M. Shkinev and K. E. Geckeler, Anal. Chim. Acta, 2000, 404, 231–240 CrossRef CAS.
- Y. Zhang, G.-M. Zeng, L. Tang, Y.-P. Li, Z.-M. Chen and G.-H. Huang, RSC Adv., 2014, 4, 18485–18492 RSC.
- M. R. Mahmoudian, W. J. Basirun and Y. Alias, RSC Adv., 2016, 6, 36459–36466 RSC.
- L. Zhang, Y.-H. Zhao and R. Bai, J. Membr. Sci., 2011, 379, 69–79 CrossRef CAS.
- J. S. Wilson, Sensor technology handbook, Elsevier, Burlington, 2004 Search PubMed.
- B. A. Garcia Grajeda, S. G. Soto Acosta, S. A. Aguila, H. P. Guevara, M. E. Diaz-Garcia, A. C. Enriquez and J. J. Campos-Gaxiola, RSC Adv., 2017, 7, 31611–31618 RSC.
- Y.-R. Kim, R. K. Mahajan, J. S. Kim and H. Kim, ACS Appl. Mater. Interfaces, 2010, 2, 292–295 CAS.
- M. Anju, T. Divya, M. P. Nikhila, T. V. A. Kusumam, A. K. Akhila, V. A. Ansi and N. K. Renuka, RSC Adv., 2016, 6, 109506–109513 RSC.
- S. Kraithong, P. Damrongsak, K. Suwatpipat, J. Sirirak, P. Swanglap and N. Wanichacheva, RSC Adv., 2016, 6, 10401–10411 RSC.
- K. T. Kim, H. S. Jung, J. Ahn, Y. Choi, J. H. Jung and J. Park, RSC Adv., 2016, 6, 79405–79409 RSC.
- J. H. Kim, H. J. Kim, S. H. Kim, J. H. Lee, J. H. Do, H.-J. Kim, J. H. Lee and J. S. Kim, Tetrahedron Lett., 2009, 50, 5958–5961 CrossRef CAS.
- J. F. Zhang, C. S. Lim, B. R. Cho and J. S. Kim, Talanta, 2010, 83, 658–662 CrossRef CAS PubMed.
- T. Balaji, S. A. El-Safty, H. Matsunaga, T. Hanaoka and F. Mizukami, Angew. Chem., 2006, 118, 7360–7366 CrossRef.
- I. Oehme and O. S. Wolfbeis, Microchim. Acta, 1997, 126, 177–192 CrossRef CAS.
- A. Safavi and M. Bagheri, Sens. Actuators, B, 2004, 99, 608–612 CrossRef CAS.
- M. Sun, B. Ding and J. Yu, RSC Adv., 2012, 2, 1373–1378 RSC.
- I. C. Santos, R. B. Mesquita and A. O. Rangel, Talanta, 2015, 143, 359–365 CrossRef CAS PubMed.
- Y. Takahashi, S. Danwittayakul and T. M. Suzuki, Analyst, 2009, 134, 1380–1385 RSC.
- L. Li, L. Liao, Y. Ding and H. Zeng, RSC Adv., 2017, 7, 10361–10368 RSC.
- M. Anari-Anaraki and A. Nezamzadeh-Ejhieh, J. Colloid Interface Sci., 2015, 440, 272–281 CrossRef CAS PubMed.
- K. Zargoosh and F. F. Babadi, Spectrochim. Acta, Part A, 2015, 137, 105–110 CrossRef CAS PubMed.
- B. K. Momidi, V. Tekuri and D. R. Trivedi, Spectrochim. Acta, Part A, 2017, 180, 175–182 CrossRef CAS PubMed.
- N. Azmi and S. Low, J. Water Process Eng., 2017, 15, 37–42 CrossRef.
- M. K. LaGasse, J. M. Rankin, J. R. Askim and K. S. Suslick, Sens. Actuators, B, 2014, 197, 116–122 CrossRef CAS.
- Z. Xu, P. Deng, J. Li and S. Tang, Sens. Actuators, B, 2018, 255, 2095–2104 CrossRef CAS.
- S. H. Lim, J. W. Kemling, L. Feng and K. S. Suslick, Analyst, 2009, 134, 2453–2457 RSC.
- M. Hong, X. Lu, Y. Chen and D. Xu, Sens. Actuators, B, 2016, 232, 28–36 CrossRef CAS.
- R. Zare-Dorabei, R. Rahimi, A. Koohi and S. Zargari, RSC Adv., 2015, 5, 93310–93317 RSC.
- J. W. Kemling, A. J. Qavi, R. C. Bailey and K. S. Suslick, J. Phys. Chem. Lett., 2011, 2, 2934–2944 CrossRef CAS PubMed.
- Z. Zhang, J. Gao, W. Zhang and Z. Ren, Sep. Sci. Technol., 2006, 41, 3245–3263 CrossRef CAS.
- Z. A. Jawad, A. L. Ahmad, S. C. Low and S. Zein, Curr. Nanosci., 2015, 11, 69–79 CrossRef CAS.
- C. Yin, J. Iqbal, H. Hu, B. Liu, L. Zhang, B. Zhu and Y. Du, J. Hazard. Mater., 2012, 233, 207–212 CrossRef PubMed.
- S. Danwittayakul, Y. Takahashi, T. Suzuki and A. Thanaboonsombut, J. Met., Mater. Miner., 2008, 18, 37–40 Search PubMed.
- B. Kumar, H. B. Singh, M. Katyal and R. L. Sharma, Microchim. Acta, 1991, 105, 79–87 CrossRef.
- T. J. Dickerson, N. N. Reed, J. J. LaClair and K. D. Janda, J. Am. Chem. Soc., 2004, 126, 16582–16586 CrossRef CAS PubMed.
- C. M. Hansen, Hansen solubility parameters: a user's handbook, CRC press, 2007 Search PubMed.
- R. B. Romero, C. A. P. Leite and M. d. C. Gonçalves, Polymer, 2009, 50, 161–170 CrossRef CAS.
- Z. A. Jawad, A. L. Ahmad, S. C. Low, T. L. Chew and S. H. S. Zein, J. Membr. Sci., 2015, 476, 590–601 CrossRef CAS.
- P. van de Witte, P. J. Dijkstra, J. W. A. van den Berg and J. Feijen, J. Membr. Sci., 1996, 117, 1–31 CrossRef CAS.
- J. Mulder, Basic Principles of Membrane Technology, Springer Science & Business Media, Netherlands, 2012 Search PubMed.
- M. Z. Yunus, Z. Harun, H. Basri and A. F. Ismail, Adv. Mater. Res., 2012, 488–489, 46–50 CrossRef.
| This journal is © The Royal Society of Chemistry 2018 |